

To evaluate the contribution of ultra-processed food (UPF) on the dietary consumption of children treated at a Basic Health Unit and the associated factors.
MethodologyCross-sectional study carried out with a convenience sample of 204 children, aged 2–10 years old, in Southern Brazil. Children's food intake was assessed using a 24-h recall questionnaire. Food items were classified as minimally processed, processed for culinary use, and ultra-processed. A semi-structured questionnaire was applied to collect socio-demographic and anthropometric variables. Overweight in children was classified using a Z score >2 for children younger than 5 and Z score >+1 for those aged between 5 and 10 years, using the body mass index for age.
ResultsOverweight frequency was 34% (95% CI: 28–41%). Mean energy consumption was 1672.3kcal/day, with 47% (95% CI: 45–49%) coming from ultra-processed food. In the multiple linear regression model, maternal education (r=0.23; p=0.001) and child age (r=0.40; p<0.001) were factors associated with a greater percentage of UPF in the diet (r=0.42; p<0.001). Additionally, a statistically significant trend for higher UPF consumption was observed when data were stratified by child age and maternal educational level (p<0.001).
ConclusionsThe contribution of UPF is significant in children's diets and age appears to be an important factor for the consumption of such products.
Avaliar a contribuição dos alimentos ultraprocessados no consumo alimentar de crianças pertencentes à área de abrangência de uma Unidade Básica de Saúde e os fatores associados.
MetodologiaEstudo transversal com amostra de conveniência de 204 crianças, entre 2 a 10 anos de idade, no Sul do Brasil. O consumo alimentar das crianças foi obtido por meio do Recordatório Alimentar de 24 horas e, posteriormente, os alimentos foram classificados em alimentos minimamente processados, processados para culinária e ultraprocessados. Um questionário semiestruturado foi aplicado para a coleta das variáveis sociodemográficas e antropométricas. O excesso de peso das crianças foi definido por meio do escore Z>2 para crianças menores de 5 anos e escore Z>+1 para aquelas com idade entre 5 e 10 anos segundo o Índice de Massa Corporal para idade.
ResultadosA frequência de excesso de peso foi de 34% (IC95%: 28% a 41%). O consumo médio de energia foi de 1.672,3kcal/dia, sendo 47% (IC95%: 45% a 49%) proveniente dos ultraprocessados. No modelo de regressão linear múltipla, a escolaridade materna (r=0,23; p=0,001) e a idade da criança (r=0,40; p<0,001) foram associados à maior contribuição percentual dos ultraprocessados na alimentação (R=0,42; p<0,001). Adicionalmente foi observada uma tendência linear significativa para maior consumo de ultraprocessados quando os dados foram estratificados pela idade da criança e nível de escolaridade materna (p<0,001).
ConclusõesA contribuição dos ultraprocessados é expressiva na alimentação infantil e a idade da criança mostrou- se como fator associado mais importante para o consumo destes produtos.
The prevalence of obesity and non-communicable chronic diseases (NCDs) associated with diet has grown at a fast pace, and rates in the pediatric population are remarkable.1 According to the National Survey on Demographics and Health of 2006, a national overweight prevalence of 6.6% was recorded in children aged up to 5 years of age.2 However, the results of the Household Budget Survey (HBS) showed that the overweight prevalence ranged from 25% to 40% in children aged between 5 and 9 years.3
Scientific evidence indicates that the increase in overweight rates and NCDs is due, among other factors, to the inversion of dietary patterns.4 This inversion is characterized by the substitution of traditional food by highly processed and ready-to-consume foods and beverages.5
In general, ultra-processed foods (UPFs) have high energy density, excessive total and saturated fat, higher concentrations of sugar and/or sodium, and low fiber content.5–7 Also, due to their composition and processing, they are characteristically hyper-palatable, less perishable, and are ready for consumption. Thus, they have a large commercial advantage when compared to fresh or minimally processed food, in addition to being lower cost.5
HBS data indicate that the diet of Brazilian children is deficient in fruits and vegetables. It also shows an overconsumption of cookies, cold cuts, beverages with added sugar, sandwiches, and snacks.8
Among the factors that are associated with the quality of food in children's diet, parental income and educational level are especially significant. Research suggests that high-quality diet is directly associated with higher educational levels and income.9,10
There is evidence linking the occurrence of overweight in childhood and early development of diabetes mellitus, cardiovascular disease, dyslipidemia, and hypertension in adult life.11 Thus, childhood is a crucial period for the prevention of NCDs by encouraging and adopting healthy habits that tend to persist during adult life.12 Parents have great influence on the development of these habits by the child, so they must provide positive examples with regard to healthy eating associated with physical exercise.13
Therefore, the aim of this study was to evaluate the contribution of ultra-processed food in the dietary consumption of children treated at a Basic Health Unit and its associated factors.
MethodsA descriptive, cross-sectional study was performed with a convenience sample of children aged 2–10 years, who had previously scheduled appointments and were treated at a Basic Health Unit (BHU) in the city of Porto Alegre, state of Rio Grande do Sul, Brazil.
This study is part of a larger study entitled “Obesity and risk factors for chronic diseases in children treated at the Family Health Strategy in a Basic Health Unit of Porto Alegre, Brazil”. The sample included 204 children, which provided a statistical power of 90% for this study, to test a difference of means with an effect magnitude (E/S)≥0.5 standard deviation for α=0.05. Regarding the categorical data, this sample size provided a power of 80% in the comparison of proportions with differences ≥20% vs. 40% for α=0.05.
Only one child per household (same mother or guardian, biologically related or not) was included in the study. When more than one child in this age range and from the same household was treated at the BHU, the caregiver decided who would participate in the study. Exclusion criteria included the following: physical incapacity to undergo anthropometric measurements, gastrointestinal tract or oropharyngeal disorders that caused changes in the dietary consumption, and children with autism spectrum disorders.
The work team consisted of previously trained nutritionists and nutrition students and data collection occurred from September 2012 to July 2013. The anthropometric measurements were obtained in duplicate using standard techniques according to the World Health Organization.14 Weight (kg) was measured using a digital scale with a capacity of 200kg and accuracy of 50g; height (cm) was measured using a stadiometer fixed to the wall. Excess weight (overweight and obesity) was established for children younger than 5 years with a Z score indicator >2, and for those aged 5–10 years, with a Z score indicator >+1, according to the BMI for age.15 The anthropometric data were analyzed using Anthro Plus® software (Anthro®, WHO AnthroPlus, 2007, USA).
To assess food intake, two 24-h food-recall questionnaires. The first one was carried out through direct interviews with the child's mother or caregiver. The questions were about the child's food intake on the day before regarding the type, method of preparation, brand, measures used, and quantities consumed. To minimize recall bias and improve the quality of data on the size of the consumed portions, a photo album showing utensils and food items was used.16 The second 24-h recall was obtained by telephone contact after an interval of 1–8 weeks with the same person that answered the first questionnaire, on a day that did not correspond to the same day of the previous week, in order to subsequently estimate the mean consumption.
The conversion of the reported food items from home measurements into grams was based on the standardization by Pinheiro.17 Nutrient analysis was performed according to the Brazilian Table of Food Composition (Tabela Brasileira de Composição dos Alimentos – TACO),18 and also through labels, for those foods not listed in the table. Subsequently, the food items were grouped according to the definitions proposed by Monteiro et al.5 as unprocessed or minimally processed foods (G1), processed for culinary use (G2), or ultra-processed (G3).
The studied variables were as follows: (1) child: gender, age, weight, height, and food intake (calories, proteins, lipids, carbohydrates, fiber, sodium, saturated fat, monounsaturated fat, polyunsaturated fat, trans fat); (2) mother: age and educational level and (3) family unit: per capita income.
Macronutrients (carbohydrates, lipids, and proteins) were used for the analysis of the characteristics associated with the food contribution according to the degree of processing in the children's diet.
Maternal educational level was defined according to the number of years of schooling. This variable was dichotomized as: <11 years (up to incomplete high school) or ≥11 years (complete high school and/or college/university education). The family per capita income was assessed in reals (R$) and subsequently categorized as R$ <500 and R$ ≥500.
For the analysis, the children were stratified into two groups: preschoolers (2–6 years) and school-aged children (7–10 years). The study protocol was approved by the Research Ethics Committee of Hospital de Clínicas de Porto Alegre under No. 120124.
Quantitative data were initially described as mean and standard deviation. In the presence of asymmetry, medians and interquartile range (P25; P75) were used. The normality of distributions was tested using the Shapiro–Wilk test. Categorical data were summarized using absolute and relative frequencies. The mean (standard error) was used to display the central tendency of absolute contribution variables and the percentage of nutrient intake according to the degree of food processing.
Student's t-test was used to compare the quantitative variables and the chi-squared test was used for the comparison of proportions. In cases of asymmetry, the Mann–Whitney test was used.
To assess the independent association of the study factors that were significant in the univariate analysis, a multiple linear regression was performed using the percentage contribution of ultra-processed food (UPF) as the dependent variable.
Additionally, an analysis stratified by the mother's educational level and child's age was performed. The linear trend assessment of this stratification in relation to UPF percentage was performed through simple linear regression and for excess weight, through linear trend chi-squared test.
The level of statistical significance was considered as p<0.05 in all tests. Data were double entered using the EpiData® software (Epi Info, Version 6, Statistics Program for Public Health, 1995, USA), with consistency check. Statistical analyses were performed in SPSS software (IBM SPSS Statistics for Windows, Version 20.0, 2011, USA).
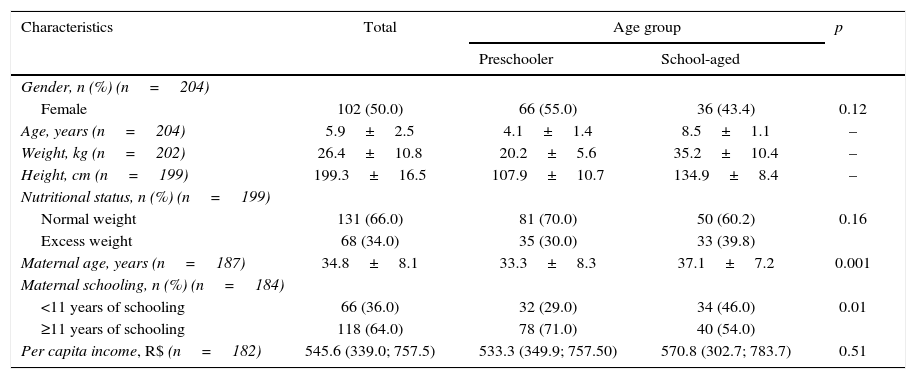
ResultsThe final sample consisted of 204 children, with a loss of five, due to lack of completion of the 24-h recall questionnaire. As for the sample characteristics, there were a higher number of school-aged children. Regarding gender, the proportions were similar. Excess weight frequency in the assessed sample was 34% (95% CI: 28–41%; Table 1).
Sample distribution according to sociodemographic and anthropometric characteristics.
| Characteristics | Total | Age group | p | |
|---|---|---|---|---|
| Preschooler | School-aged | |||
| Gender, n (%) (n=204) | ||||
| Female | 102 (50.0) | 66 (55.0) | 36 (43.4) | 0.12 |
| Age, years (n=204) | 5.9±2.5 | 4.1±1.4 | 8.5±1.1 | – |
| Weight, kg (n=202) | 26.4±10.8 | 20.2±5.6 | 35.2±10.4 | – |
| Height, cm (n=199) | 199.3±16.5 | 107.9±10.7 | 134.9±8.4 | – |
| Nutritional status, n (%) (n=199) | ||||
| Normal weight | 131 (66.0) | 81 (70.0) | 50 (60.2) | 0.16 |
| Excess weight | 68 (34.0) | 35 (30.0) | 33 (39.8) | |
| Maternal age, years (n=187) | 34.8±8.1 | 33.3±8.3 | 37.1±7.2 | 0.001 |
| Maternal schooling, n (%) (n=184) | ||||
| <11 years of schooling | 66 (36.0) | 32 (29.0) | 34 (46.0) | 0.01 |
| ≥11 years of schooling | 118 (64.0) | 78 (71.0) | 40 (54.0) | |
| Per capita income, R$ (n=182) | 545.6 (339.0; 757.5) | 533.3 (349.9; 757.50) | 570.8 (302.7; 783.7) | 0.51 |
Results are expressed as mean±SD, frequency (%), and median (P25, P75). Student's t-test; chi-squared; p<0.05.
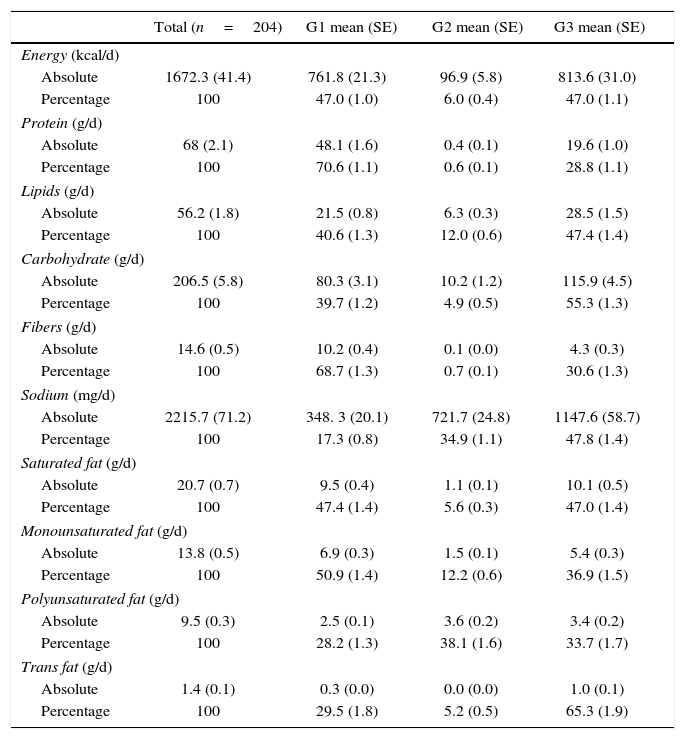
In relation to energy intake (Table 2), on average, children consumed 1672.3kcal/day, and 47% (95% CI: 45–49%) were derived from G3. The contribution of G1 food is significant due to the availability of essential nutrients such as protein, fiber, and monounsaturated fat. In the G3, a more significant contribution of lipids, carbohydrates, sodium, and trans fat was observed.
Absolute and percentage contribution to the daily nutrient intake according to the degree of food processing.
| Total (n=204) | G1 mean (SE) | G2 mean (SE) | G3 mean (SE) | |
|---|---|---|---|---|
| Energy (kcal/d) | ||||
| Absolute | 1672.3 (41.4) | 761.8 (21.3) | 96.9 (5.8) | 813.6 (31.0) |
| Percentage | 100 | 47.0 (1.0) | 6.0 (0.4) | 47.0 (1.1) |
| Protein (g/d) | ||||
| Absolute | 68 (2.1) | 48.1 (1.6) | 0.4 (0.1) | 19.6 (1.0) |
| Percentage | 100 | 70.6 (1.1) | 0.6 (0.1) | 28.8 (1.1) |
| Lipids (g/d) | ||||
| Absolute | 56.2 (1.8) | 21.5 (0.8) | 6.3 (0.3) | 28.5 (1.5) |
| Percentage | 100 | 40.6 (1.3) | 12.0 (0.6) | 47.4 (1.4) |
| Carbohydrate (g/d) | ||||
| Absolute | 206.5 (5.8) | 80.3 (3.1) | 10.2 (1.2) | 115.9 (4.5) |
| Percentage | 100 | 39.7 (1.2) | 4.9 (0.5) | 55.3 (1.3) |
| Fibers (g/d) | ||||
| Absolute | 14.6 (0.5) | 10.2 (0.4) | 0.1 (0.0) | 4.3 (0.3) |
| Percentage | 100 | 68.7 (1.3) | 0.7 (0.1) | 30.6 (1.3) |
| Sodium (mg/d) | ||||
| Absolute | 2215.7 (71.2) | 348. 3 (20.1) | 721.7 (24.8) | 1147.6 (58.7) |
| Percentage | 100 | 17.3 (0.8) | 34.9 (1.1) | 47.8 (1.4) |
| Saturated fat (g/d) | ||||
| Absolute | 20.7 (0.7) | 9.5 (0.4) | 1.1 (0.1) | 10.1 (0.5) |
| Percentage | 100 | 47.4 (1.4) | 5.6 (0.3) | 47.0 (1.4) |
| Monounsaturated fat (g/d) | ||||
| Absolute | 13.8 (0.5) | 6.9 (0.3) | 1.5 (0.1) | 5.4 (0.3) |
| Percentage | 100 | 50.9 (1.4) | 12.2 (0.6) | 36.9 (1.5) |
| Polyunsaturated fat (g/d) | ||||
| Absolute | 9.5 (0.3) | 2.5 (0.1) | 3.6 (0.2) | 3.4 (0.2) |
| Percentage | 100 | 28.2 (1.3) | 38.1 (1.6) | 33.7 (1.7) |
| Trans fat (g/d) | ||||
| Absolute | 1.4 (0.1) | 0.3 (0.0) | 0.0 (0.0) | 1.0 (0.1) |
| Percentage | 100 | 29.5 (1.8) | 5.2 (0.5) | 65.3 (1.9) |
G1, unprocessed or minimally processed foods; G2, processed for culinary use; G3, ultra-processed food; SE, standard error.
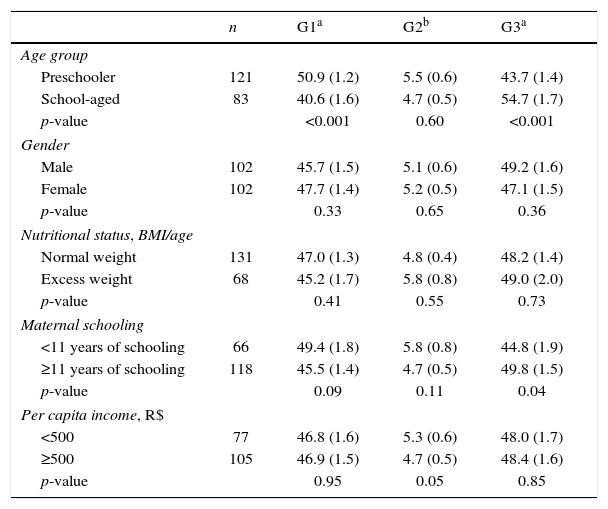
When analyzing the data regarding the percentage contribution of dietary intake of macronutrients according to the food processing degree (Table 3), it was observed that the food intake from G1 was inversely proportional to the increase in the child's age (p<0.001). In contrast, the proportion of G3 consumption showed a direct association with the increase in the child's age (p<0.001). In terms of gender, nutritional status, and per capita income, there were no significant differences in the contribution of the different groups.
Characteristics associated with the percentage contribution to macronutrient consumption according to the degree of food processing.
| n | G1a | G2b | G3a | |
|---|---|---|---|---|
| Age group | ||||
| Preschooler | 121 | 50.9 (1.2) | 5.5 (0.6) | 43.7 (1.4) |
| School-aged | 83 | 40.6 (1.6) | 4.7 (0.5) | 54.7 (1.7) |
| p-value | <0.001 | 0.60 | <0.001 | |
| Gender | ||||
| Male | 102 | 45.7 (1.5) | 5.1 (0.6) | 49.2 (1.6) |
| Female | 102 | 47.7 (1.4) | 5.2 (0.5) | 47.1 (1.5) |
| p-value | 0.33 | 0.65 | 0.36 | |
| Nutritional status, BMI/age | ||||
| Normal weight | 131 | 47.0 (1.3) | 4.8 (0.4) | 48.2 (1.4) |
| Excess weight | 68 | 45.2 (1.7) | 5.8 (0.8) | 49.0 (2.0) |
| p-value | 0.41 | 0.55 | 0.73 | |
| Maternal schooling | ||||
| <11 years of schooling | 66 | 49.4 (1.8) | 5.8 (0.8) | 44.8 (1.9) |
| ≥11 years of schooling | 118 | 45.5 (1.4) | 4.7 (0.5) | 49.8 (1.5) |
| p-value | 0.09 | 0.11 | 0.04 | |
| Per capita income, R$ | ||||
| <500 | 77 | 46.8 (1.6) | 5.3 (0.6) | 48.0 (1.7) |
| ≥500 | 105 | 46.9 (1.5) | 4.7 (0.5) | 48.4 (1.6) |
| p-value | 0.95 | 0.05 | 0.85 | |
G1, unprocessed or minimally processed food; G2, processed for culinary use; G3, ultra-processed food; BMI, body mass index. Results are expressed as mean (standard error).
When comparing the percentage of macronutrient consumption by the children and maternal educational level, it was observed that children whose mothers had <11 years of schooling tended to consume more G1 food (p=0.09), while those whose mothers had ≥11 years of schooling had a higher G3 contribution in their diets (p=0.04).
Based on the multiple linear regression model, with the G3 contribution percentage as the dependent variable, the factors maternal educational level (r=0.23; p=0.001) and child's age (r=0.40; p<0.001) showed a moderate multiple correlation and were significant factors for higher contribution of G3 in the children's diets (r=0.42; p<0.001).
Additionally, an increase in the consumption of UPF was observed when data were stratified by maternal educational level and the child's age. This finding reached statistical significance at the linear trend test (p<0.001). Excess weight also increased when comparing extreme groups in this stratification (18% vs. 38%); however, in the linear trend analysis the increase reached borderline significance (p=0.079).
DiscussionBased on the results, a high rate of excess weight was observed among the assessed children, thus making this nutritional problem in this age group noteworthy. The increasing overweight and obesity rates in childhood have been reported in the scientific literature, and are considered important predictors of obesity and development of NCDs in adult life.19,20
The excess weight frequency observed in this study are consistent with the results observed in Brazil. Similar values were found in a school-based survey conducted in the city of Itajaí, state of Santa Catarina, in which the observed frequency was 30% in children aged 6–11 years.9 The results of a study carried out in areas covered by Basic Health Units in Colombo, state of Parana, indicated lower frequencies, showing that 12% of children aged 2–5 years had excess weight.21
In this research, the caloric contribution from G3 was higher than that found for the Brazilian population, estimated at 28%.6 As for the population of Canada, this value becomes even more significant, representing 61% of the daily energy.7 However, none of the abovementioned studies assessed children exclusively, as did the present study.
As shown in Table 2, the contribution of carbohydrates and lipids in the children's diet was more significant in G3. This result reinforces the findings of higher intake of foods rich in fats and sugars, such as sandwich cookies, baked goods, candy, and soft drinks.22
The results of this study are also similar to those found in other studies. In Canada, one study compared a list of staple food consisting of food items from G1 plus G2 and another that included only items from G3. The list that did not contain the ultra-processed food showed higher protein content (19% vs. 10%) and fiber (14.8g vs. 6.8g), lower amount of total fat (33.8% vs. 39.3%), free sugars (3.8% vs. 18.6%), and sodium (3.1g vs. 3.8g).7 Brazilian studies indicate similar findings regarding these nutrients.5,23
Another negative aspect of UPF is its high sodium content. Excess sodium intake is associated with the development of hypertension.24 Blood pressure alterations in childhood are associated with this problem in adult life.25
It should also be noted that the salt used in food preparation or at the table is a G2 component. Therefore, added to the intrinsic sodium content of UPF, it increases the estimate of daily sodium intake by the children in the study.
According to Sarno et al.,24 excess of sodium consumption can be motivated by the increased consumption of processed foods. A study carried out in the US showed that, of the total daily consumed sodium, 44% came from breads, processed meats, pizzas, soups, sandwiches, cheese, and pasta- or meat-based meals.26
In Brazil, the estimates do not differ from those in other countries. The HBS data indicate that UPF consumption (pizza, processed meats, snacks, sandwich cookies, and soda) was associated with higher intake of sodium.8
Vitolo et al.27 suggest that there is a positive association between sodium intake and abnormal blood pressure in preschoolers. The researchers highlight the fact that they did not assess the salt added to the preparations and, therefore, they believe the main source of this nutrient came from UPF.
The results regarding fiber consumption from UPF reinforce what has been shown in the literature, i.e., foods in this group are extremely poor sources of this nutrient.5
Furthermore, UPF were the main source of trans fat found in the children's diets. This type of fat is widely used in the food industry to improve the physical and sensory aspects of the products. Excess trans fat consumption is associated with increased LDL-cholesterol, risk of cardiovascular disease, diabetes, and hypertension.28
Although the results did not reach statistical significance at the test of linear trend between the variables of excess weight and the child's age and maternal educational level, which may be due to the small number of children in each group, it can be observed (Fig. 1) that there was increasing growth in the first three categories. Similarly, the data shown in epidemiological studies indicate that there was a direct association between excess weight in children and the maternal educational level.19

The higher consumption of macronutrients derived from G3 by schoolchildren, compared to preschoolers, can be explained by the fact that they have greater autonomy regarding food choices. Therefore, they are more likely to suffer the influence of the environment in which they are inserted, which offers unhealthy food choices.29
In the present study, unlike what was indicated in some references,9,30 higher maternal educational level was associated with increased contribution of UPF in children's diets. However, this association with maternal educational level showed low magnitude (r=0.23) and was considerably lower than that observed between consumption of UPF and the child's age (r=0.40).
Furthermore, unlike what has been reported by some studies,10 the present study did not find an association between higher consumption of UPF and lower income. However, this finding may be explained by the fact that a sample of users of a BHU has relatively low income in the economic context of society. Thus, this relative homogeneity leads to low variability regarding income in the group, making it difficult (or misrepresenting) to detect associations with this factor and other collinear factors (e.g., educational level).
According to the study by Vitolo et al.,27 when assessing low-income children in a city in the metropolitan region of Porto Alegre, it was observed that UPF showed great contribution in the children's diet. The most consumed food items were breads (78.8%), sugary drinks (75.6%), sweet snacks (63.2%), cookies (52.5%), cold cuts (42.9%), potato chips (17.7%), and instant noodles (11.0%). However, it is noteworthy that most types of bread (e.g., French bread) have iron and folic acid in their composition, which are important nutrients in the children's diets. This type of food, in appropriate amounts, is part of a healthy diet.
However, there are indications that the increase in consumption of ultra-processed food affects both the population with the lowest income and those with the highest income. Also, it is suggested that the reduction in G1 food consumption is more significant among those with higher income.
Regarding the limitations of this study, the results cannot be generalized to other populations, as a specific population treated at a Basic Health Unit was included. Another important fact is that this study had a sample size of 204 children and, in some cases, the observed differences might not have reached statistical significance due to the limited statistical power. Also, the method used to estimate the daily intake (24-h recall) can underestimate or overestimate the actual consumption, as well as not necessarily reflecting the eating habits. Furthermore, there may be a recall bias, considering that the interviewee had to report the food consumption of the previous day.
It is concluded, based upon this study, that the contribution of UPF is significant in the assessed children's diets, demonstrating a poor quality regarding the presence of protective foods and nutrients, as well as health risk. Also, there was a higher frequency of UPF consumption by schoolchildren and children of mothers with higher educational levels. The high frequency of excess weight found in the study population is also noteworthy.
Therefore, the authors reinforce the need for food and nutrition educational strategies aimed at children and parents, considering that childhood is an important period for the encouragement and development of healthy eating habits. It is also emphasized that further studies should be carried out to assess the impact of UPF on the quality of children's diet and nutritional status.
Conflicts of interestThe authors declare no conflicts of interest.
Karen Sparrenberger received a CAPES Master's degree scholarship. The authors also would like to thank the Post-Graduate Program in Child and Adolescent Health of the School of Medicine of Universidade Federal do Rio Grande do Sul.
Please cite this article as: Sparrenberger K, Friedrich RR, Schiffner MD, Schuch I, Wagner MB. Ultra-processed food consumption in children from a Basic Health Unit. J Pediatr (Rio J). 2015;91:535–42.


