Low physical activity and sedentary behaviors, two important determinants of childhood obesity, may be influenced by parental lifestyle and weight status. This study aims to determine the association of parental weight status with children's physical activity and screen time.
MethodsThis study was conducted on 14,440 Iranian schools students, aged 7–18 years, and one of their parents, who participated in the large national school-based surveillance program. The children's screen-based and physical activities were evaluated based on the World Health Organization's Global School Student Health Survey. Children and parental height, weight, and waist circumference were measured using standardized methods.
ResultsOverall, 14,274 students and one of their parents completed the survey (participation rate: 99%). Mean (standard deviation) age of students was 12.3 (3.2) years, and the prevalence of low physical activity and high screen time was 58.2% and 17.7%, respectively. In multivariate model, the parental general obesity and abdominal obesity increased the odds of children having low physical activity, by 21% and 13%, respectively. Parental overweight, general obesity, and abdominal obesity increased the odds of the combination of low physical activity/high screen time in children by 33%, 26%, and 20%, respectively.
ConclusionsThis study showed that parental obesity was associated with increased screen-based activities and low physical activity in children. Focus on parental weight status, as an important factor influenced by their lifestyle, can be helpful for preventing sedentary behaviors in their children.
A baixa atividade física e comportamentos sedentários, dois importantes fatores determinantes de obesidade infantil, podem ser influenciados pelo estilo de vida e o status do peso dos pais. Este estudo visa determinar a associação do status do peso dos pais ao nível de atividade física e ao tempo de tela das crianças.
MétodosEste estudo é realizado em 14.440 estudantes de escolas iranianas, com idades entre 7-18 anos e um de seus pais inscritos no grande programa nacional de vigilância escolar. As atividades físicas e em tela das crianças foram avaliadas com base no questionário da Pesquisa Global de Saúde do Escolar da Organização Mundial de Saúde. A estatura, o peso e a circunferência da cintura das crianças e dos pais foram medidos utilizando métodos padronizados.
ResultadosDe modo geral, 14.274 estudantes e um de seus pais concluíram a pesquisa (taxa de participação: 99%). A idade média (desvio padrão) dos estudantes foi 12,3 (3,2) anos e a prevalência de baixa atividade física e alto tempo de tela foi 58,2% e 17,7%, respectivamente. Em um modelo multivariado, a obesidade geral dos pais e obesidade abdominal aumentaram as chances de as crianças com baixo nível de atividade física em 21% e 13%, respectivamente. Sobrepeso dos pais, obesidade geral e obesidade abdominal aumentaram as chances de combinação de baixo nível de atividade física/alto tempo de tela nas crianças em 33%, 26% e 20%, respectivamente.
ConclusõesEste estudo mostrou que a obesidade dos pais foi associada ao aumento nas atividades de tela e ao baixo nível de atividade física nas crianças. O foco no status do peso dos pais, como um importante fator influenciado por seu estilo de vida, pode ser útil na prevenção de comportamentos sedentários em seus filhos.
Nowadays, children spend a considerable part of their time with sedentary entertainment, such as watching television (TV), playing computer games, and surfing the Internet. In the United States, Australia, and Europe, the average time spent watching TV has been estimated to be about 5, 4, and 3.5h, respectively.1 Increasing sedentary activity is accompanied with less daily energy expenditure, energy imbalance, fat accumulation, overweight, and obesity.2 Obesity is a major risk factor of poor health among all age groups of school children worldwide, and has significantly increased over the last decades, especially in industrialized countries. Obesity among children and adolescents has more than doubled and quadrupled in the past three decades.3 In Iran, the prevalence of overweight and obesity was reported as 21.1% and 7.8% among adolescents.4 Studies have indicated that daily physical activity plays an important role in preventing obesity among children, while a sedentary lifestyle increases the risk of obesity and related diseases.5 Parents have an essential role in children's health behaviors, such as the physical activity, eating pattern, and sedentary behaviors.6 Studies have revealed that parental obesity can be closely associated with childhood obesity.7–9 Children from obese parents had a higher preference for sedentary activities, and spent more time in sedentary entertainments.10 In addition to the genetic predisposition of children with obese parents, parental obesity can influence their children's weight in many ways, including modeling unhealthy behaviors, as well as providing a shared family environment that stimulates and supports unhealthy eating patterns and sedentary lifestyles.11 However, the association of parental weight status as an independent factor with the joint association of children's activities and sedentary times has yet to be determined. Therefore, the present study was conducted to evaluate the effect of parental obesity on children's physical activities and sedentary behaviors.
MethodsStudy populationThis cross-sectional study was conducted on the participants of the fifth phase of the Childhood and Adolescence Surveillance and Prevention of Adult Non-communicable Disease (CASPIAN) study, a national school-based surveillance program implemented in Iran from 2003 onwards.12 The fifth phase of study (CASPIAN-V) was performed in 2015 the in urban and rural areas of 30 provinces of Iran, and participants included of 14,440 primary and secondary schools students, aged 7–18 years, and one of their parents, who were selected by multistage random cluster sampling method. Protocol details of the CASPIAN-V study have been explained previously.13
Data collectionA validated questionnaire obtained from the World Health Organization's Global School Student Health Survey (WHO-GSHS)14 was used to collect data on the student's characteristics and social and health behaviors. Another questionnaire including family characteristics, medical history, dietary habits, and leisure time activities was also completed by parents. The presence of one of the parents was considered sufficient.
DefinitionsTV time, computer time, screen time (ST), and physical activity (PA)Each individual was asked about the number of hours per day that spent watching television or videos (TV time), as well as working with a personal computer or playing electronic games (computer time), and then the ST was calculated by adding TV time to computer time. Based on the international ST recommendations, TV time, computer time, and ST were categorized into two groups; less than 2h/day was considered low, and 2h/day or more was considered high.15
For assessing the weekly frequency of leisure time physical activity outside the school during the past week, a validated questionnaire was used. Having sufficient physical activity was considered as at least 30min duration of exercises per day that led to sweating and large increases in breathing or heart rate.14
The joint associations of PA and ST were considered according to the following possible mixed conditions: low PA & low ST, low PA & high ST, high PA & low ST, and high PA & high ST. High PA & low ST and low PA & high ST were considered as the ideal and the worst combinations, respectively. High PA & high ST and low PA & low ST both were considered as the intermediate combinations.
Overweight, obesity, and abdominal obesity in parentsA team of health care professionals recorded anthropometric measurements both in children and in parents, using standard procedures. Weight was measured to the nearest 0.1kg using scales on flat ground, while the participants were minimally clothed. Height was measured to the nearest 0.1cm, in a standing position, without shoes. Waist circumference (WC) was measured to the nearest 0.1cm, using a non-elastic tape meter, at a point midway between the lower border of the rib cage and the iliac crest at the end of normal expiration. Hip circumference was measured to the nearest 0.1cm at the widest part of the hip at the level of the greater trochanter. Body mass index (BMI) was calculated as weight (kg) divided by the square of height (m2). Overweight and obesity in parents were defined according to BMI ≥25kg/m2 and BMI ≥30kg/m2, respectively. Abdominal obesity in parents was defined as WC ≥95cm and waist to hip ratio (WHR) ≥0.5 for both sexes.16
Socioeconomic status (SES)For calculating SES, an approved method was used, which previously provided for the Progress in the International Reading Literacy Study (PIRLS).17 Some variables such as parental occupation, parental education, school type (public/private), owning a private car, and possessing personal computer at home were summarized in one main component, by the principle component analysis (PCA) method. This main component was classified into three levels. The first level was considered as low SES, the second level as intermediate, and the third level as high SES.
Ethical concernsEthical committees of the Isfahan University of Medical Sciences and other relevant national regulatory organizations approved this survey (Project number: 194049). Written informed consent and verbal consent were obtained from all participants.
Statistical analysisSTATA software (StataCorp. 2009. Stata Statistical Software: version 11. College Station, TX, USA) was used for data analysis. Quantitative variables were expressed as mean±standard deviation (SD), and their mean differences were compared by Student's t-test. Qualitative variables were expressed as number (percentage), and the association between them was assessed by the chi-squared test. Odds ratios (95% confidence interval [CI]) for computer time, TV time, ST, PA, and joint associations of ST and PA categories according to parental weight status were assessed by logistic regression analyses in two different models; in model I, the association assessed without adjustment, while in model II, the association was adjusted for age, gender, region, and SES. In both models, the high PA & low ST group was considered as the reference. All statistical analysis was performed using survey analysis method. p-values <0.05 were considered statistically significant.
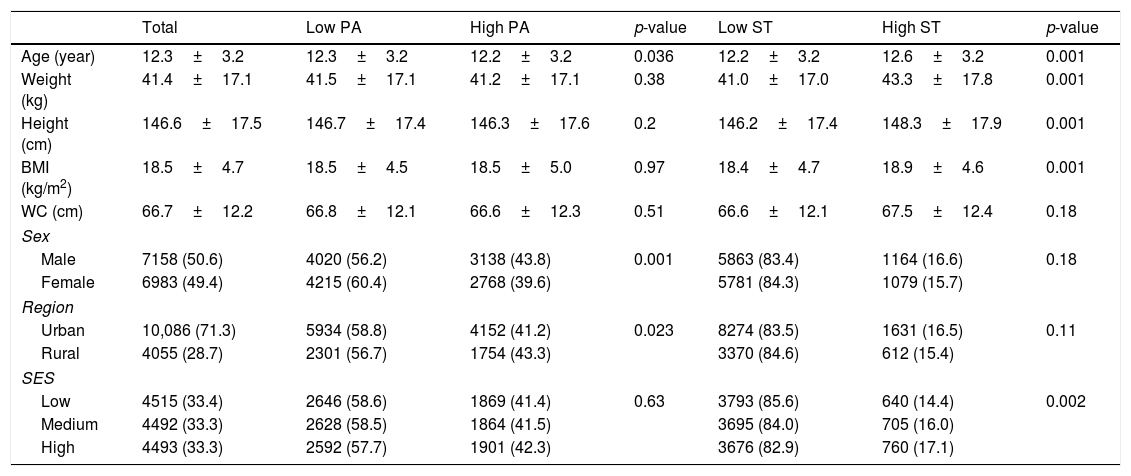
ResultsIn total, 14,274 students (50.6% boys, 49.4% girls) and one of their parents completed the survey (participation rate: 99%). The mean age of students was 12.3±3.2 years; 71.3% were from urban areas and 28.7% from rural areas. Demographic characteristics and anthropometric measures according to the range of PA and ST are presented in Table 1. It shows that there were no significant differences in the mean weight, height, BMI, WC, and SES between students with low or high PA; however, the mean age of students with high PA was significantly lower than those with low PA. Most of the students had low PA levels (58.2% of all students), which was different between boys and girls (56.2% of boys and 60.4% of girls) (p<0.001) and between urban and rural areas (58.8% in urban areas and 56.7% in rural areas) (p<0.05). Most of the students had low ST levels (82.3% of all students). The mean age, weight, height, and BMI were significantly higher in students with high ST compared with low ST (p<0.05).
Demographic characteristics and anthropometric measures of children and adolescents according to the range of physical activity and screen time.
| Total | Low PA | High PA | p-value | Low ST | High ST | p-value | |
|---|---|---|---|---|---|---|---|
| Age (year) | 12.3±3.2 | 12.3±3.2 | 12.2±3.2 | 0.036 | 12.2±3.2 | 12.6±3.2 | 0.001 |
| Weight (kg) | 41.4±17.1 | 41.5±17.1 | 41.2±17.1 | 0.38 | 41.0±17.0 | 43.3±17.8 | 0.001 |
| Height (cm) | 146.6±17.5 | 146.7±17.4 | 146.3±17.6 | 0.2 | 146.2±17.4 | 148.3±17.9 | 0.001 |
| BMI (kg/m2) | 18.5±4.7 | 18.5±4.5 | 18.5±5.0 | 0.97 | 18.4±4.7 | 18.9±4.6 | 0.001 |
| WC (cm) | 66.7±12.2 | 66.8±12.1 | 66.6±12.3 | 0.51 | 66.6±12.1 | 67.5±12.4 | 0.18 |
| Sex | |||||||
| Male | 7158 (50.6) | 4020 (56.2) | 3138 (43.8) | 0.001 | 5863 (83.4) | 1164 (16.6) | 0.18 |
| Female | 6983 (49.4) | 4215 (60.4) | 2768 (39.6) | 5781 (84.3) | 1079 (15.7) | ||
| Region | |||||||
| Urban | 10,086 (71.3) | 5934 (58.8) | 4152 (41.2) | 0.023 | 8274 (83.5) | 1631 (16.5) | 0.11 |
| Rural | 4055 (28.7) | 2301 (56.7) | 1754 (43.3) | 3370 (84.6) | 612 (15.4) | ||
| SES | |||||||
| Low | 4515 (33.4) | 2646 (58.6) | 1869 (41.4) | 0.63 | 3793 (85.6) | 640 (14.4) | 0.002 |
| Medium | 4492 (33.3) | 2628 (58.5) | 1864 (41.5) | 3695 (84.0) | 705 (16.0) | ||
| High | 4493 (33.3) | 2592 (57.7) | 1901 (42.3) | 3676 (82.9) | 760 (17.1) | ||
Data are expressed as means±SD or number (%).
BMI, body mass index; WC, waist circumference; ST, screen time; PA, physical activity; SES, socioeconomic status.
Low ST: <2h/day; high ST: ≥2h/day; low PA: 0–2days/week; high PA: 3–7days/week.
p-value <0.05 was considered statistically significant.
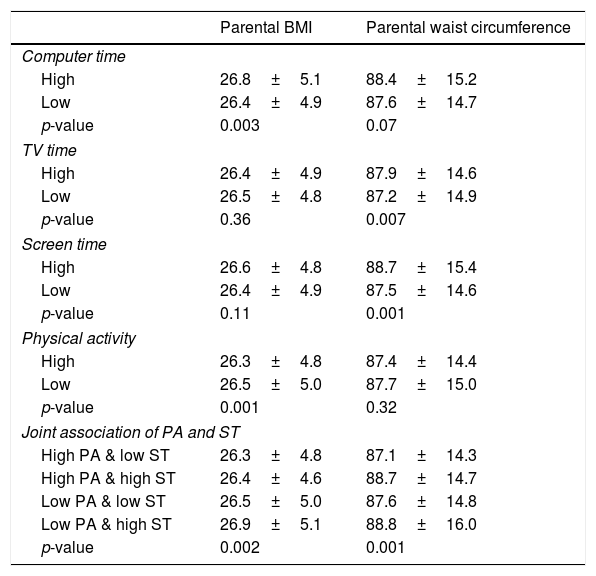
The means of parental BMI and WC according to children's PA and ST categories are illustrated in Table 2. As it is shown, the mean of parental BMI is significantly higher in students with high computer time (p<0.005) and low PA (p<0.001); the mean of parental WC was significantly higher in students with high TV time (p<0.05) and high ST (p<0.001). Regarding joint association of ST and PA, the means of parental BMI and WC were significantly higher in the combination of low PA/high ST (p<0.005 and p<0.001, respectively).
Mean±SD of parental BMI and waist circumference according to physical activity and screen time categories.
| Parental BMI | Parental waist circumference | |
|---|---|---|
| Computer time | ||
| High | 26.8±5.1 | 88.4±15.2 |
| Low | 26.4±4.9 | 87.6±14.7 |
| p-value | 0.003 | 0.07 |
| TV time | ||
| High | 26.4±4.9 | 87.9±14.6 |
| Low | 26.5±4.8 | 87.2±14.9 |
| p-value | 0.36 | 0.007 |
| Screen time | ||
| High | 26.6±4.8 | 88.7±15.4 |
| Low | 26.4±4.9 | 87.5±14.6 |
| p-value | 0.11 | 0.001 |
| Physical activity | ||
| High | 26.3±4.8 | 87.4±14.4 |
| Low | 26.5±5.0 | 87.7±15.0 |
| p-value | 0.001 | 0.32 |
| Joint association of PA and ST | ||
| High PA & low ST | 26.3±4.8 | 87.1±14.3 |
| High PA & high ST | 26.4±4.6 | 88.7±14.7 |
| Low PA & low ST | 26.5±5.0 | 87.6±14.8 |
| Low PA & high ST | 26.9±5.1 | 88.8±16.0 |
| p-value | 0.002 | 0.001 |
Data are expressed as mean±SD.
BMI, body mass index; WC, waist circumference; ST, screen time; PA, physical activity; SD, standard deviation; TV, television.
Low computer time: <2h/day; high computer time: ≥2h/day; low TV time: <2h/day; high TV time: ≥2h/day; low ST: <2h/day; high ST: ≥2h/day; low PA: 0–2days/week; high PA: 3–7days/week.
p-value <0.05 was considered statistically significant.
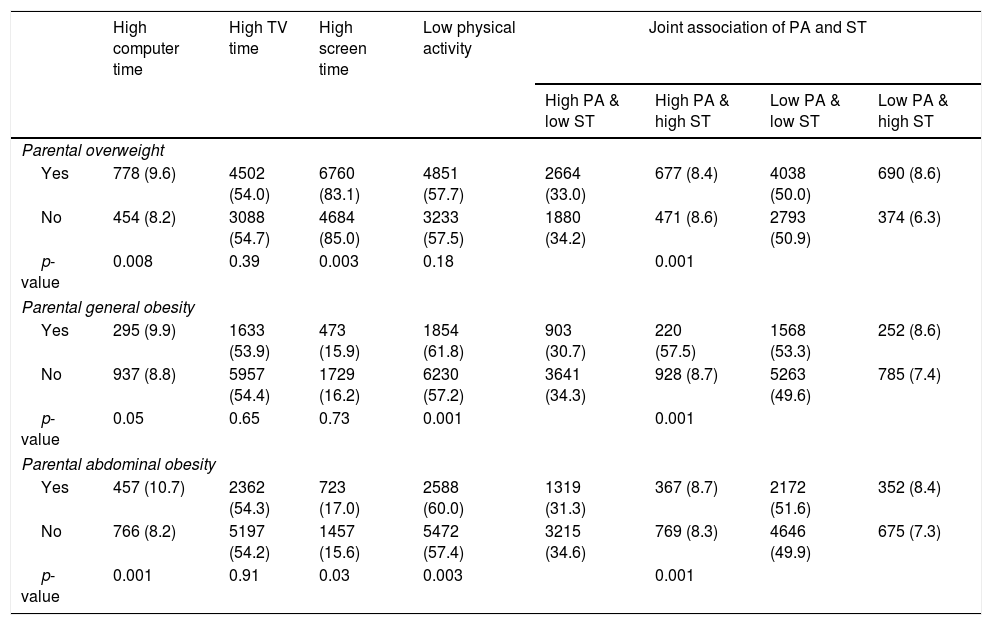
The prevalence of different categories of children's PA and ST according to parental weight status is shown in Table 3. The prevalence of students with high computer time and a combination of low PA/high ST was significantly higher in the parents with overweight, general obesity, and abdominal obesity. The prevalence of students with high ST was significantly higher in the parents with overweight and abdominal obesity. The prevalence of students with low PA was significantly higher in the parents with general obesity and abdominal obesity (p<0.001 and p<0.005, respectively).
Prevalence of different categories of children's physical activity and screen time according to parental weight status.
| High computer time | High TV time | High screen time | Low physical activity | Joint association of PA and ST | ||||
|---|---|---|---|---|---|---|---|---|
| High PA & low ST | High PA & high ST | Low PA & low ST | Low PA & high ST | |||||
| Parental overweight | ||||||||
| Yes | 778 (9.6) | 4502 (54.0) | 6760 (83.1) | 4851 (57.7) | 2664 (33.0) | 677 (8.4) | 4038 (50.0) | 690 (8.6) |
| No | 454 (8.2) | 3088 (54.7) | 4684 (85.0) | 3233 (57.5) | 1880 (34.2) | 471 (8.6) | 2793 (50.9) | 374 (6.3) |
| p-value | 0.008 | 0.39 | 0.003 | 0.18 | 0.001 | |||
| Parental general obesity | ||||||||
| Yes | 295 (9.9) | 1633 (53.9) | 473 (15.9) | 1854 (61.8) | 903 (30.7) | 220 (57.5) | 1568 (53.3) | 252 (8.6) |
| No | 937 (8.8) | 5957 (54.4) | 1729 (16.2) | 6230 (57.2) | 3641 (34.3) | 928 (8.7) | 5263 (49.6) | 785 (7.4) |
| p-value | 0.05 | 0.65 | 0.73 | 0.001 | 0.001 | |||
| Parental abdominal obesity | ||||||||
| Yes | 457 (10.7) | 2362 (54.3) | 723 (17.0) | 2588 (60.0) | 1319 (31.3) | 367 (8.7) | 2172 (51.6) | 352 (8.4) |
| No | 766 (8.2) | 5197 (54.2) | 1457 (15.6) | 5472 (57.4) | 3215 (34.6) | 769 (8.3) | 4646 (49.9) | 675 (7.3) |
| p-value | 0.001 | 0.91 | 0.03 | 0.003 | 0.001 | |||
Data are expressed as number (%).
ST, screen time; PA, physical activity.
High computer time: ≥2h/day; high TV time: ≥2h/day; high ST: ≥2h/day; low PA: 0–2 days/week. Parental overweight: BMI ≥25kg/m2; parental general obesity: BMI ≥30kg/m2; parental abdominal obesity: waist circumference ≥95cm.
p-value <0.05 was considered statistically significant.
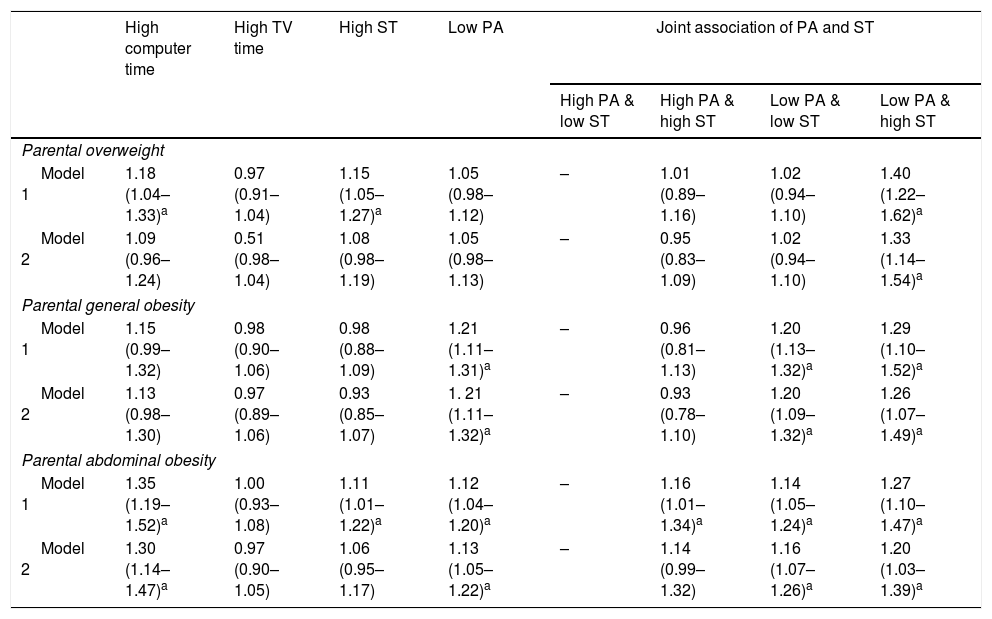
Table 4 presents the odds ratios and 95% confidence intervals of children's computer time, TV time, ST, PA, and joint associations of ST and PA categories associated with parental weight status, using two logistic regression models. Parental overweight was significantly associated with high computer time and high ST in children (OR: 1.18, 95% CI: 1.04–1.33 and OR: 1.17, 95% CI: 1.05–1.27, respectively). These associations became non-significant after adjustment for age, gender, region, and SES. Parental general obesity increased the odds of children's low PA, by 21% in both models. Parental abdominal obesity was significantly associated with children's high computer time and low PA (OR: 1.35, 95% CI: 1.19–1.52 and OR: 1.30, 95% CI: 1.14–1.47, respectively) and also remained significant after adjustment for age, gender, region, and SES (OR: 1.12, 95% CI: 1.04–1.20 and OR: 1.13, 95% CI: 1.05–1.22, respectively). Parental over weight, general obesity, and abdominal obesity increased the odds of the combination of low PA/high ST in children by 40%, 29%, and 27%, respectively, which declined to 33%, 26%, and 20% after adjustment for age, gender, region, and SES.
Odds ratios and 95% confidence intervals of children's computer time, TV time, screen time, physical activity, and joint associations of ST and PA categories associated with parental weight status.
| High computer time | High TV time | High ST | Low PA | Joint association of PA and ST | ||||
|---|---|---|---|---|---|---|---|---|
| High PA & low ST | High PA & high ST | Low PA & low ST | Low PA & high ST | |||||
| Parental overweight | ||||||||
| Model 1 | 1.18 (1.04–1.33)a | 0.97 (0.91–1.04) | 1.15 (1.05–1.27)a | 1.05 (0.98–1.12) | – | 1.01 (0.89–1.16) | 1.02 (0.94–1.10) | 1.40 (1.22–1.62)a |
| Model 2 | 1.09 (0.96–1.24) | 0.51 (0.98–1.04) | 1.08 (0.98–1.19) | 1.05 (0.98–1.13) | – | 0.95 (0.83–1.09) | 1.02 (0.94–1.10) | 1.33 (1.14–1.54)a |
| Parental general obesity | ||||||||
| Model 1 | 1.15 (0.99–1.32) | 0.98 (0.90–1.06) | 0.98 (0.88–1.09) | 1.21 (1.11–1.31)a | – | 0.96 (0.81–1.13) | 1.20 (1.13–1.32)a | 1.29 (1.10–1.52)a |
| Model 2 | 1.13 (0.98–1.30) | 0.97 (0.89–1.06) | 0.93 (0.85–1.07) | 1. 21 (1.11–1.32)a | – | 0.93 (0.78–1.10) | 1.20 (1.09–1.32)a | 1.26 (1.07–1.49)a |
| Parental abdominal obesity | ||||||||
| Model 1 | 1.35 (1.19–1.52)a | 1.00 (0.93–1.08) | 1.11 (1.01–1.22)a | 1.12 (1.04–1.20)a | – | 1.16 (1.01–1.34)a | 1.14 (1.05–1.24)a | 1.27 (1.10–1.47)a |
| Model 2 | 1.30 (1.14–1.47)a | 0.97 (0.90–1.05) | 1.06 (0.95–1.17) | 1.13 (1.05–1.22)a | – | 1.14 (0.99–1.32) | 1.16 (1.07–1.26)a | 1.20 (1.03–1.39)a |
Data are expressed as OR (95% CI).
ST, screen time; PA, physical activity; high computer time: ≥2h/day; high TV time: ≥2h/day; high ST: ≥2h/day; low PA: 0–2days/week. Parental overweight: BMI ≥25kg/m2; parental general obesity: BMI ≥30kg/m2; parental abdominal obesity: waist circumference ≥95cm.
Model 1 is a crude model; Model 2 is adjusted for age, gender, region, socio-economic status, and body mass index.
The current study indicated that parental obesity was associated with increased sedentary behaviors and low PA in children. It was also revealed that low PA and high ST were more common in older students; the mean weight, height, and BMI were significantly higher in students with prolonged ST compared with those with shorter ST. These findings are consistent with some previous studies. A study conducted on 766 European children, aged 10–12 years, found that those involved in more moderate to vigorous PA and with lower ST had a more favorable weight status than their counterparts.18 It is also indicated that when children become older, they are usually more prone to sedentary behaviors and show more interest in screen-based activities, such as computer games or watching TV.19
One of the most important factors in child obesity is parental obesity.7 A cross-sectional study in Korea revealed that in 2- to 12-year-old children with obese parents, the risk of obesity increased more than fourfold.20 In addition to the influence of genetic predisposition to obesity,21 environmental and behavioral factors play an important role in the recent rapid rise of childhood obesity.22 Parents have a major role in changing their children's obesogenic lifestyle; children's health behaviors, including their physical activity, eating habits, and TV watching or other sedentary behaviors are highly influenced by their parents.6 Adoption and twin studies have indicated that although genes are a major factor in early expression of obesity risk, but children from obese parents had a higher preference for sedentary activities, and spent more time in sedentary entertainments compared to their counterparts. A study on 428 children from a population sample of families with twin births demonstrated that the children from the obese parents had more frequent unhealthy eating habits, as well as higher preferences for sedentary activities, and spent more time in sedentary pastimes.10
Studies have suggested that joint effect of PA/ST should be evaluated for obesity and have emphasized the importance of decreasing ST along with increasing PA for reducing the risk of obesity and related complications. This is suggested because the negative effect of high ST on obesity may disappear without considering PA.23 Therefore, in the current study, all possible mixed conditions were assessed for the joint associations of PA and ST, which showed that parental obesity was strongly associated with increased odds of low PA/high ST and, after that, with low PA/low ST, while no association was observed between parental obesity with high PA/high ST. These finding can be justified by the fact that parental obesity is due to an obesogenic lifestyle, including unhealthy food patterns, lower levels of PA, and prolonged TV watching,24 which, in turn, would be used as a role model for sedentary habits in their children.25 Moreover, parents’ encouragement represents a motivational support which can increase children's capability and behavioral intentions and result in increased PA. Moreover, parents’ participation in PA is a conditional support, which not only helps children to become fitter, but also can lead to increased interest PA.26 Furthermore, it has been shown that ST is increased in children whose the parents spend more time watching TV, whereas parents can reduce the amount screen-based activities by involving their children in PA.27
The present findings propose that although the genetic characteristics transmitted from parents can lead to sedentary lifestyle in their children, the lifestyle habits of obese parents also play a major role in children's behaviors. Children and their parents live in similar environments and experience similar lifestyles that are mainly determined by parents.28 All environmental conditions which lead to decreased PA increased sedentary behaviors and consequently obesity in parents, may have direct consequences on the lifestyle of children.29 Parents should consider that they are the role model for their children in choosing lifestyle habits.
The current study was a novel survey on the data of a large national representative sample of Iranian children and adolescents, which for the first time evaluated the association of parental weight status as an independent factor with children's PA and ST. However, it had some limitations; first, because of the cross-sectional nature of study no causality can be indicated between the parental obesity and PA/ST in children. Besides, children's lifestyle is influenced by both parents’ behaviors, but data was collected from only one of the parents (in most cases their mothers), which may affect the results of this study. In this study, only one of the parents was assessed as the representative. Therefore, future studies should explore the role of all family members on the lifestyle of children. Moreover, data about PA/ST were self-reported, which is subject to recall bias. Studies have shown that individuals tended to over report their amount of physical activity in self-report surveys compared to an objective monitoring device.30 Moreover, some potential confounding factors such as parental support or sedentary behaviors were not assessed in this survey. The authors suggest future prospective studies that consider a range of items for each category of parental support, as well as other aspects of their lifestyle in relation to PA/ST in children.
The results of this study indicated that parental overweight and general or abdominal obesity can increase sedentary behaviors and low PA in children, which in turn may lead to higher risk of child obesity. Therefore, to prevent sedentary lifestyle and related complications in children, it is necessary to focus on parents’ lifestyle behaviors and weight status.
FundingIsfahan University of Medical Sciences and other relevant national regulatory organizations (Project number: 194049).
Conflicts of interestThe authors declare no conflicts of interest.
The authors would like to acknowledge of the Ministry of Health and Medical Education, the Ministry of Education and Training, the Isfahan University of Medical Sciences, and the Endocrinology and Metabolism Research Institute of Tehran University of Medical Sciences, as well as all those who participated in this study.
Please cite this article as: Angoorani P, Heshmat R, Ejtahed H-S, Motlagh ME, Ziaodini H, Taheri M, et al. The association of parental obesity with physical activity and sedentary behaviors of their children: the CASPIAN-V study. J Pediatr (Rio J). 2018;94:410–8.
Study conducted at Ministry of Health and Medical Education, Ministry of Education and Training, Isfahan University of Medical Sciences, and Endocrinology and Metabolism Research Institute of Tehran University of Medical Sciences, Tehran, Iran.


