
To compare impulse oscillometry system parameters of normal-weight children with overweight and obese children.
MethodAll participants were submitted to the evaluation of lung function (spirometry and impulse oscillometry) following the American Thoracic Society standards. The evaluation of respiratory mechanics was performed using the Jaeger™ MasterScreen™ Impulse Oscillometry System (Erich Jaeger, Germany), three tests were recorded, with acquisition for at least 20seconds.
ResultsThe study included 81 children (30 in the control group, 21 in the overweight group, and 30 the in obesity group), matched for age and sex. Regarding spirometry data, obesity group showed higher numerical values in relation to the control group; however, there were no significant differences among the three groups. For impulse oscillometry parameters, there was a difference between control group and obesity group for respiratory impedance (p=0.036), resistance at 5hertz (p=0.026), resonant frequency (p=0.029), and reactance area (p=0.014). For the parameters expressed in percentage of predicted, there were differences in resistance at 5 hertz, resonant frequency, and reactance area between control group and obesity group.
ConclusionsObese children showed increased oscillometry parameters values representative of airway obstruction, compared to normal-weight children. Changes in some oscillometry parameters can already be observed in overweight school-aged children.
Comparar parâmetros do Sistema de Oscilometria de Impulso de crianças com peso normal com crianças com sobrepeso e obesas.
MétodoTodos os participantes foram submetidos à avaliação de mecanismos respiratórios utilizando o Sistema de Oscilometria de Impulso Jaeger™ (MasterScreen™ IOS,Erich Jaeger, Alemanha) seguindo as normas da Sociedade Torácica Americana. Todos os participantes foram submetidos a testes de espirometria e oscilometria (três testes foram registrados, com coleta de dados por pelo menos 20 segundos).
ResultadosO estudo incluiu 81 crianças (30 no grupo de controle, 21 no grupo sobrepeso e 30 no grupo obesidade), pareadas por idade e sexo. No que diz respeito a dados de espirometria, o grupo obesidade mostrou valores numéricos mais elevados; contudo, não houve diferenças significativas entre os três grupos. No que diz respeito a parâmetros do Sistema de Oscilometria de Impulso, houve diferença entre o grupo de controle e o grupo obesidade em Z5 (p=0,036), resistência 5 hertz (p=0,026), frequência de ressonância (p=0,029) e área de reatância (p=0,014). Nos parâmetros expressos em percentual previsto, houve diferenças em resistência 5 hertz, frequência de ressonância e área de reatância entre o grupo de controle e grupo obesidade.
ConclusõesCrianças obesas mostraram parâmetros de oscilometria aumentados representativos de obstrução das vias aéreas em comparação a crianças com peso normal. As alterações em alguns parâmetros oscilométricos já podem ser observadas em crianças com sobrepeso em idade escolar.
The rapid increase of prevalence of obesity in children has lead to the current global epidemic.1 In Brazil, the prevalence of obesity among children and adolescents increased from 3.2% in 1989 to 14.2% in 2008, according to the Ministry of Health and the Brazilian Institute of Geography and Statistics. In the population aged 2–19 years, the rate of obesity reaches 15.4% in the Southeast, 4.3% in the Northeast, 5.3% in the Midwest, 10.4% in the South, demonstrating the high prevalence of obesity in Brazilian children and adolescents.2
It is well established that obesity causes metabolic changes, such as dyslipidemia, hypertension, and glucose intolerance, and is also considered a risk factor for diabetes mellitus type 2 and cardiovascular and respiratory diseases, including asthma.3,4 This evidence has been more commonly reported in the adult population. Therefore, high prevalence of obesity justifies the investigation of respiratory function in children and adolescents.5,6 Almost all studies use spirometry as a tool for this assessement.7–9
The effects of obesity on the respiratory system are numerous. Lower complacency with consequent increased respiratory effort, derived from abdominal fat and thoracic accumulation, are often observed.10 This accumulation also changes the balance of power between the chest/abdominal wall and lungs, resulting in decreased functional residual capacity (FRC).11,12 Such factors can act on the reduction of the diameter of the peripheral airways, as well as on the increase of respiratory system resistance in obese individuals. Furthermore, increasing circulating levels of leptin are associated with reduced airway caliber and predisposition to increased bronchial hyperresponsiveness, which justifies the assessment relevance and specific follow-up on central and peripheral airways of these individuals.6,13
Monitoring the behavior of central and peripheral airways in this population is quite important; however, it is difficult to assess more distal airways through traditional tests, such as spirometry, which can assess normality of forced expiratory volume in one second (FEV1) and vital capacity (VC), due to their large cross-sectional area and minimum contribution to the total airways resistance.14–16
An impulse oscillometry system (IOS) is a tool used for more detailed evaluation. This is a non-invasive and effort-independent method to measure mechanical respiratory parameters.14,17 The application of pressure pulses at multiple frequencies allows the measurement of impedance (Z), resonant frequency (Fres), resistance (R), and reactance (X) and reactance area (AX) of the respiratory system, in available frequency variations.15,18 It involves rapid and reproducible measurements,19 allowing more sensitive identification of dysfunctions in the distal airways in cases of overweight and obesity.
In this context, the aim of this study was to compare the IOS parameters of normal-weight children with overweight and obese children.
MethodsThis was a cross-sectional, analytical, and comparative study with normal-weight, overweight and obese children, aged between 6 and 14, attending educational institutions in Florianópolis (Santa Catarina/Brazil). Data collection was conducted at public and private schools from October 2012 to May 2014. This study was approved by the Research Ethics Committee of the State University of Santa Catarina (UDESC) under protocol number 97/2011.
The parents or guardians were informed of the objectives, procedures, risks, and benefits of the study, agreed upon participation, and signed an informed consent (IC). They also answered the International Study of Asthma and Allergies in Childhood (ISAAC) questionnaire, validated for Brazilian Portuguese.20
The participants were selected according to the guidelines of the American Thoracic Society (ATS) and the European Respiratory Society (ERS),21 in which the participants showed no episodes of wheezing, history of premature birth, respiratory diseases, respiratory tract infection in the last two weeks of evaluation, muscle disorders, exposure to passive smoking, neurological disorders, asthma, and/or allergic rhinitis (assessed according to the – ISAAC score). School-aged children between 6 and 9 years and 10 and 14 years who showed ISAAC scores for asthma higher or equal to 5 and 6, respectively, and scores higher or equal to 4 and 3, respectively, for the diagnosis of rinitis,22,23 were excluded. Individuals who had any visual, hearing, or cognitive disturbance, who were not cooperative, or who showed poor understanding of the steps of the proposed procedures were excluded from the final sample.
All participants showed spirometry data in compliance with the normality parameters: FEV1 and FVC ≥80% of predicted, with FEV1/FVC ≥0.8 of predicted,24 according to the criteria of acceptability and reproducibility of the American Thoracic Society (2005).25
For the biometric assessment, weight and height were measured with an Ultra Slim W903-Wiso® digital scale (Wiso®, SC, Brazil) and a portable Sanny® stadiometer (Sanny®, SP, Brazil), respectively. Based on this information, body mass index (BMI) could be obtained with the formula weight/height.2 For the BMI classification, percentile data were considered according to the World Health Organization (WHO).26 The following groups were constructed:
- -
Control Group (CG) – individuals within the ≥3rd and <85th percentile range were classified as normal-weight.
- -
Overweight Group (OWG) – individuals within the ≥85th and <97th percentile range were classified as overweight.
- -
Obesity Group (OG) – individuals in the ≥97th percentile range were classified as obese.
Next, respiratory mechanics analysis was conducted using IOS, according to the guidelines of the ATS,21 with a data acquisition time between 20 and 30s. Three measures were carried out and the best value of three valid attempts was selected for further analysis. A maximum of 10% variation between measurements was allowed for each of the parameters. The oscillometry parameters evaluated included: respiratory impedance (Z5); total resistance (R5) and central airways (R20); reactance to 5Hz (X5); reactance area (AX); and Fres. For data analysis, the percentage of predicted values was calculated, according to the reference values for Brazilian children proposed by Assumpção et al.27
Spirometry tests were also performed with the Jaeger™ MasterScreen™ IOS (Erich Jaeger, Germany), calibrated prior to each testing. Spirometry tests were performed after the oscillometric measurements, according to the ATS/ERS guidelines.25 The data related to environmental conditions were reported and monitored by a thermo-hygrometer (Incoterm®, SP, Brazil), with relative humidity maintained between 40% and 50%, and temperature not below 17°C or above 40°C.
The data was analyzed using the Statistical Package for the Social Sciences® (SPSS) software version 20.0 and presented by descriptive statistics expressed as mean and standard deviation for the data with normal distribution, and as median and interquartile range for the data with non-normal distribution, according to distribution of the data recorded by the Shapiro–Wilk test.
Degree of homogeneity among the studied groups was verified with the chi-Squared test for nominal variables and with one-way ANOVA and the Kruskal–Wallis test for continuous variables. To compare the oscillometric data and spirometry parameters among the groups, one-way ANOVA (post hoc Bonferroni) for parametric data was used, or the Kruskal–Wallis test for nonparametric data. If significant differences were shown in the Kruskal–Wallis test, a multiple comparison test was applied. The significance level was set at p<0.05.
Sample size was calculated based on data from a pilot study with ten obese and ten normal-weight children aged between 6 and 13 years. The Z5 variable was considered, due to its importance for the total mechanical load of the respiratory system. The data showed a standard deviation 0.09kPa/L/s with a minimum difference of 0.008kPa/L/s to be detected. For the estimates, the significance level was set at 5%, with power of 80%, and a total of 20 individuals were considered as sufficient to compose each group.
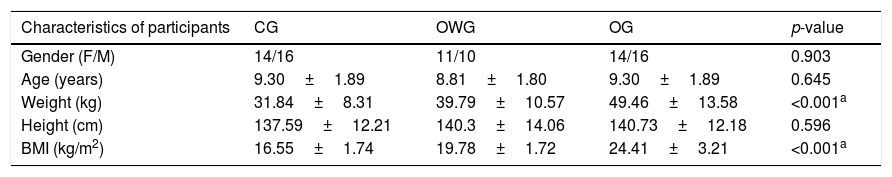
ResultsA total of 81 children took part in the study: 30 in the CG, 21 in the OWG, and 30 in the OG, all matched for age and sex. Biometric measurements of weight, height, and BMI of each group are displayed in Table 1.
Description and comparison of anthropometric data, sex, and age of each of the three groups.
| Characteristics of participants | CG | OWG | OG | p-value |
|---|---|---|---|---|
| Gender (F/M) | 14/16 | 11/10 | 14/16 | 0.903 |
| Age (years) | 9.30±1.89 | 8.81±1.80 | 9.30±1.89 | 0.645 |
| Weight (kg) | 31.84±8.31 | 39.79±10.57 | 49.46±13.58 | <0.001a |
| Height (cm) | 137.59±12.21 | 140.3±14.06 | 140.73±12.18 | 0.596 |
| BMI (kg/m2) | 16.55±1.74 | 19.78±1.72 | 24.41±3.21 | <0.001a |
F, female; M, male; CG, control group; OWG, overweight group; OG, obesity group; BMI, body max index.
OG showed higher numerical values of spirometric data, with no significant difference among the three groups. All values were within the normal range (Table 2).
Description and comparison spirometric variables according to the three groups. The data with normal distribution were expressed as mean and standard deviation, and those with non-normal distribution in median and interquartile ranges.
| Spirometric variables | CG (n=30) | OWG (n=21) | OG (n=30) | p-value |
|---|---|---|---|---|
| FEV1 (L) | 1.97±0.43 | 2.16±0.61 | 2.12±0.48 | 0.362 |
| FEV1 (%) | 95.2 (89.2–100.7) | 99.8 (90.1–107.0) | 95.2 (89.2–100.7) | 0.754 |
| FVC (L) | 2.23±0.54 | 2.44±0.72 | 2.40±0.63 | 0.432 |
| FVC (%) | 99.54±9.36 | 102.55±10.75 | 100.13±12.41 | 0.607 |
| PEF (L) | 4.37±1.10 | 4.54±1.17 | 4.40±1.22 | 0.462 |
| PEF (%) | 86.4 (76.8–101.7) | 91.7 (82.8–101.2) | 86.4 (76.8–101.7) | 0.838 |
| FEF25–75(L/s) | 2.37±0.67 | 2.59±0.75 | 2.44±0.59 | 0.663 |
| FEF25–75 (%) | 91.85±21.39 | 95.25±18.88 | 90.45±15.62 | 0.606 |
| FEV1/FVC | 0.88±0.05 | 0.88±0.05 | 0.88±0.05 | 0.995 |
CG, control group; OWG, overweight group; OG, obesity group; %, percentage of predicted; L, liter; FVC, forced vital capacity; FEV1, forced expiratory volume in 1s; PEF, peak expiratory flow; FEF 25-75%, forced expiratory flow at 25–75% of FVC; FEV1/FVC, ratio of FEV1 and FVC.
Value p<0.05 according to one-way ANOVA or the Kruskal–Wallis test.
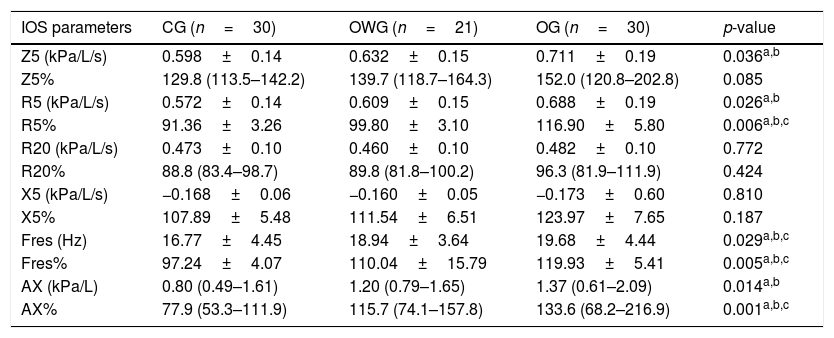
For IOS parameters, there were differences between CG and OG for Z5, R5, Fres, and AX. For the parameters expressed in percentage of predicted,27 there were differences in R5%, Fres%, and AX% between the CG and OG (Table 3).
Description and comparison of data from IOS parameters according to the groups. Data with normal distribution were expressed as mean and standard deviation, and those with non-normal distribution in median and interquartile ranges.
| IOS parameters | CG (n=30) | OWG (n=21) | OG (n=30) | p-value |
|---|---|---|---|---|
| Z5 (kPa/L/s) | 0.598±0.14 | 0.632±0.15 | 0.711±0.19 | 0.036a,b |
| Z5% | 129.8 (113.5–142.2) | 139.7 (118.7–164.3) | 152.0 (120.8–202.8) | 0.085 |
| R5 (kPa/L/s) | 0.572±0.14 | 0.609±0.15 | 0.688±0.19 | 0.026a,b |
| R5% | 91.36±3.26 | 99.80±3.10 | 116.90±5.80 | 0.006a,b,c |
| R20 (kPa/L/s) | 0.473±0.10 | 0.460±0.10 | 0.482±0.10 | 0.772 |
| R20% | 88.8 (83.4–98.7) | 89.8 (81.8–100.2) | 96.3 (81.9–111.9) | 0.424 |
| X5 (kPa/L/s) | −0.168±0.06 | −0.160±0.05 | −0.173±0.60 | 0.810 |
| X5% | 107.89±5.48 | 111.54±6.51 | 123.97±7.65 | 0.187 |
| Fres (Hz) | 16.77±4.45 | 18.94±3.64 | 19.68±4.44 | 0.029a,b,c |
| Fres% | 97.24±4.07 | 110.04±15.79 | 119.93±5.41 | 0.005a,b,c |
| AX (kPa/L) | 0.80 (0.49–1.61) | 1.20 (0.79–1.65) | 1.37 (0.61–2.09) | 0.014a,b |
| AX% | 77.9 (53.3–111.9) | 115.7 (74.1–157.8) | 133.6 (68.2–216.9) | 0.001a,b,c |
IOS, impulse oscillometry system; CG, control group; OWG, overweight group; OG, obesity group; R5, resistance at 5Hz; R20, resistance at 20Hz; X5, reactance at 5Hz; Z5, impedance at 5Hz (all expressed in kPa/L/s); Fres, resonant frequency (expressed in Hz); AX, reactance area expressed in kPa/L); %, percentage in relation to the reference values proposed by Assumpção et al. (2016).
There are few studies in the literature6,13,14,28 which assess the impact of obesity according to IOS parameters. This study shows evidence that changes in respiratory function in overweight and obese children can be identified through this equipment.
Particular to this type of assessment is the possibility to verify increased peripheral resistance by means of IOS in this population, even when forced expiratory volume in one second (FEV1) is within the normal range for forced vital capacity (FVC). This suggests that disorders of the more distal airways and the presence of obstruction can be best identified by means of IOS,11 as seen in this study.
Van de Kant et al.28 analyzed the relationship between BMI and airways, more specifically, the peripheral airway function and the presence of inflammation in overweight and obese adults (BMI≥30) who showed normal spirometry results. Corroborating the finding of this study, the authors observed that measurements of airway resistance – in the frequencies of 5 and 20Hz, Fres, and AX – were higher in overweight and obese adult individuals when compared with adults with normal BMI.28 The authors also concluded that overweight has significant effects on respiratory function, as determined by IOS, which sometimes is not detected by spirometry. These findings indicate that IOS is a sensitive tool to assess the lung mechanics of overweight individuals.28
One of the only studies with children about the relationship of body mass (overweight and obese) with oscillometry parameters was conducted by Kalhoff et al.14 However, unlike the results indicated here, the authors observed no changes in IOS parameters with increasing BMI.6 The obese group assessed in this study showed higher levels of R5, indicating that this increase affected both small and large caliber airways. Furthermore, Fres and AX also showed changes, which suggest the presence of airway obstruction.
Albuquerque et al.13 studied 85 adults and divided them into four groups (controls, obese, severely obese, and morbidly obese). They reported that individuals with severe obesity and morbid obesity showed higher total and peripheral resistance, as well as more negative reactance values. Although not significant, this current study found that these parameters in obese patients also showed changes. Unlike Albuquerque et al.,13 there were no significant variations in X5, possibly due the fact that the aforementioned study evaluated individuals with more severe obesity.
A significant association of obesity and the respiratory system is the frequent presence of asthma symptoms, requiring treatment due to reduced pulmonary function. Lauhkonen et al.6 assessed the associations among weight, lung function, and bronchial reactivity by means of IOS, and observed that seven obese children had higher post-bronchodilator impedance in the airways and higher R5 values compared to normal-weight children. The study included 99 children with an average age of 6.3 years, hospitalized because of bronchiolitis, and the findings suggested irreversible structural changes in the airways of obese children. The results showed that obesity may be associated with airway obstruction6 and induces a series of biophysical effects in the lungs, such as reduced volumes, increasing small airway resistance and peak expiratory flow variability. These factors are very favorable for the development or exacerbation of asthma.29,30
Although spirometry increasingly suggests an association between obesity and impaired lung function, there are only a few reports about the impact of overweight on respiratory mechanics. The results of this study showed that this type of investigation with overweight and obese school-aged children and with normal spirometry should include the measurement of oscillometry parameters.
In the present study, the FEV1 values show that the three groups analyzed are within the normal range, and the lower predicted percentage values do not represent pulmonary disease by spirometry. This numerical and non-significant difference between the groups, especially in relation to the overweight group, is probably due to a better execution/performance of the forced maneuver and the greater values of stature in this group. No relationships between age and FEV1 values were found.
In general, overweight and obese children showed changes in all parameters evaluated by means of IOS (Z5, R5, R20, X5, Fres, AX), when compared to normal-weight children. These changes in respiratory mechanics were more evident in obese children, mainly identified in parameters related to the presence of airway obstruction (R5, Fres, and AX).
Conflicts of interestThe authors declare no conflicts of interest.
Please cite this article as: Assumpção MS, Ribeiro JD, Wamosy RM, Figueiredo FC, Parazzi PL, Schivinski CI. Impulse oscillometry and obesity in children. J Pediatr (Rio J). 2018;94:419–24.
Study conducted at Universidade Estadual de Campinas (UNICAMP), Faculdade de Ciências Médicas, Departamento de Pediatria, Campinas, SP; and Universidade do Estado de Santa Catarina (UDESC), Departamento de Fisioterapia, Centro de Ciências da Saúde e do Esporte (CEFID), Florianópolis, SC, Brazil.


