

Irritable bowel syndrome is a frequent functional gastrointestinal disorder. The aims of this study were to investigate its epidemiology, focusing on the role of intestinal mucosal integrity and to evaluate the impact on the quality of life.
MethodsA community-based survey applying a comparative cross sectional approach was conducted in six high schools in Palembang. Subjects were recruited using multistage random sampling divided in two groups. Rome III criteria were used to establish a diagnosis of IBS in combination with a questionnaire to determine risk factors. Determination of fecal alpha-1-antitrypsin and calprotectin levels was performed to determine impaired intestinal mucosal integrity. A questionnaire was used to evaluate how quality of life was affected by irritable bowel syndrome.
ResultsThe survey was performed in 454 14−18years old adolescents, of whom 30.2% fulfilled the Rome III criteria for IBS, with the following subtypes: 36.5% diarrhea, 18.9% constipation, 21.9% mixed, and 22.6% unclassified. Major risk factors were female gender, bullying, age 14–16 years, history of constipation and diarrhea, eating nuts, and drinking coffee, tea, and soft drinks. There was a significant association with intestinal inflammation (p=0.013). A significantly impaired quality of life was found (p=0.001).
ConclusionsThe prevalence of irritable bowel syndrome in adolescents was high, with bullying, female gender, age 14–16 years, constipation and diarrhea, and dietary consumption of soft drinks, coffee, and tea as risk factors. A significant association with intestinal inflammation was found.
Adolescence is a period during which various important changes happen in a child’s journey towards adulthood.1–4 Irritable bowel syndrome (IBS) is a common functional gastrointestinal disorder. It is characterized by abdominal pain that usually improves with defecation. The onset is associated with a change in stool consistency or frequency that cannot be explained by structural or biochemical abnormalities. IBS is characterized by several subtypes: diarrhea, constipation, mixed, or unclassified.5–7 The pathophysiology of IBS still remains unknown. Data from other studies found structural changes such as abnormal permeability and intestinal inflammation in IBS patients.8,9 Several case control studies reported that risk factors of IBS are related to age, gender, socio-economic status, education level, ‘Western lifestyle,’ increased personal hygiene, population overgrowth, stress, ethnicity, climate, medications, past history of dysentery, diet, sexual abuse, and other psychosocial factors.5,10–13 IBS is a major public health problem, with an important impact on health care cost, activity limitation, quality of life (QoL), and behavior disorders.14–17
The present study aimed to characterize IBS in adolescents regarding prevalence, risk factors, and subtypes, to analyze the involvement of intestinal mucosal integrity, and to determine the impact of IBS on QoL.
MethodsA community-based survey with comparative cross-sectional design was conducted in 14–18year old high school students. Subjects were recruited using multistage random sampling from six high schools from six districts in Palembang, between April and September of 2017.The study consisted of two stages: the first stage was a cross-sectional survey, and the second stage, a cross-sectional comparison. Regarding the first stage, it was estimated that this study would require 355 subjects, according to the estimated prevalence of IBS of 21% 12, with a permissible error of 5%. The first stage was intended to determine the prevalence, risk factors, and subtypes of IBS. Regarding the second part of the study, participants were randomly classified into an IBS and a non-IBS group. The number was based on a sample size calculated with a formula for comparing two populations, in order to analyze the association of IBS with gut integrity and the quality of life. This calculation resulted in the finding that 140 adolescents, divided into 70 IBS and 70 non-IBS from the first part of the study, was the number needed in order to analyze the association of IBS with gut integrity and QoL (Fig. 1).

The inclusion criteria were adolescents in presumed good health. Subjects with any chronic disease such as asthma, diabetes mellitus, or cardiac, renal, or hematological diseases were excluded. Those who had received antibiotics or antiparasitic treatments (metronidazole, tinidazole, albendazole) in the last two weeks were also excluded. All subjects who met the inclusion criteria were included in the study after obtaining the written or oral consent of a parent or guardian. Information was obtained from all participants regarding identity and presence of symptoms, allowing the presence of Rome III criteria to be determined, and symptoms related to QoL were elucidated by direct interview. The QoL assessment was performed using the IBS-QoL questionnaire to evaluate the impact of IBS. The IBS-QoL questionnaire was validated in a preliminary study in 30 adolescents, prior to this study.
All participants also underwent routine physical examination and anthropometric measurements. Nutritional status was defined according the Centers for Disease Control and Prevention (CDC) 2000 growth charts: obese if body mass index (BMI) > P95; overweight if BMI>P85; underweight if BMI for age<P5; severe underweight if BMI for age<P3.
The diagnosis of IBS was established according the Rome III criteria and was confirmed by a pediatric gastroenterologist using the same criteria. Participants were classified into an IBS and a non-IBS group, in order to analyze the association of IBS with gut integrity. Fecal ELISA DRG® was used to measure alpha-1-antitrypsin (AAT) and fecal calprotectin (CP) to determine gut integrity. Data were analyzed using SPSS v. 22.0. Normally distributed data are shown as the mean±standard deviation. Student’s t-test for independent samples, the Mann-Whitney test, Pearson’s chi-squared test, and Fisher’s exact test were used whenever appropriate. Analysis for CP and AAT levels are presented as median, with minimum and maximum range. Since the distribution of the CP and AAT levels was not normal according to Kolmogorov-Smirnov, the Mann-Whitney test was used. A p-value ≤ 0.05 was considered statistically significant (95% confidence intervals).
This research was approved by the Health Research Ethics Committee, Faculty of Medicine, University of Indonesia, under protocol No. 774/UN2.F1/ETIK/2017, of August 21st 2017.
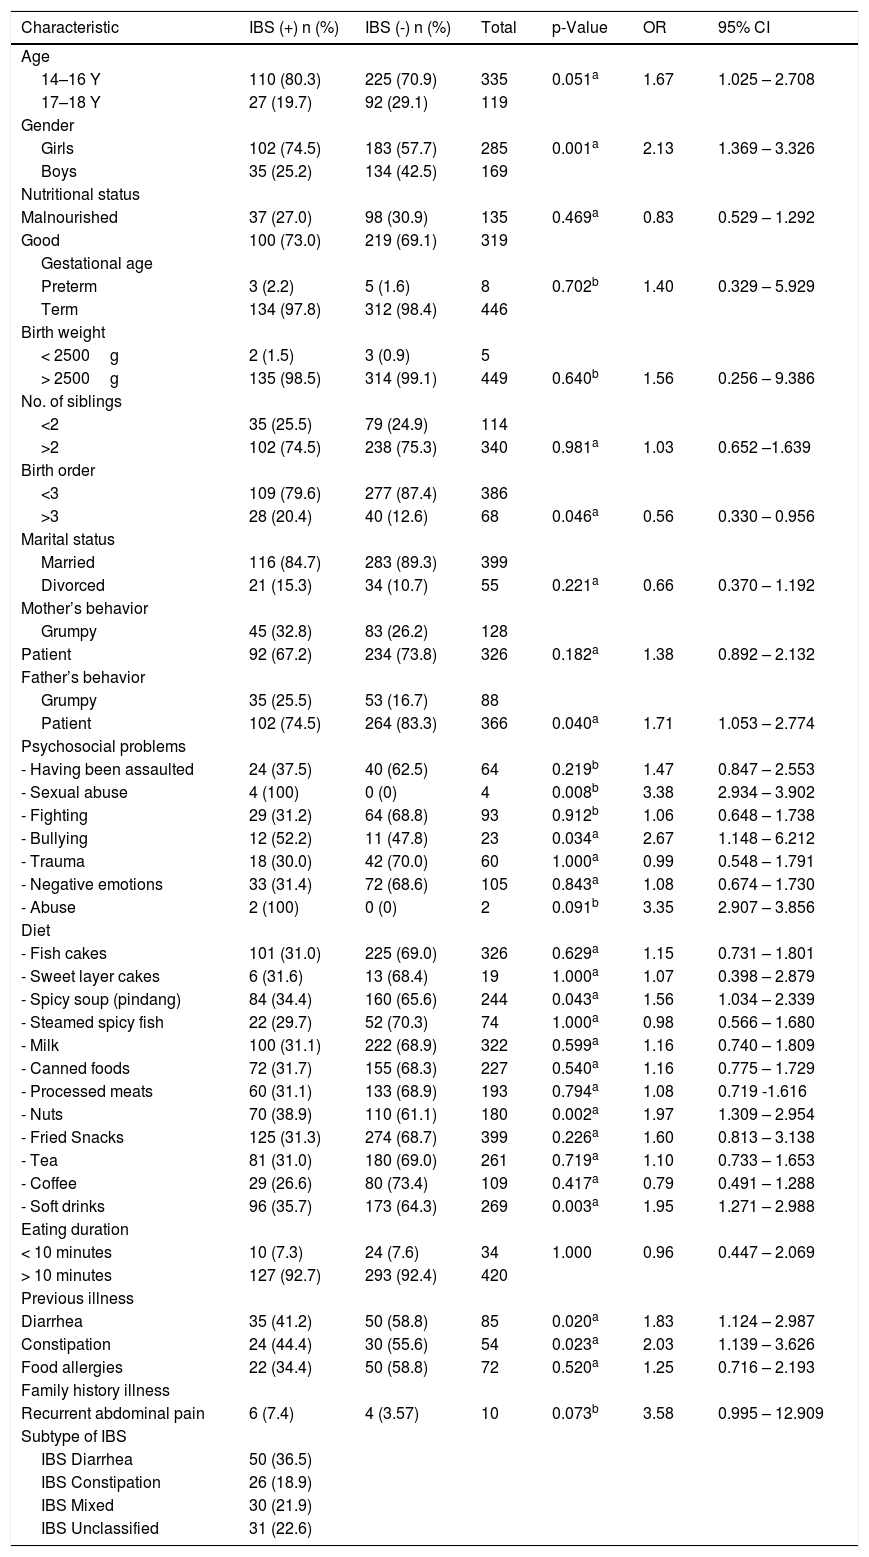
ResultsFrom April to September 2017, this study enrolled 454 high school students, representing 37.2% boys and 62.8% girls, with an average age of 15.8±0.97 years. Most students (70.3%) had good nutritional status; the rest were malnourished. IBS according to Rome III criteria was found in 137 students (30.2%), with the following distribution by subtype: diarrhea IBS (IBS-D) subtype was the most frequent, followed by unclassified IBS (IBS-U), mixed IBS (IBS-M), and constipation IBS (IBS-C), with percentages of 36.5%; 22.6%; 21.9%; 18.9%, respectively (Table 1).
Assessment of the risk factors related to irritable bowel syndrome (IBS) (n=454).
| Characteristic | IBS (+) n (%) | IBS (-) n (%) | Total | p-Value | OR | 95% CI |
|---|---|---|---|---|---|---|
| Age | ||||||
| 14–16 Y | 110 (80.3) | 225 (70.9) | 335 | 0.051a | 1.67 | 1.025 – 2.708 |
| 17–18 Y | 27 (19.7) | 92 (29.1) | 119 | |||
| Gender | ||||||
| Girls | 102 (74.5) | 183 (57.7) | 285 | 0.001a | 2.13 | 1.369 – 3.326 |
| Boys | 35 (25.2) | 134 (42.5) | 169 | |||
| Nutritional status | ||||||
| Malnourished | 37 (27.0) | 98 (30.9) | 135 | 0.469a | 0.83 | 0.529 – 1.292 |
| Good | 100 (73.0) | 219 (69.1) | 319 | |||
| Gestational age | ||||||
| Preterm | 3 (2.2) | 5 (1.6) | 8 | 0.702b | 1.40 | 0.329 – 5.929 |
| Term | 134 (97.8) | 312 (98.4) | 446 | |||
| Birth weight | ||||||
| < 2500g | 2 (1.5) | 3 (0.9) | 5 | |||
| > 2500g | 135 (98.5) | 314 (99.1) | 449 | 0.640b | 1.56 | 0.256 – 9.386 |
| No. of siblings | ||||||
| <2 | 35 (25.5) | 79 (24.9) | 114 | |||
| >2 | 102 (74.5) | 238 (75.3) | 340 | 0.981a | 1.03 | 0.652 –1.639 |
| Birth order | ||||||
| <3 | 109 (79.6) | 277 (87.4) | 386 | |||
| >3 | 28 (20.4) | 40 (12.6) | 68 | 0.046a | 0.56 | 0.330 – 0.956 |
| Marital status | ||||||
| Married | 116 (84.7) | 283 (89.3) | 399 | |||
| Divorced | 21 (15.3) | 34 (10.7) | 55 | 0.221a | 0.66 | 0.370 – 1.192 |
| Mother’s behavior | ||||||
| Grumpy | 45 (32.8) | 83 (26.2) | 128 | |||
| Patient | 92 (67.2) | 234 (73.8) | 326 | 0.182a | 1.38 | 0.892 – 2.132 |
| Father’s behavior | ||||||
| Grumpy | 35 (25.5) | 53 (16.7) | 88 | |||
| Patient | 102 (74.5) | 264 (83.3) | 366 | 0.040a | 1.71 | 1.053 – 2.774 |
| Psychosocial problems | ||||||
| - Having been assaulted | 24 (37.5) | 40 (62.5) | 64 | 0.219b | 1.47 | 0.847 – 2.553 |
| - Sexual abuse | 4 (100) | 0 (0) | 4 | 0.008b | 3.38 | 2.934 – 3.902 |
| - Fighting | 29 (31.2) | 64 (68.8) | 93 | 0.912b | 1.06 | 0.648 – 1.738 |
| - Bullying | 12 (52.2) | 11 (47.8) | 23 | 0.034a | 2.67 | 1.148 – 6.212 |
| - Trauma | 18 (30.0) | 42 (70.0) | 60 | 1.000a | 0.99 | 0.548 – 1.791 |
| - Negative emotions | 33 (31.4) | 72 (68.6) | 105 | 0.843a | 1.08 | 0.674 – 1.730 |
| - Abuse | 2 (100) | 0 (0) | 2 | 0.091b | 3.35 | 2.907 – 3.856 |
| Diet | ||||||
| - Fish cakes | 101 (31.0) | 225 (69.0) | 326 | 0.629a | 1.15 | 0.731 – 1.801 |
| - Sweet layer cakes | 6 (31.6) | 13 (68.4) | 19 | 1.000a | 1.07 | 0.398 – 2.879 |
| - Spicy soup (pindang) | 84 (34.4) | 160 (65.6) | 244 | 0.043a | 1.56 | 1.034 – 2.339 |
| - Steamed spicy fish | 22 (29.7) | 52 (70.3) | 74 | 1.000a | 0.98 | 0.566 – 1.680 |
| - Milk | 100 (31.1) | 222 (68.9) | 322 | 0.599a | 1.16 | 0.740 – 1.809 |
| - Canned foods | 72 (31.7) | 155 (68.3) | 227 | 0.540a | 1.16 | 0.775 – 1.729 |
| - Processed meats | 60 (31.1) | 133 (68.9) | 193 | 0.794a | 1.08 | 0.719 -1.616 |
| - Nuts | 70 (38.9) | 110 (61.1) | 180 | 0.002a | 1.97 | 1.309 – 2.954 |
| - Fried Snacks | 125 (31.3) | 274 (68.7) | 399 | 0.226a | 1.60 | 0.813 – 3.138 |
| - Tea | 81 (31.0) | 180 (69.0) | 261 | 0.719a | 1.10 | 0.733 – 1.653 |
| - Coffee | 29 (26.6) | 80 (73.4) | 109 | 0.417a | 0.79 | 0.491 – 1.288 |
| - Soft drinks | 96 (35.7) | 173 (64.3) | 269 | 0.003a | 1.95 | 1.271 – 2.988 |
| Eating duration | ||||||
| < 10 minutes | 10 (7.3) | 24 (7.6) | 34 | 1.000 | 0.96 | 0.447 – 2.069 |
| > 10 minutes | 127 (92.7) | 293 (92.4) | 420 | |||
| Previous illness | ||||||
| Diarrhea | 35 (41.2) | 50 (58.8) | 85 | 0.020a | 1.83 | 1.124 – 2.987 |
| Constipation | 24 (44.4) | 30 (55.6) | 54 | 0.023a | 2.03 | 1.139 – 3.626 |
| Food allergies | 22 (34.4) | 50 (58.8) | 72 | 0.520a | 1.25 | 0.716 – 2.193 |
| Family history illness | ||||||
| Recurrent abdominal pain | 6 (7.4) | 4 (3.57) | 10 | 0.073b | 3.58 | 0.995 – 12.909 |
| Subtype of IBS | ||||||
| IBS Diarrhea | 50 (36.5) | |||||
| IBS Constipation | 26 (18.9) | |||||
| IBS Mixed | 30 (21.9) | |||||
| IBS Unclassified | 31 (22.6) |
Chi-squared test (a: continuity correction, b: Fisher’s exact test).
Risk factors related to IBS were identified (Table 1), including female gender (p=0.001, OR 2.13, 95 % CI 1.369–3.326), grumpy father (p=0.040, OR 1.71, 95 % CI 1.053–2.774), sexual abuse (p=0.008, OR 3.38, 95 % CI 2.934–3.902), bullying (p=0.034, OR 2.67, 95 % CI 1.148–6.212), eating spicy soup (p=0.043, OR 1.56, 95 % CI 1.034–2.339), eating nuts (p=0.002, OR 1.97, 95 % CI 1.309–2.954), consumption of soft drinks (p=0.003, OR 1.95, 95 % CI 1.271–2.988), and history of diarrhea (p=0.020, OR 1.83, 95 % CI 1.124–2.987) and constipation (p=0.023, OR 2.03, 95 % CI 1.139–3.626).
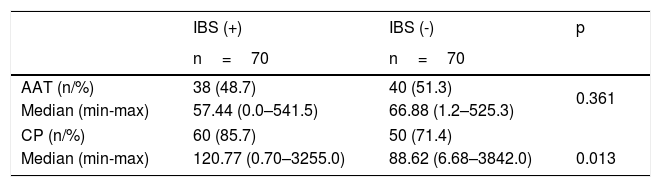
Association between IBS and gut integrityAccording to sample size calculation, 70 patients were needed in each group. Gut integrity was estimated by measuring intestinal permeability and inflammation using stool assays. Intestinal permeability was represented by fecal AAT concentration and inflammation by fecal CP. The cut-off point for AAT was > 43.7mg/dL and for CP it was > 50mg/kg.
The study results showed that fecal AAT levels were not normally distributed; data are shown as median (min-max). AAT concentration in the IBS group was decreased compared with the non-IBS group (57.44 [0.0–541.50] vs. 66.88 [1.24–525.30]), but there was no significant relationship between fecal AAT and IBS (p=0.361). However, fecal CP was increased in the IBS group (120.77 [0.70–3,255.0] vs. 88.62 [6.88–3,842.5]) and there was a significant relationship between fecal CP and IBS (p=0.013; Table 2).
Association of gut integrity with irritable bowel syndrome (IBS; n=140).
| IBS (+) | IBS (-) | p | |
|---|---|---|---|
| n=70 | n=70 | ||
| AAT (n/%) | 38 (48.7) | 40 (51.3) | 0.361 |
| Median (min-max) | 57.44 (0.0–541.5) | 66.88 (1.2–525.3) | |
| CP (n/%) | 60 (85.7) | 50 (71.4) | |
| Median (min-max) | 120.77 (0.70–3255.0) | 88.62 (6.68–3842.0) | 0.013 |
AAT, alpha-1-antitripsin; CP, calprotectin; statistics: Mann-Whitney test.
The IBS-Quality of Life questionnaire (IBS-QoL) was developed by Patrick et al.16 This study had shown that, after a standard translation and linguistic validation and reliability questionnaire IBS linguistic validation method, the Indonesian IBS-QoL can be administered in other populations with appropriate reliability and validity.
Permission was obtained from the original questionnaire developer and the MAPI Research Trust (Lyon, France) to develop this study.16 The present authors followed the recommended process of the MAPI Research Trust, as well as the principles ordered by the translation standard forward-backward translation was done; two health professionals did the forward translation independently and backward translation was done by two professional translators separately as well.
The Indonesian IBS-QoL was validated by 30 subjects with a simple random method.17 Reliability analyses demonstrated high internal consistency and reproducibility of the Indonesian IBS-QoL for the overall score, as well as for subscale scores, comparable to the original study (Cronbach’s alpha=0.95, ICC=0.88).
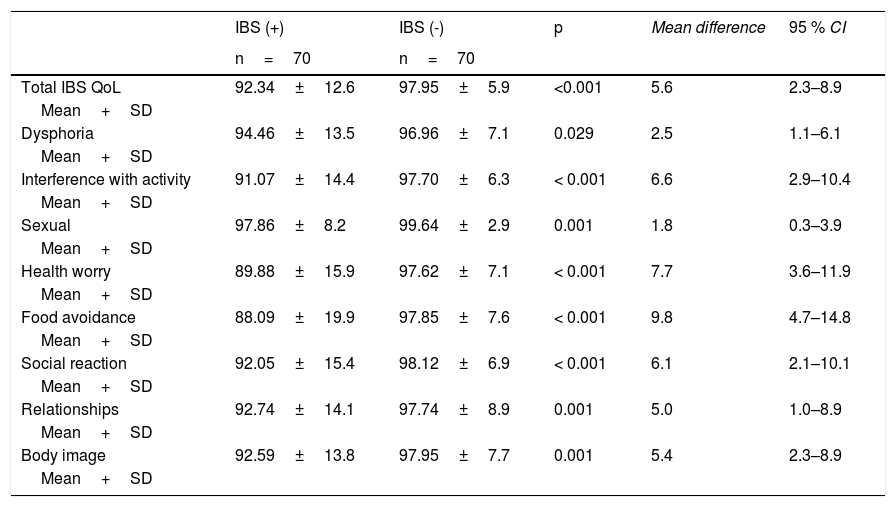
The QoL of subjects in IBS group was lower than the non-IBS group. IBS-QoL among the IBS group showed lower QoL than the non-IBS group (n=140). The negative impact of IBS on QoL was shown in this study. There was a significant relationship with low quality of life (p=0.001; mean difference=5.8; 95% CI=2.816–12.083; Table 3).
Association of irritable bowel syndrome (IBS) with quality of life (QoL).
| IBS (+) | IBS (-) | p | Mean difference | 95 % CI | |
|---|---|---|---|---|---|
| n=70 | n=70 | ||||
| Total IBS QoL | 92.34±12.6 | 97.95±5.9 | <0.001 | 5.6 | 2.3–8.9 |
| Mean+SD | |||||
| Dysphoria | 94.46±13.5 | 96.96±7.1 | 0.029 | 2.5 | 1.1–6.1 |
| Mean+SD | |||||
| Interference with activity | 91.07±14.4 | 97.70±6.3 | < 0.001 | 6.6 | 2.9–10.4 |
| Mean+SD | |||||
| Sexual | 97.86±8.2 | 99.64±2.9 | 0.001 | 1.8 | 0.3–3.9 |
| Mean+SD | |||||
| Health worry | 89.88±15.9 | 97.62±7.1 | < 0.001 | 7.7 | 3.6–11.9 |
| Mean+SD | |||||
| Food avoidance | 88.09±19.9 | 97.85±7.6 | < 0.001 | 9.8 | 4.7–14.8 |
| Mean+SD | |||||
| Social reaction | 92.05±15.4 | 98.12±6.9 | < 0.001 | 6.1 | 2.1–10.1 |
| Mean+SD | |||||
| Relationships | 92.74±14.1 | 97.74±8.9 | 0.001 | 5.0 | 1.0–8.9 |
| Mean+SD | |||||
| Body image | 92.59±13.8 | 97.95±7.7 | 0.001 | 5.4 | 2.3–8.9 |
| Mean+SD |
Student’s t-test, unpaired.
This study aimed to determine the epidemiology of IBS and to identify relationships of gut integrity and QoL in adolescents with IBS. IBS is reported to be one of the most common functional gastrointestinal disorders in children. The prevalence of IBS in this study was higher than reported in studies from North America, Iran, Korea, Japan, and Singapore, where the prevalence varied between 8% and 22%.10–13,18,19 Meta-analyses reported an overall prevalence of 8.8%, 12.4% in Asia, 13% in China, 23% in Turkey, and 2.8–5.1 % in the United States.5,7,10–12,18 It is unclear whether these differences are due to differences in interpretation of Rome criteria due to cultural differences or if they represent real differences. In the United States, Self et al. reported that IBS-C was present in 58.1%, IBS-D in 5.4%, and IBS-M in 36.5%.19 The result of the present study was similar to the data from Rajindrajith & Devanarayana in Sri Lanka, who also reported a predominant distribution of IBS-D.6 In contrast, a prospective hospital-based study from Italy noted IBS-C as the most prevalent IBS subtype (45%). According to an Asian study, an almost similar prevalence was noted for the different subtypes: IBS-C, IBS-D, and IBS-M each occurred in 29–30%.7,10 The prevalence of subtypes of IBS is likely to depend on the methodology, but also on regional differences.
IBS is more frequent in 14–16-year-old adolescents, than in 16–18-year-olds, and more common in girls (62.8%) than boys. Gender difference is not found in every study on IBS, but if a gender difference is reported, it is always more prevalent in girls, with odds ratios between 1.2 and 3.15–7,13,20 in Western countries and 0.8–2.1 in developing countries.20 Studies revealed that IBS is more common in females than in males, with a ratio of 2–2.5:1. Gender related cultural issues can play a role in this. Differences in access to health care and cultural factors such as help-seeking behavior may contribute to the prevalence differences as well.7,10–13,21
According to the logistic regression analysis, the main risk factors were bullying, gender, age, previous history of constipation or diarrhea, nut consumption, and consumption of coffee, tea, juice, and soft drinks, with odds ratios of 1.81–2.86. The present study did not find socio-economic status and education level of the parents to be risk factors for IBS. Multistage and multiphase random sampling were implemented.
This study measured intestinal permeability (fecal AAT) and inflammation (fecal CP) by ELISA. Fecal AAT level had no significant relation with IBS, which differs from the findings by Lisowska-Myjak et al., who reported a relation between fecal AAT levels and IBS diarrhea.9 AAT is a marker of intestinal mucosal damage.22 Fecal CP was related to IBS (p=0.013). Choi & Jeong23 reported an elevated stool CP in 35% of adolescents with IBS (p<0.01). Choi & Jeong also reported that the mean concentration of fecal CP was significantly higher in children and adolescents with IBS than in healthy children (83.50±164.70 vs. 17.77±10.92; p<0.001). Several studies use fecal CP as a tool to differentiate organic disease from functional disorders.23,24 This finding may be related to environmental enteric dysfunction, which is caused by poverty, poor hygiene and sanitation, climate, infection, as well as vitamin A and zinc deficiency.25,26
As expected, the QoL of adolescents with IBS was lower than in those without IBS (92.34±12.6 vs. 97.95±5.9; p=0.001). Studies from France, the United States, and Korea all confirm these findings.27,28 IBS is known to interfere with the physical aspects of health-related QoL, including daily activities and work productivity, yet limited data is available on the effect of the IBS subtypes on daily activity.
There are several strengths and novelties in the present research. Firstly, this research is a large sale community study regarding IBS, prevalence of the subtypes, and relation to gut integrity. It is known that IBS has a negative impact on the QoL of adolescents. Secondly, this study proved the possibility of an organic etiology of IBS symptoms in Indonesian adolescents, which substantiates findings from developing tropical countries to European and American definitions, proposing Rome III criteria as the basis for the diagnosis of IBS, defined as a functional recurrent abdominal pain condition.
The limitation in this study was its relatively small sample size to analyze gut integrity. Further studies with larger sample sizes and long-term follow-up are needed. Moreover, the Rome III criteria were applied, while the updated Rome IV criteria have been developed. Additionally, the severity of IBS was not related to the impact on QoL.
ConclusionThe prevalence of IBS, predominantly the IBS-D subtype, was higher compared with other studies, as well in developed and developing countries. The prevalence of IBS in adolescents in Palembang was as high as 30.2%. This study proved the existence of organic involvement (inflammation of the intestinal mucosa). More studies are needed to further explore these findings.
Conflicts of interestThe authors declare no conflicts of interest.


