


To indicate neck circumference (NC) cutoff points to identify excess weight at different stages of somatic maturation and evaluate the association between NC and body mass index (BMI).
MethodsCross-sectional study with 1715 adolescents. BMI was classified according to the World Health Organization (WHO) criteria. Somatic maturation was obtained through the peak growth velocity (PGV). To define the cutoff points, curves of the receiver operating characteristic (ROC) model were constructed. The agreement between the anthropometric evaluation instruments was analyzed. The association between the variables was verified.
ResultsOf the girls, 93 were in the pre-PGV stage, 266 in the PGV stage, and 481 in the post-PGV stage. Of the boys, 264 were in the pre-PGV stage, 334 in the PGV stage, and 277 in the post-PGV stage. For the pre-PGV group, the cutoff point was 28cm for females and 29cm for males; for the group during PGV, the cutoff points were 30cm for females and 33cm for males; in the post-PGV group the cutoff values were 32cm in females and 35cm in males. The prevalence of excess weight was higher in the pre-PGV stage in males and in the PGV stage in females. The correlation coefficients were higher in the pre-PGV and PGV stages.
ConclusionThe cutoff points for NC found in this study showed good sensitivity and specificity to identify excess weight in Brazilian adolescents and can be used as a reference in epidemiological studies.
Obesity is a complex condition associated with several non-communicable diseases, such as cardiovascular disease, cancer, and diabetes, and is identified as one of the main causes of the decrease in life expectancy in the 21st century.1 Between 1980 and 2013, the prevalence of excess weight (overweight and obesity) increased 47.1% in children and the number of individuals with excess weight increased from 857 million in 1980 to 2.1 billion in 2013.2 The consequences of obesity affect health, quality of life, productivity, and health care costs.3
In Brazil, studies indicate that excess weight affects between 25 and 30% of adolescents in the country4–6 and is associated with almost 20% of arterial hypertension prevalence in schoolchildren.6 In this scenario, the concern with the risks associated with obesity has become universal and countries that are members of the World Health Organization (WHO) have introduced a target to contain the increase in obesity rates by 2025.2
Regarding excess weight monitoring, anthropometric indexes are the most frequently used to determine nutritional status. Because of its practical use in epidemiological studies, the body mass index (BMI) is the most common tool to define overweight and obesity, both in adults and in children and adolescents. However, the BMI has some limitations related to body fat distribution. In this sense, other indexes can be used as alternative instruments for assessing nutritional status, such as neck circumference (NC).7–9
NC is a simple and practical method, has a consistent association with risks of cardiovascular disease10 and insulin resistance,11 good inter- and intra-rater reliability,12 and is a reliable method to identify overweight and obesity in children and adolescents.13,14 However, unlike BMI, NC does not have reference values. Therefore, the aim of this study was to indicate cutoff points for NC to identify excess weight at different stages of somatic maturation and to evaluate the association between NC and BMI in Brazilian adolescents.
MethodsDesign and sampleThis was a cross-sectional study, carried out in ten schools that were geographically distributed in the urban area of the municipality of Cascavel, state of Paraná, Brazil. Of the ten schools, six were public and four were private. Sampling was conducted by convenience due to the schools’ availability and their acceptance when invited to participate in the study. The survey was carried out with 1715 adolescents, of whom 840 were females and 875, males, aged between 10 and 17 years. Sixty-nineadolescents under or above the age of the research proposal were not included in the final data analysis. During the research period, 24,292 students were enrolled in the public-school system and 4384 in the private system.
This study was conducted according to the principles of the Declaration of Helsinki and approved by the Ethics Committee of Centro Universitário Fundação Assis Gurgacz (protocol No. 087/2013). The consent to collect the data was obtained from the students’ parents and tutors. Data were collected between September 2013 and August 2014 by a trained team consisting of two Physical Education professionals, a physiotherapist, and students from the Physical Education course at Centro Universitário Fundação Assis Gurgacz.
The evaluators’ training was carried out at a private university and consisted of theoretical and practical classes, simulations on completing questionnaires, and collection procedures.
Study protocolsWeight and height were collected according to the instructions in the Anthropometric Procedures Manual of the National Health and Nutrition Examination Survey.15 Weight data were collected using a Tanita® (Tanita®, MG, Brazil) digital scale in kilograms (kg), with a capacity of 150kg and an accuracy of 100g. Height was assessed using a Seca® (Seca®, Hamburg, Germany) wall stadiometer with a scale ranging from 0 to 200 centimeters (cm) and precision of 0.1cm. NC was measured using a flexible tape measure, with the subject in the standing position and keeping the head upright, in line with the cricoid cartilage, with a scale in cm. The waist circumference (WC) was measured with a tape measure at the midpoint between the end of the iliac crest and the last rib, according to the procedures suggested by the Centers for Disease Control and Prevention (CDC).15
The weight and height variables were used in the formula BMI=weight (kg)/height2 (m2); subsequently, the BMI scores were categorized according to the reference curves for BMI by age and gender of the WHO.16 The categories were: low weight (1st percentile to the 5th percentile), normal weight (5th percentile to the 85th percentile), and excess weight (above the 85th percentile).
The somatic maturation stage was obtained through the peak growth velocity (PGV) indicator, using the formula proposed by Moore et al.17: PGV=−7.709133+[0.0042232×(age×height)] for females and PGV=−7.999994+[(0.0036124×(age×height)] for males, with height values in cm and age in years. The data were classified into three groups: pre-PGV (−4 to −1), PGV (−0.99 to 0.99), and post-PGV (1–4).
Data analysisThe Kolmogorov–Smirnov test was applied to check for data normality. The data were notnormal. Initially, descriptive statistics were performed to obtain median values and confidence intervals (95% CIs). To compare the results between women and men, the Mann–Whitney U-test was applied. The Kruskal–Wallis test, with Dunn's post hoc test, was used to compare the variables in the three PGV groups. Cohen's d-test was used to check for the size of the growth effect between the post-PGV and pre-PGV somatic maturation stages; the effect size was classified as small (0.2–0.3), medium (0.4–0.7), or large (≥0.8).
Regarding the NC, to define the cutoff points, sensitivity, specificity, and area under the curve (AUC) values, receiver operating characteristic (ROC) curves were constructed with the BMI classifications as the reference standard. The positive and negative predictive values (PPV and NPV, respectively) were calculated for each cutoff point. The Kappa test was used to verify the agreement between the anthropometric assessment instruments. Spearman's correlation test was used to verify the association between NC and BMI. The correlation strength was defined according to the following values: weak (0–0.3), regular (0.3–0.7), and strong (0.7–1).18 A 95% confidence level was adopted. The data were analyzed using IBM SPSS® (IBM SPSS Statistics for Windows, version 20.0. NY, USA) statistical software and MedCalc (MedCalc Software bv, version 18.6. Ostend, Belgium).
ResultsA total of 1715 adolescents participated in this research, of whom 1291 (75.3%) attended public schools, while 424 (24.7%) attended private schools. Of these adolescents, 840 (49%) were females and 875 (51%) were males. Regarding the somatic maturation stage, it was found that of the 840 girls, 93 (11.1%) were in the pre-PGV stage, 266 (31.6%) in the PGV stage, and 481 (57.3%) in the post-PGV stage. Of the 875 boys, 264 (30.2%) were in the pre-PGV stage, 334 (38.2%) in the PGV stage, and 277 (31.6%) in the post-PGV stage.
Overall, for age, weight, height, and NC, boys showed significant and higher values than girls (Table 1), which did not occur with BMI. In both genders, all variables were significantly higher in the more advanced stages of PGV, when compared to pre-PGV values (Table 1). The size of the growth effect was large for the variables: weight (both genders), height (both genders), BMI (females) and NC (both genders): for the weight variable, the effect size was d=1.92 in males and d=2.01 in females; for the height variable, the effect size was d=3.81 in males and d=4.15 in females; for BMI, the effect size was d=0.66 in males and d=1.02 in females; for the NC variable, the effect size was d=1.59 in males and d=1.22 in females.
Demographic and anthropometric characteristics of 1715 (840 girls and 875 boys) adolescent students aged between 10 and 17 years in a municipality in Southern Brazil.
| Variable | Gender | Overall | Pre-PGVa | PGVb | Post-PGVc | p-value1 |
|---|---|---|---|---|---|---|
| Median (95%CI) | ||||||
| Age (years) | Female | 13.0 (13.2–13.4) | 10.0 (10.1–10.3) | 12.0 (11.8–12.1) | 15.0 (14.6–14.8) | <0.001 |
| Male | 14.0 (13.3–13.6) | 11.0 (11.1–11.3) | 14.0 (13.4–13.5) | 16.0 (15.5–15.7) | ||
| p-value2 | <0.001 (a≠b≠c) M/F | |||||
| Weight (kg) | Female | 51.0 (51.3–52.9) | 35.8 (36.4–39.7) | 47.0 (46.8–49.3) | 55.1 (56.1–58.1) | <0.001 |
| Male | 54.8 (54.9–57.0) | 41.0 (42.3–45.1) | 54.0 (55.0–57.7) | 65.0 (65.6–68.8) | ||
| p-value2 | <0.001 (a≠b≠c) M/F | |||||
| Height (cm) | Female | 158.2 (156.9–158.0) | 143.8 (142.3–144.8) | 154.3 (153.6–154.9) | 161.0 (161.3–162.4) | <0.001 |
| Male | 164.5 (162.1–163.7) | 149.0 (148.0–149.7) | 165.0 (164.1–165.7) | 174.0 (173.2–174.6) | ||
| p-value2 | <0.001 (a≠b≠c) M/F | |||||
| BMI (kg/m2) | Female | 20.3 (20.6–21.1) | 17.8 (17.7–19.0) | 19.5 (19.6–20.5) | 21.0 (21.4–22.0) | >0.05 |
| Male | 19.9 (20.5–21.0) | 18.5 (19.0–20.0) | 19.7 (20.1–21) | 21.4 (21.7–22.6) | ||
| p-value2 | <0.001 (a≠b≠c) M/F | |||||
| NC (cm) | Female | 29.7 (29.3–29.7) | 27.0 (26.9–28.0) | 29.0 (28.2–29.1) | 30.5 (30.2–30.6) | <0.001 |
| Male | 31.5 (31.6–32.1) | 29.0 (28.6–29.6) | 32.0 (31.7–32.3) | 34.0 (33.7–34.5) | ||
| p-value2 | <0.001(a≠b≠c) M/F | |||||
PGV, peak growth velocity; BMI, body mass index; NC, neck circumference; 1, Mann–Whitney U-test for gender difference; 2, Kruskal–Wallis test for difference between the groups; M, male; F, female.
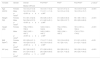
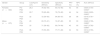
Table 2 shows the cutoff points for NC with their respective sensitivity, specificity, and predictive values. For the pre-PGV group, the cutoff points were 28cm for females and 29cm for males; for the PGV group, the cutoff points were 30cm for females and 33cm for males; in the post-PGV group, the proposed points are 32cm in females and 35cm in males. All AUC values were statistically significant. In females, the highest AUC was found in the group during PGV (0.849) (Table 2 and Fig. 1); in males, the highest AUC was found in the pre-PGV group (0.848) (Table 2 and Fig. 2).
Excess weight cutoff points for neck circumference of 1715 (840 girls and 875 boys) adolescent students aged between 10 and 17 years in a municipality in Southern Brazil.
| Gender | Group | Cutoff point (cm) | Sensitivity (95%CI) | Specificity (95%CI) | PPV (%) | NPV (%) | AUC (95%CI) |
|---|---|---|---|---|---|---|---|
| Females (n=840) | Pre-PGV | 28.2 | 78 (52–94) | 83 (72–90) | 52 | 94 | 0.835 (0.744–0.904)a |
| PGV | 29.7 | 78 (65–89) | 76 (70–82) | 44 | 94 | 0.849 (0.800–0.890)a | |
| Post-PGV | 32 | 72 (59–83) | 84 (80–87) | 38 | 96 | 0.818 (0.781–0.852) | |
| Males (n=875) | Pre-PGV | 29 | 83 (73–91) | 74 (67–80) | 55 | 93 | 0.848 (0.799–0.889)a |
| PGV | 33 | 71 (58–82) | 80 (74–84) | 43 | 93 | 0.827 (0.782–0.866)a | |
| Post-PGV | 35 | 70 (53–83) | 77 (71–82) | 34 | 94 | 0.814 (0.763–0.858)a |
PPV, positive predictive value; NPV, negative predictive value, AUC, area under the curve.
 curves for neck circumference in relation to peak growth velocity (PGV) of 875 male adolescent students aged between 10 and 17 years in a municipality in Southern Brazil.")
 curves for neck circumference in relation to peak growth velocity (PGV) of 840 female adolescent students aged between 10 and 17 years in a municipality in Southern Brazil.")
The prevalence of excess weight among adolescents, using the WHO BMI criterion and the cutoff point for NC, was higher in the pre-PGV stage in males and in the PGV stage in females (Supplementary Table 1). Agreement between the criteria (Kappa test) was moderate in all groups (Supplementary Table 1).
Supplementary Table 2 shows the correlation values between NC and anthropometric variables by gender and somatic maturation group. In females, the correlations were moderate in all variables; however, NC showed a strong correlation with waist circumference in the pre-PGV group. In males, NC showed a strong correlation with weight and waist circumference. The correlation between NC and BMI was regular in all somatic maturation groups and in both genders. All correlations were significant at the 99% level (p<0.001).
DiscussionThis study found NC cutoff points that can identify excess weight in Brazilian schoolchildren based on the different stages of somatic maturation. The cutoff points showed high sensitivity and specificity values, with a high negative predictive value. NC and BMI showed moderate but significant correlations in all somatic maturation groups and in both genders. NC showed a strong correlation with waist circumference in both genders, especially in the pre-somatic maturation groups.
Adolescence is a period of great changes, and during puberty, several aspects of body composition increase, such as height, weight, lean and fat mass, and bone mineral content.19 This fact was observed in the present study regarding the weight, height, BMI, and NC variables, which showed significant differences, with large effect sizes between the maturation groups.
The median NC was similar to that in other studies, such as the study by Ferretti et al.,14 which found an average NC of 30cm in female adolescents and 33cm in male ones. In another study, carried out in the United States, in the state of Michigan, the mean NC was 33cm in males and 31cm in females.7
The cutoff points found in this study are very similar to those proposed by Ferretti et al.14 They proposed cutoff points for pubertal stages; in the prepubertal group, the proposed points were 28cm for females and 30cm for males; in the pubertal group, the cutoff points were 31cm in females and 34cm in males; and in the post-pubertal group, the cutoffs were 31cm for females and 34cm for males. Such results suggest that cutoff points based on maturation stages, somatic or pubertal, can provide reliable results in evaluations.
The prevalence of excess weight was high using both the BMI and NC criteria, especially in the pre-PGV group in males and in the PGV group in females. The accumulation of fat and the increase in energy expenditure for the pubertal growth spurt to occur may explain the higher rates in these groups.19 The literature points out that after the onset of puberty, there are significant increases in energy requirement and association with changes in body composition; the energetic needs occur due to the increase in physical capacities. Changes in body composition, such as an increase in fat-free mass, result in hormonal changes, such as an increase in testosterone and growth hormone metabolism, which may explain a higher energy expenditure in post-pubertal adolescents compared to pre-pubertal ones.19,20 The results, however, do not differ much from other prevalence studies carried out in Brazil that found a prevalence of 30.1% of excess weight in females and 29.4% in males.6 The agreement between NC and BMI was moderate in all groups; however, the pre-PGV groups showed greater agreement.
The correlation between NC and BMI found in the present study was moderate in both genders and was lower than the correlations in the studies by Nafiu et al.7 (0.71 in males and 0.78 in females) and Hatipoglu et al.13 (0.70 in males and 0.72 in females, in the prepubertal stage). Although the strength of the correlation is moderate, these results are consistent and show that NC has a good performance in identifying high BMI in adolescents of both genders with different maturation stages. Moreover, NC showed a strong correlation with waist circumference, which indicates a significant association with abdominal fat. In this sense, NC can be used as an epidemiological assessment instrument to identify excess weight, in addition to being an important predictor for cardiovascular disease risk.10
Moreover, BMI fails to differentiate excess weight and body fat distribution. Alternatively, NC is a great measure for identifying body fat distribution.21 It is known that fat located in the upper trunk, whether visceral or subcutaneous, is strongly related to the risk of developing diseases and has a higher metabolic risk than abdominal or visceral fat.22 A study carried out in 2014, in the city of Campinas, state of São Paulo, Brazil, showed that NC can be used as a good predictor of insulin resistance in adolescents.11
To start controlling the obesity epidemic in childhood and adolescence, it is necessary to have accessible, low-cost, fast, and easy-to-use monitoring tools. NC is a non-invasive, inexpensive, and simple method to use and is even easier to obtain than other tools, such as BMI and waist circumference, as it does not require a scale, stadiometer, or the children to remove their clothes to undergo the assessment.7,13,21 Another strong point of NC is its good inter- and intra-rater reliability.12
The present authors must point out some limitations of this research and thus consider them in the interpretation and extrapolation of the results. The obtained data were based on a cross-sectional study and body composition assessments considered as the gold standard (imaging exams) were not performed; this was a convenience sample and the predictive values based on the analysis of the ROC curve depend on the disease prevalence; therefore, it is suggested to consider using it in studies with a low prevalence of overweight and obesity. Despite these limitations, the results of this study indicate the feasibility and consistency of using NC in epidemiological studies.
To conclude, the cutoff points for NC found in this study have good sensitivity and specificity to identify excess weight in Brazilian adolescents and can be used as a reference in epidemiological studies. NC showed a moderate correlation with BMI and a strong correlation with waist circumference in both genders.
FundingCoordenação de Aperfeiçoamento de Pessoal de Nível Superior (CAPES), process number 1650410.
Conflicts of interestThe authors declare no conflicts of interest.
The following are the supplementary data to this article:


