

The objective of the present study is to evaluate whether IL-6, TNF-α, IL-10 are associated with nutritional status in patients with cirrhosis secondary to biliary atresia and compare to healthy controls.
MethodsThe parameters used for nutritional assessment were the standard deviation scores of height-for-age and of triceps skinfold thickness-for-age. The severity of cirrhosis was evaluated using the Child–Pugh score and PELD/MELD. Serum cytokines were measured using Cytometric Bead Array flow cytometry.
ResultsIL-6, TNF-α, and IL-10 were significantly higher in the cirrhosis group when compared with the control group (2.4 vs. 0.24 (p<0.001), 0.21 vs. 0.14 (p=0.007), and 0.65 vs. 0.36 (p=0.004), respectively. IL-6 and IL-10 were positively correlated with disease severity (0.450 [p=0.001] and 0.410; [p=0.002], respectively). TNF-α did not show a significant correlation with disease severity (0.100; p=0.478). Regarding nutritional evaluation, IL-6 was negatively correlated with the standard deviation score of height-for-age (−0.493; p<0.001) and of triceps skinfold thickness-for-age (−0.503; p<0.001), respectively. IL-10 exhibited a negative correlation with the standard deviation score of height-for-age (−0.476; p<0.001) and the standard deviation score of triceps skinfold thickness-for-age (−0.388; p=0.004). TNF-α did not show any significance in both anthropometric parameters (−0.083 (p=0.555) and −0.161 (p=0.253).
ConclusionThe authors suggest that, in patients with cirrhosis secondary to biliary atresia, IL-6 could be used as a possible supporting biomarker of deficient nutritional status and elevated IL-10 levels could be used as a possible early-stage supporting biomarker of deteriorating nutritional status.
O objetivo deste estudo é avaliar se há associação entre a IL-6, o TNF-α e a IL-10 com o estado nutricional de pacientes com cirrose por Atresia Biliar e comparar com controles saudáveis.
MétodosOs parâmetros utilizados na avaliação nutricional foram o escore-z da estatura para a idade e da dobra cutânea tricipital para idade. A gravidade da cirrose foi avaliada pelo escore Chil-Pugh e pelos modelos PELD/MELD. As citocinas séricas foram quantificadas por citometria de fluxo.
ResultadosA IL-6, o TNF-α e a IL-10 foram significativamente mais elevados no grupo cirrose quando comparado ao grupo controle [2,4×0,24 (p<0,001)], [0,21×0,14 (p=0,007] e [0,65×0,36 (p=0,004)], respectivamente. A IL-6 e a IL-10 demonstraram correlação direta com a gravidade da doença (0,450; p=0,001) e (0,410; p=0,002), respectivamente. O TNF-α não apresentou significância com a gravidade da doença (0,100; p=0,478). Em relação à avaliação nutricional, a IL-6 mostrou correlação inversa com o escore-z da estatura para idade (−0,493; p<0,001) e com o escore-z da dobra cutânea tricipital (−0,503; p<0,001), respectivamente. A IL-10 mostrou correlação inversa com o escore-z da estatura para idade (−0,476; p<0,001) e com o escore-z da dobra cutânea tricipital (−0,388; p=0,004), respectivamente. O TNF-α não mostrou significância em ambos parâmetros antropométricos [(−0,083; p=0,555); (−0,161; p=0,253)].
ConclusãoOs autores sugerem que, em pacientes com cirrose por Atresia Biliar, a IL-6 possa ser usada como um possível biomarcador coadjuvante do estado nutricional deficiente e que níveis elevados de IL-10 possam ser utilizados como um biomarcador coadjuvante precoce na deteriorização do estado nutricional.
Biliary atresia (BA) is an idiopathic cholangiopathy of childhood characterized by complete obstruction of the bile ducts. Progressive inflammation and fibrosis lead to secondary biliary cirrhosis in the majority of patients.1,2 Cirrhosis, which is the end stage of many liver diseases, is histopathologically identified as a diffuse process of hepatic fibrosis and nodule formation.3 As cirrhosis advances, it leads to an irregular supply of nutrients, oxygen, and metabolites.4,5 These changes affect energy synthesis and metabolism, with an impact on the nutritional status of patients with liver disease.6 The pathogenesis of malnutrition in liver disease is multifactorial, and the possible etiology is a combination of conditions such as reduced caloric intake resulting from anorexia and dietary restrictions, intestinal malabsorption, abnormalities in the metabolism of macronutrients, and increased pro-inflammatory cytokines.6 In fact, malnutrition is recognized as a factor associated with increased morbidity and mortality in the pre- and post-liver transplantation periods.7 Children and adolescents with chronic liver disease have increased energy needs, corresponding to 120% to 150% of their estimated energy requirement (EER).8 Cytokines and growth factors are known to play an important role in cirrhosis. Interleukin-6 (IL-6) has been associated with worsening nutritional status in chronically ill patients.9 In patients with cirrhosis, a significant association of tumor necrosis factor alpha (TNF-α) and its receptors with energy metabolism has been described, suggesting that the activation of the TNF-α system contributes to the anorexia-cachexia syndrome observed in these patients.10 Conversely, interleukin-10 (IL-10) is a cytokine with anti-inflammatory properties; its expression in BA is controversial.11
Nutritional assessment of patients with cirrhosis is hindered by the presence of organomegaly and edema and by the complexity of the interpretation of laboratory parameters commonly used to evaluate nutrition, which are rendered abnormal by liver disease.8,12 The nutritional assessment of children with cirrhosis is complicated by the presence of fluid retention, hepatomegaly, and splenomegaly, all of which can distort anthropometric measurements.6 Considering the associations between cytokines and nutritional status, they may be indirect biomarkers to support nutritional assessment.
The objective of the present study was to evaluate whether IL-6, TNF-α, and IL-10 are associated with nutritional status in patients with cirrhosis secondary to BA.
MethodsFrom December 2006 to December 2011, 53 children with cirrhosis secondary to BA and 33 healthy, well-nourished, sex- and age-matched controls were recruited at Hospital de Clínicas de Porto Alegre. Participants’ age ranged from 4 months to 17 years. All participants underwent a nutritional status assessment and completed a questionnaire designed to collect clinical, dietary, and demographic data. This study was approved by the Research Ethics Committee of the Hospital de Clínicas de Porto Alegre. The study followed the principles set forth by Resolution 466/12 on human research, and was approved under CAEE No. 0317.0.001.000-10. Informed and written consent was obtained from the parents/guardians of all participants.
Cirrhosis groupThe Kasai surgery was performed in all patients. From 53 patients, four were temporarily drained (two aged 4 months and two aged 5 months); nonetheless, all of them had the diagnosis of cirrhosis confirmed by biopsy performed in surgery. Regarding the cirrhosis diagnosis, 39 (73.6%) underwent biopsy. The remaining patients could not undergo an invasive procedure; therefore, they were diagnosed by clinical evaluation, biochemical tests, and ultrasound changes consistent with cirrhosis.
The exclusion criteria were presence of any other disease (chronic or acute), acute infection, fever at the time of blood collection, antibiotic therapy up to 15 days of blood collection, and steroid therapy. All participants received vitamins A, D, E, and K, minerals, antacids, and proton pump inhibitors if necessary as part of the standard of care.
The severity of cirrhosis was evaluated using the Child–Pugh score and the Pediatric End-stage Liver Disease (PELD) and Model for End-stage Liver Disease (MELD) scores. Patients were categorized as Child–Pugh class A (mild disease), B (moderate disease), or C (severe disease). In the interest of uniformity, categories B and C were pooled together. Subjects aged 12 years or younger were also assessed using the PELD scores, while older participants were evaluated through MELD scores. In both cases, higher values are indicative of more severe disease.
Control groupAll participants allocated to the control group were healthy, well-nourished children and adolescents scheduled to undergo blood collection for regular healthcare checks or minor surgical procedures. The exclusion criteria were: preterm birth, presence of any other conditions (chronic or acute), a restrictive diet, and medication use (except iron and vitamins at prophylactic doses).
Assessment of nutritional statusIn both groups, nutritional status was assessed through anthropometric measurements, obtained as described in the World Health Organization (WHO) Training Course on Child Growth Assessment. Nutritional status was classified using standard deviation scores (SDS), in accordance with the WHO Standards and Reference. The parameters used for nutritional status classification were height-for-age (H/A), triceps skinfold thickness-for-age (TSF/A), and mid-upper arm circumference-for-age (MUAC/A). The body mass index-for-age (BMI/A) parameter was used to classify controls as well-nourished (data not shown). SDS-BMI/A values outside the −2.0 and +2.0 range for children younger than 5 years and outside of the −2.0 and +1.0 range for children older than 5 years were used to define well-nourishment in the control group. In the cirrhosis group, undernourishment was defined as SDS-H/A and/or SDS-TSF/A equal to or below −2.0. The same parameters used for individual nutritional status assessment in the cirrhosis group were used to compare the results of the assessment between groups. The WHO Anthro software, version 3.0,13 was used to calculate anthropometric data for children under 5 years, whereas the data of children over 5 years and adolescents were calculated using the WHO AnthroPlus14 and Frisancho Anthropometric Standards15 software suites.
Participants’ habitual diets were evaluated using a three-day dietary recall (two non-consecutive weekdays and one weekend day). All dietary records were calculated in the Nutwin (version 2.5) computer program. After calculating the mean dietary intake over the three days recorded, EER was determined, taking into account patient age, height, and weight, pursuant to the dietary reference intake (DRI) and recommended dietary allowance (RDA) recommendations. After analyzing the three-day dietary record, patients who did not reach the minimum target of 120% of the recommended individual needs received supplements. Those who did not meet the energy needs orally received enteral supplementation and those who could not feed themselves received exclusive enteral nutrition. Fifty patients were in oral feeding (33.9% of patients were supplemented by hypercaloric formula), two patients were in enteral feeding, and one was in both oral and enteral feeding.
Cytokine quantitationBlood samples were collected with at least a three-hour fast. Serum was centrifuged for 10min at 1000g (4°C) and stored at −80°C for later analysis.
Quantitation of IL-6, IL-10, and TNF-α in serum was analyzed in duplicate by Cytometric Bead Array flow cytometry, in accordance with the manufacturer's protocol (BD Biosciences, USA).
The biomarkers evaluation was performed along with nutritional assessment and not with the Kasai surgery. Nutritional assessment and blood collection were performed with an interval of no longer than one week.
Statistical analysisVariables were expressed as mean±SD or median. The Kolmogorov−Smirnov test was used to assess the normality of data distribution. Normally distributed variables were compared by analysis of variance (ANOVA) and Student's t-test. Asymmetrically distributed variables were analyzed by the Kruskal−Wallis and Mann–Whitney U tests. Spearman coefficients were used to test for correlation. Analysis of covariance (ANCOVA) was used to control for confounding factors between cytokines and nutritional parameters. To this end, nutritional parameters were stratified into tertiles and cytokine levels were log-transformed to enable use of a parametric test. The square root of eta squared was used to estimate the size effect and interpreted on Pearson's scale. The significance level was set at 5% for all analyses.
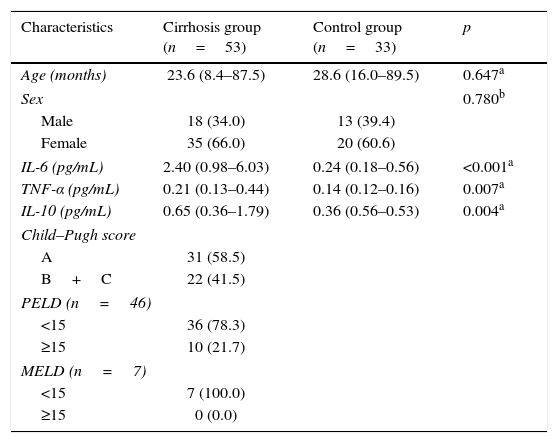
ResultsGeneral characteristicsThere were no significant differences between groups regarding age or sex. Most patients were classified as Child−Pugh A and had PELD/MELD scores below 15 (Table 1).
General characteristics of the cirrhosis and control groups.
| Characteristics | Cirrhosis group (n=53) | Control group (n=33) | p |
|---|---|---|---|
| Age (months) | 23.6 (8.4–87.5) | 28.6 (16.0–89.5) | 0.647a |
| Sex | 0.780b | ||
| Male | 18 (34.0) | 13 (39.4) | |
| Female | 35 (66.0) | 20 (60.6) | |
| IL-6 (pg/mL) | 2.40 (0.98–6.03) | 0.24 (0.18–0.56) | <0.001a |
| TNF-α (pg/mL) | 0.21 (0.13–0.44) | 0.14 (0.12–0.16) | 0.007a |
| IL-10 (pg/mL) | 0.65 (0.36–1.79) | 0.36 (0.56–0.53) | 0.004a |
| Child–Pugh score | |||
| A | 31 (58.5) | ||
| B+C | 22 (41.5) | ||
| PELD (n=46) | |||
| <15 | 36 (78.3) | ||
| ≥15 | 10 (21.7) | ||
| MELD (n=7) | |||
| <15 | 7 (100.0) | ||
| ≥15 | 0 (0.0) | ||
PELD, Pediatric End-stage Liver Disease score; MELD, Model for End-stage Liver Disease score.
Data expressed as n (%) or median (interquartile range).
Regarding the clinical presentation of the disease, all patients (100%) had splenomegaly, seven (13.2%) had ascites, 19 (35.8%) had variceral bleed, 31 (58.5%) had overt jaundice, and 38 (71.7%) had thrombocytopenia.
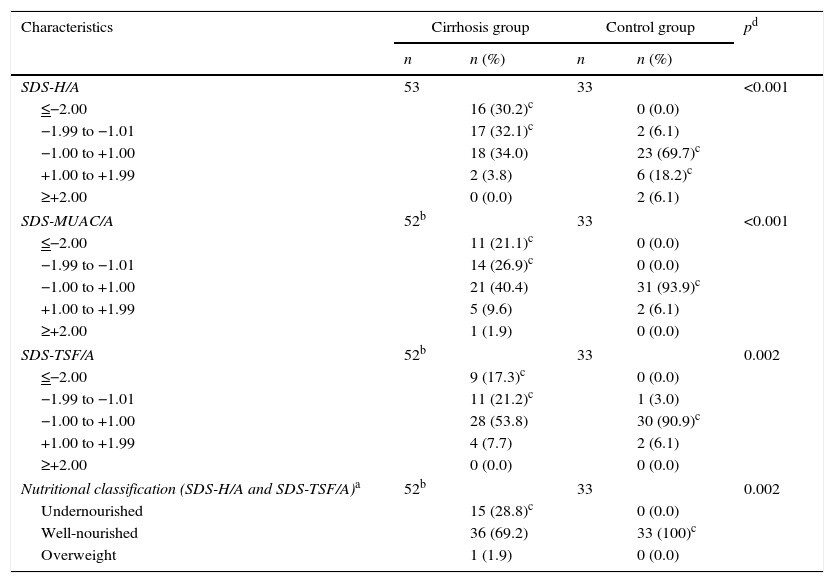
Nutritional status and dietary assessmentThe nutritional parameters of interest and the results of the nutritional assessment are shown in Table 2. For the assessment of dietary intake by EER (%), participants were divided into four age ranges: 0−2, 2−5, 5−10, and >10 years. The median (interquartile range) EER (%) for each age group was 122 (97−162), 106 (85−128), 88 (77−105), and 81 (63−95), respectively. The nutritional assessment indicated that most patients in the cirrhosis group were well-nourished (69.2%).
Nutritional parameters and assessment.
| Characteristics | Cirrhosis group | Control group | pd | ||
|---|---|---|---|---|---|
| n | n (%) | n | n (%) | ||
| SDS-H/A | 53 | 33 | <0.001 | ||
| ≤−2.00 | 16 (30.2)c | 0 (0.0) | |||
| −1.99 to −1.01 | 17 (32.1)c | 2 (6.1) | |||
| −1.00 to +1.00 | 18 (34.0) | 23 (69.7)c | |||
| +1.00 to +1.99 | 2 (3.8) | 6 (18.2)c | |||
| ≥+2.00 | 0 (0.0) | 2 (6.1) | |||
| SDS-MUAC/A | 52b | 33 | <0.001 | ||
| ≤−2.00 | 11 (21.1)c | 0 (0.0) | |||
| −1.99 to −1.01 | 14 (26.9)c | 0 (0.0) | |||
| −1.00 to +1.00 | 21 (40.4) | 31 (93.9)c | |||
| +1.00 to +1.99 | 5 (9.6) | 2 (6.1) | |||
| ≥+2.00 | 1 (1.9) | 0 (0.0) | |||
| SDS-TSF/A | 52b | 33 | 0.002 | ||
| ≤−2.00 | 9 (17.3)c | 0 (0.0) | |||
| −1.99 to −1.01 | 11 (21.2)c | 1 (3.0) | |||
| −1.00 to +1.00 | 28 (53.8) | 30 (90.9)c | |||
| +1.00 to +1.99 | 4 (7.7) | 2 (6.1) | |||
| ≥+2.00 | 0 (0.0) | 0 (0.0) | |||
| Nutritional classification (SDS-H/A and SDS-TSF/A)a | 52b | 33 | 0.002 | ||
| Undernourished | 15 (28.8)c | 0 (0.0) | |||
| Well-nourished | 36 (69.2) | 33 (100)c | |||
| Overweight | 1 (1.9) | 0 (0.0) | |||
SDS-H/A, standard deviation score of height-for-age; SDS-MUAC/A, standard deviation score of mid-upper arm circumference-for-age; SDS-TSF/A, standard deviation score of triceps skinfold thickness-for-age.
Levels of the studied cytokines were significantly higher in the cirrhosis group than in the control group (Table 1). The Child−Pugh score was used to correlate cytokine levels with the severity of cirrhosis. Correlations were classified according to the Spearman coefficient as weak (<0.3), moderate (0.3−0.59), strong (0.6−0.89), or very strong (>0.9).
The Child−Pugh scores and Spearman coefficients were also used to determine nutritional parameters and disease severity were correlated. All nutritional parameters of interest were moderately correlated with disease severity. IL-6 and IL-10 demonstrated a positive correlation with disease severity (0.45 [p=0.001] and 0.41[p=0.002], respectively). TNF-α was not significantly correlated (0.10; p=0.478). Regarding anthropometric parameters, SDS-H/A, SDS-MUAC/A, and SDS-TSF/A showed an inverse correlation with disease severity, (−0.47 [p<0.001], −0.45 [p=0.001], and −0.43 [p=0.002], respectively).
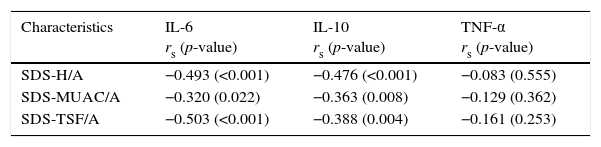
Correlation between cytokines and nutritional parametersSpearman coefficients indicated a moderate, inverse, statistically significant correlation of the nutritional parameters of interest with IL-6 and IL-10 (Table 3).
Correlation between cytokines and nutritional parameters (Spearman's coefficient).
| Characteristics | IL-6 rs (p-value) | IL-10 rs (p-value) | TNF-α rs (p-value) |
|---|---|---|---|
| SDS-H/A | −0.493 (<0.001) | −0.476 (<0.001) | −0.083 (0.555) |
| SDS-MUAC/A | −0.320 (0.022) | −0.363 (0.008) | −0.129 (0.362) |
| SDS-TSF/A | −0.503 (<0.001) | −0.388 (0.004) | −0.161 (0.253) |
SDS-H/A, standard deviation score of height-for-age; SDS-MUAC/A, standard deviation score of mid-upper arm circumference-for-age; SDS-TSF/A, standard deviation score of triceps skinfold thickness-for-age; rs, Spearman coefficient.
To control for potential confounders, analysis of covariance (ANCOVA) was performed to detect whether these factors remained independently associated with cytokines. Of the three nutritional parameters assessed, only SDS-H/A remained associated with cytokines after adjustment for Child–Pugh score, age, and EER (%). To better understand this association, SDS-H/A was stratified into tertiles. The results are shown in Fig. 1. Children classified into the first and second tertiles presented higher levels of IL-6 and IL-10 than those classified into the third tertile.
 IL-6 serum values; (B) IL-10 serum values; (C) TNF-α serum values. Children classified into the first and the second tertiles presented higher levels of IL-6 and IL-10 than those classified into the third tertile, demonstrating the impairment in nutritional status (as represented by height-for-age). The line inside the box represents the median. The upper and lower limits of the box represent the 25th and 75th percentiles, respectively. Upper and lower error bars represent the minimum and maximum values of the sample. The asterisks and circles represent outliers. η,2, eta squared; M, median (25th and 75th percentiles); SDS-H/A, standard deviation score of height-for-age.")
Cytokine values stratified into tertiles of height for age. (A) IL-6 serum values; (B) IL-10 serum values; (C) TNF-α serum values. Children classified into the first and the second tertiles presented higher levels of IL-6 and IL-10 than those classified into the third tertile, demonstrating the impairment in nutritional status (as represented by height-for-age). The line inside the box represents the median. The upper and lower limits of the box represent the 25th and 75th percentiles, respectively. Upper and lower error bars represent the minimum and maximum values of the sample. The asterisks and circles represent outliers. η,2, eta squared; M, median (25th and 75th percentiles); SDS-H/A, standard deviation score of height-for-age.
According to eta-squared values, SDS-H/A explained 15.4% and 19.7% of the variability in IL-6 and IL-10 levels, respectively, while TNF-α explained only 3.6% (no statistical significance).
DiscussionIn the present study, the authors correlated nutritional status with cytokines and disease severity. The literature indicates that deteriorated nutritional status increases disease severity, which in turns worsens nutritional status.8 Regarding nutritional status, all anthropometric parameters were evaluated and statistically analyzed as Z-score, recommended by WHO.13,14 Concerning cirrhosis severity, statistical analysis was performed with both the Child–Pugh score (all patients) and PELD (children under 12 years)/MELD (children over 12 years and adolescents). The results were similar in both scores. Thus, the Child–Pugh score was chosen in order to standardize the analysis with only one score, since due to wide age range, both the PELD and MELD scores would have to be used together, reducing the uniformity. To evaluate food consumption, the EER was used. This score is calculated through equations that consider energy expenditure, age, sex, weight, height and level of physical activity; the formulas are different for each stage of life. The EER was calculated individually; after analyzing the three-day dietary recall, it was possible to assess whether patients were ingesting the energy value recommended for cirrhosis.
The American Society for Parenteral and Enteral Nutrition (ASPEN) recently published a document redefining pediatric malnutrition, suggesting the inclusion of proinflammatory cytokines as adjuvants in nutritional assessment.16 IL-6 is a cytokine that reflects the inflammatory status of patients with chronic liver disease, and may be a potential marker of disease progression.17 In the present sample, higher levels of IL-6 were found in patients than in the control group (2.40 vs. 0.24pg/mL, p<0.001), and a moderate correlation was observed between IL-6 and disease severity (rs=0.45). In a recent publication, the authors have already shown an association between IL-6 and nutritional status in children and adolescents with chronic liver disease. Pediatric patients at nutritional risk were compared with those well-nourished and the IL-6 values were higher in the first group (7.12pg/mL vs. 1.63pg/mL; p=0.02).18 Although the samples in both studies differ (the present study's sample comprises only patients with cirrhosis due to BA), the results are similar, demonstrating a relationship between nutritional status and IL-6. El-Faramawy et al.1 assessed IL-6 in a sample of younger children (aged 17.8±4.8 months) and found values very similar to those of the present study. Kobayashi et al.19 assessed IL-6 in older children (age 12.5±3.4 years) and classified liver function by severity and age. They demonstrated that the cytokine levels were higher in patients with more severe disease across all age ranges. Therefore, the present results confirm the role of IL-6 as a possible supporting biomarker of cirrhosis severity in children with cirrhosis secondary to BA.
TNF-α is considered a proinflammatory cytokine.20 In adults patients with cancer, it has been shown to reduce appetite and food intake.21 Despite the fact that the cirrhosis group presented higher values of TNF-α than the control group (p=0.004), the present findings did not reveal a correlation of this cytokine and disease severity (p=0.478), nor with any anthropometric parameter. The same results were demonstrated by Santetti et al.18 In an adult sample, Shiraki et al.10 found higher values in cirrhotic patients when compared with the control group (p<0.001), as well as in patients with more severe disease (p<0.001). The present results may be explained by the fact that the study sample was largely composed of patients with cirrhosis Child–Pugh A (and PELD/MELD below 15), with a low prevalence of malnutrition (28.3%).
According to Nelson et al., IL-10 is an anti-inflammatory cytokine with a protective effect against hepatic fibrogenesis, playing a major role in regulating the immune response.22 Variation in levels may be associated with polymorphisms in the gene that encodes IL-10.23 Narayanaswamy et al.24 measured this cytokine in patients with BA who had undergone portoenterostomy and found no significant difference in levels when compared with those of healthy controls (p=0.8); however, these levels were higher than those found in cholestatic controls (p=0.05). In the present sample, the levels of this cytokine were higher in cirrhotic patients than in the control group (0.65 vs. 0.36pg/mL, p=0.004), and showed a moderate correlation with disease severity (rs=0.41). Conversely, Jian et al.11 and Wu et al.25 evaluated IL-10 in patients who had undergone portoenterostomy and found no significant difference between patients and controls.
In this study, anthropometric assessment findings were correlated with disease severity (Table 3). The present findings are similar to those reported by Hurtado-López et al., Saron et al., and Elkabbany et al., who compared TSF/A with disease severity in children with chronic liver disease and found that the degree of deterioration in liver function was closely related to nutritional status.26–28 The present data reflect the fact that disease severity leads to deterioration of nutritional status; this, in turn, worsens patient clinical condition. Therefore, it is essential that nutritional interventions should be implemented as soon as nutritional risk is identified in patients with BA.
The authors agree with Mehta et al., who suggested that IL-6 may serve as a marker of worsening nutritional status in patients with chronic disease.9 Shiraki et al. suggested that activation of TNF-α leads to abnormal metabolism, which contributes to the malnutrition process in adults with cirrhosis.10 The present findings demonstrated a moderate correlation of height with IL-6 and IL-10 (Fig. 1). After dividing SDS-H/A measurements into tertiles and comparing IL-6 and IL-10 values in each tertile, significant differences were found in the first and second tertiles when compared with the third tertile, which demonstrates that, the greater the impairment in nutritional status (as represented by H/A), the higher the levels of IL-6 and IL-10 (Fig. 1). Thus, children classified into the first and the second tertiles presented higher levels of IL-6 and IL-10 than those classified into the third tertile, demonstrating the impairment in nutritional status. Although the present findings have shown correlation between cytokines and severity of the disease, some factors must be considered as changes in liver metabolism.
Monk et al., in a recent publication, studied body weight progression in weaned mice that were fed different diets29; their findings suggest that high IL-10 levels are dependent on the altered metabolism that occurs with nutritional deficits. In practice, the present results demonstrated that greater stunting of growth is associated with higher levels of IL-6 and IL-10. Since height is an indicator of malnutrition in the pediatric population, it is possible to conclude that higher IL-6 and IL-10 concentrations are associated with worse malnutrition. These results confirm the role of IL-6 as an indicator of worsening nutritional status, and suggest that IL-10 level could serve as an alert system of an attempt of the body to overcome the inflammatory process that occurs with deterioration of nutritional status. Although there are several gene polymorphisms of these interleukins,30 further studies should evaluate these alleles in this population.
The major strength of this study was the prospective analysis of a group of patients with a homogeneous etiology of liver disease; its limitations were a relatively small sample size limited to patients who were attended to at this hospital, and a small number of patients with severe disease. The recommendation for further research is to replicate this study using a larger sample, including more patients with severe disease.
In conclusion, IL-6 could be used as a possible supporting biomarker of deficient nutritional status, and elevated IL-10 levels may be used as a possible early-stage supporting biomarker of deteriorating nutritional status in patients with cirrhosis secondary to BA.
FundingCoordenação de Aperfeiçoamento de Pessoal de Nível Superior (CAPES), Fundo de Incentivo a Pesquisa (FIPE), and Programa de Pós-graduação em Saúde da Criança e do Adolescente (PPG-SCA).
Conflicts of interestThe authors declare no conflicts of interest.
The authors would like to acknowledge the support and help provided by the Experimental Laboratory of Gastroenterology and Hepatology and the Laboratory of Molecular Psychiatry, Hospital de Clínicas de Porto Alegre.
Please cite this article as: Wilasco MI, Uribe-Cruz C, Santetti D, Fries GR, Dornelles CT, Silveira TR. IL-6, TNF-α, IL-10, and nutritional status in pediatric patients with biliary atresia. J Pediatr (Rio J). 2017;93:517–24.
Study conducted at Universidade Federal do Rio Grande do Sul, Faculdade de Medicina, Programa de Pós-graduação em Saúde da Criança e do Adolescente, Porto Alegre, RS, Brazil.


