


Childhood obesity has been associated with metabolic syndrome and cardiovascular diseases. This study aimed to compare plasma levels of traditional metabolic markers, adipokines and soluble tumor necrosis factor receptor type 1 (sTNFR1) in overweight, obese and lean children. We also assessed the relationships of these molecules with classical metabolic risk factors.
MethodsThis study included 104 children and adolescents, which were grouped as: lean (n=24), overweight (n=30), and obese subjects (n=50). They were subjected to anthropometrical, clinical and laboratorial measurements. All measurements were compared between groups. Correlation analyses were also performed to evaluate the association between clinical data, traditional metabolic markers, adipokines and sTNFR1.
ResultsFasting glucose, insulin, homeostatic model assessment of insulin resistance (HOMA-IR), LDL-cholesterol and triglycerides were comparable in lean, overweight and obese subjects. Plasma levels of sTNFR1 were similar in lean and overweight subjects, but significantly increased in obese group. Leptin, adiponectin and resistin levels did not differ when overweight were compared to obese subjects. However, all adipokines differed significantly when lean subjects were compared to overweight and obese individuals. Plasma levels of adiponectin were negatively correlated with body mass index (BMI), whereas leptin, resistin and sTNFR1 concentrations positively correlated with BMI.
ConclusionOur results showed significant differences in circulating levels of the evaluated markers when lean, overweight and obese individuals were compared, suggesting that these biomarkers may change from lean to overweight and from overweight to obesity.
A obesidade na infância tem sido associada à síndrome metabólica e a doenças cardiovasculares. O objetivo deste estudo foi comparar níveis plasmáticos de marcadores metabólicos tradicionais, adipocinas e do receptor solúvel de fator de necrose tumoral tipo 1 (sTNFR1) em crianças com sobrepeso, obesas e magras. Também avaliamos as relações dessas moléculas com fatores de risco metabólico clássicos.
MétodosEste estudo incluiu 104 crianças e adolescentes, agrupados da seguinte forma: indivíduos magros (n=24), com sobrepeso (n=30) e obesos (n=50). Eles foram submetidos a medições antropométricas, clínicas e laboratoriais. Todas as medições foram comparadas entre os grupos. Também foram realizadas análises de correlação para avaliar a associação entre dados clínicos, marcadores metabólicos tradicionais, adipocinas e sTNFR1.
ResultadosGlicemia de jejum, insulina, modelo de avaliação da homeostase da resistência à insulina (HOMA-IR), colesterol LDL e triglicerídeos foram comparáveis em indivíduos magros, com sobrepeso e obesos. Os níveis plasmáticos de sTNFR1 foram similares em indivíduos magros e com sobrepeso, porém significativamente maiores no grupo obeso. Os níveis de leptina, adiponectina e resistina não diferiram quando indivíduos com sobrepeso foram comparados aos obesos. Contudo, todas as adipocinas diferiram significativamente quando indivíduos magros foram comparados a indivíduos com sobrepeso e obesos. Os níveis plasmáticos de adiponectina estavam negativamente correlacionados ao índice de massa corporal (IMC), ao passo que as concentrações de leptina, resistina e sTNFR1 estavam positivamente correlacionadas ao IMC.
ConclusãoNossos resultados mostraram diferenças significativas nos níveis circulantes dos marcadores avaliados ao comparar indivíduos magros, com sobrepeso e obesos, sugerindo que esses biomarcadores poderão mudar de indivíduos magros para indivíduos com sobrepeso e de indivíduos com sobrepeso para obesos.
Childhood obesity is increasing in prevalence and is strongly associated with obesity in adulthood.1,2 Obese children are at risk of metabolic syndrome, cardiovascular diseases, and increased adult morbidity and mortality.3,4
Adipokines are hormones secreted by adipose tissue that play a role in metabolic homeostasis.5 Obesity also induces production of inflammatory cytokines and infiltration of immune cells into adipose tissue, determining a state of chronic low-grade inflammation. Metabolic inflammation has been recognized as a unifying mechanism linking obesity to a broad spectrum of conditions, such as atherosclerosis, type 2 diabetes, and systemic vascular complications.5–7
The current study analyzed plasma levels of adipokines (adiponectin, resistin, and leptin), and soluble tumor necrosis factor receptor type 1 (sTNFR1), insulin sensitivity, and lipid metabolism in overweight and obese children and adolescents in comparison with lean individuals. The authors also assessed the relationships of these molecules with classical metabolic risk factors. Circulating levels of sTNFR1 are regarded as inflammatory markers, reflecting TNF-α activity better than the measurement of TNF-α itself.5–9 It was hypothesized that adipokines, low-grade inflammation, insulin sensitivity, and lipid metabolism gradually change from lean to overweight and from overweight to obesity.
MethodsSubjectsThis cross sectional study had a convenience sample of 104 children and adolescents, aged 6–18 years old. All individuals who fulfilled the inclusion criteria and accepted taking part in the study were recruited from the Pediatric Endocrinology Service and the Pediatric Primary Care Center of the institution for two years. Therefore, 50 obese, 30 overweight, and 24 lean individuals were evaluated.
Inclusion criteriaThe criterion for obesity was body mass index (BMI) greater than the 95th percentile for age and sex according to the National Center for Health Statistics (NCHS) standards.10 Overweight was defined as BMI percentiles for age and sex of >85th and <95th. The lean group included subjects with BMI percentiles >10th and <85th for age and sex.
Exclusion criteriaSubjects with genetic disorders, secondary obesity, and comorbidities such as diabetes, cardiac, pulmonary and neurological diseases, or acute infections were excluded. Subjects receiving medical therapy were also ineligible. Health status was determined through medical history and either parental report or self-report to rule out chronic or acute diseases.
Study protocolAt admission, all subjects underwent clinical examination including weight, height, BMI, blood pressure, abdominal circumference (AC), and pubertal stage evaluation. Weight was obtained to the nearest 0.1kg using calibrated digital scales. Standing height was considered as the average of three measures, in the nearest millimeter, using a fixed stadiometer. AC was obtained with tape measure at just above the uppermost lateral border of the right ileum, at the end of a normal expiration, and was recorded to the nearest millimeter, as recommended by the NCHS.11 Pubertal stage was determined according to Tanner criteria,12 and the patients were classified: (i) pre-pubertal: boys at genital stage I, girls at breast stage I; (ii) early-puberty boys at genital stage II–III, girls at breast stage II–III; (iii) late/post pubertal: boys at genital stage ≥IV, girls at breast stage ≥IV. Systolic and diastolic blood pressures were measured on three different occasions, in the right arm, after a 10-min rest in the supine position using a calibrated sphygmomanometer, and the two values were averaged. Blood pressure measurements were also evaluated following the recommendations of the Fourth Task Force Report.13
Blood samplingAfter informed consent, all subjects were submitted to blood collection for the measurement of fasting glucose, insulin, total cholesterol, high-density lipoprotein (HDL) cholesterol, low-density lipoprotein (LDL) cholesterol, very low-density lipoprotein (VLDL) cholesterol, triglycerides, adiponectin, leptin, resistin, and sTNFR1. Blood sampling occurred at one occasion after an overnight fast of 12h through peripheral venous puncture. One sample was taken for fasting glucose, insulin, total cholesterol, HDL-cholesterol, LDL-cholesterol, and triglycerides measurements, according to standard recommendations. The second sample was for adiponectin, leptin, resistin, and sTNFR1 measurements. For these measurements, samples were immediately immersed in ice, and processed within 30min after collection. Cells were centrifuged at 700×g for 10min at 4°C; then supernatant plasma was collected and re-spun for another 20min at 1300×g to sediment the platelets. Cell-free plasma was aliquoted into 0.5mL samples and stored at −80°C until measurements.
MeasurementsFasting glucose, cholesterol, and triglycerides levels were determined by enzymatic colorimetric assay (Advia Chemistry®; Siemens®; LA, USA), while insulin was measured by chemiluminescence (reference value: <29μIU/mL; (Immulite® 2000, LA, USA). The insulin resistance was estimated by the homeostasis model assessment for insulin resistance (HOMA-IR).14 Plasma levels of adiponectin, leptin, resistin, and sTNFR1 were measured by specific ELISA kits (R&D Systems®, Minneapolis, USA), following the manufacturer's instructions. All samples were assayed in duplicate during a single assay to avoid inter-assay variation. The intra-assay variation was below 3%. The detection limits were 5pg/mL for adiponectin, resistin, and leptin; 10pg/mL for sTNFR1.
Statistical analysisStatistical analyses were performed using SPSS software version 19.0 (SPSS Inc, Chicago, USA). Sample size was estimated as at least a total of 96 individuals, considering a power of 0.80 (1−β), a difference of 20% between groups, a significance (α) level of 0.05, and a standard deviation no greater than 25%. All variables were tested for normality of distribution by the Shapiro–Wilk test. Association between dichotomous variables was assessed by chi-squared or Fisher's exact test. Differences among groups were compared using the Kruskal–Wallis test with Dunn's multiple comparison post-test. Spearmann's correlation analyses were performed to examine the relationship between adipokines, sTNFR1 levels, and age, BMI, glucose, insulin, HOMA-IR, HDL-cholesterol, LDL-cholesterol, and triglycerides. The significance level was set at p<0.05.
Ethical issuesThe Ethics Committee of the institution approved the study according to the protocol ETIC 0415/06. Informed consent was obtained from subjects and their parents. The research protocol did not interfere with any medical prescriptions and follow-up was guaranteed even in cases of refusal to participate in the study.
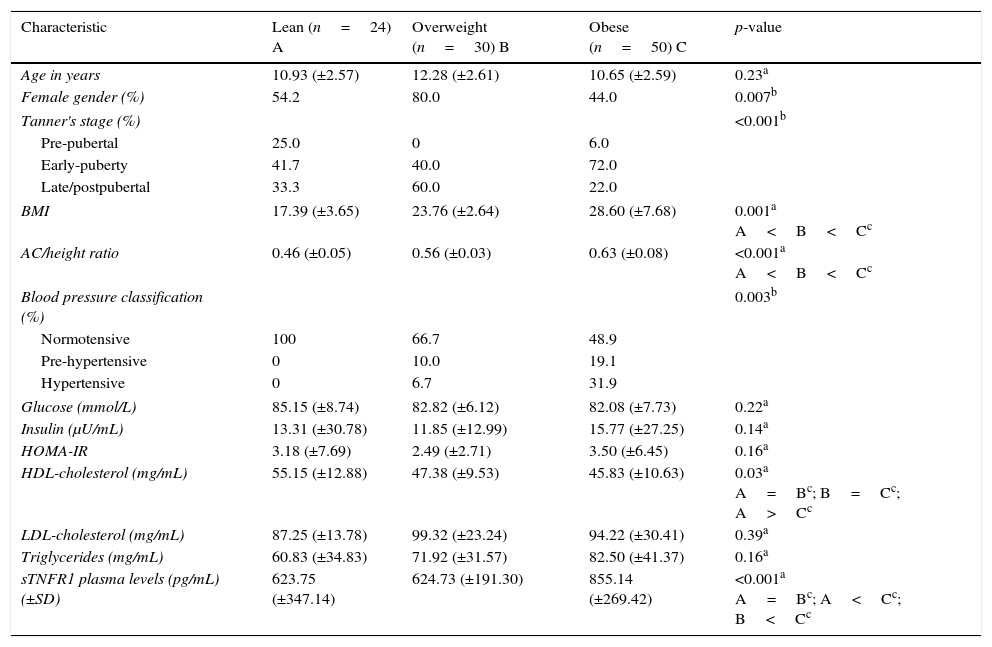
ResultsAnthropometrical, clinical, and laboratorial characteristics in obese, overweight, and lean groupsSubjects were allocated into three groups: lean (n=24, 54.2% female), overweight (n=30, 80% female), and obese subjects (n=50, 44% female). Anthropometrical, clinical, and laboratorial characteristics are displayed in Table 1. Lean and obese subjects were comparable regarding age and gender distribution. There was an increased frequency of females in the overweight group in comparison with obese subjects (p=0.02). In the univariate analysis, the groups differed according to Tanner stage, BMI, AC/height, blood pressure classification, and HDL cholesterol levels (p<0.05, Table 1). The obese group had significantly higher BMI, AC/height ratio, and prevalence of hypertension than lean and overweight subjects. HDL cholesterol levels were significantly lower in both the obese and overweight groups than in lean individuals. However, fasting glucose, insulin, HOMA-IR, LDL cholesterol, and triglycerides were comparable in lean, overweight, and obese subjects (p>0.05, Table 1).
Clinical and laboratory characteristics (mean±SD) for lean, overweight, and obese subjects.
| Characteristic | Lean (n=24) A | Overweight (n=30) B | Obese (n=50) C | p-value |
|---|---|---|---|---|
| Age in years | 10.93 (±2.57) | 12.28 (±2.61) | 10.65 (±2.59) | 0.23a |
| Female gender (%) | 54.2 | 80.0 | 44.0 | 0.007b |
| Tanner's stage (%) | <0.001b | |||
| Pre-pubertal | 25.0 | 0 | 6.0 | |
| Early-puberty | 41.7 | 40.0 | 72.0 | |
| Late/postpubertal | 33.3 | 60.0 | 22.0 | |
| BMI | 17.39 (±3.65) | 23.76 (±2.64) | 28.60 (±7.68) | 0.001a A<B<Cc |
| AC/height ratio | 0.46 (±0.05) | 0.56 (±0.03) | 0.63 (±0.08) | <0.001a A<B<Cc |
| Blood pressure classification (%) | 0.003b | |||
| Normotensive | 100 | 66.7 | 48.9 | |
| Pre-hypertensive | 0 | 10.0 | 19.1 | |
| Hypertensive | 0 | 6.7 | 31.9 | |
| Glucose (mmol/L) | 85.15 (±8.74) | 82.82 (±6.12) | 82.08 (±7.73) | 0.22a |
| Insulin (μU/mL) | 13.31 (±30.78) | 11.85 (±12.99) | 15.77 (±27.25) | 0.14a |
| HOMA-IR | 3.18 (±7.69) | 2.49 (±2.71) | 3.50 (±6.45) | 0.16a |
| HDL-cholesterol (mg/mL) | 55.15 (±12.88) | 47.38 (±9.53) | 45.83 (±10.63) | 0.03a A=Bc; B=Cc; A>Cc |
| LDL-cholesterol (mg/mL) | 87.25 (±13.78) | 99.32 (±23.24) | 94.22 (±30.41) | 0.39a |
| Triglycerides (mg/mL) | 60.83 (±34.83) | 71.92 (±31.57) | 82.50 (±41.37) | 0.16a |
| sTNFR1 plasma levels (pg/mL) (±SD) | 623.75 (±347.14) | 624.73 (±191.30) | 855.14 (±269.42) | <0.001a A=Bc; A<Cc; B<Cc |
BMI, body mass index; HDL, high-density lipoprotein; HOMA-IR, homeostasis model assessment for insulin resistance; LDL, low-density lipoprotein; SD, standard deviation; sTNFR, soluble tumor necrosis factor.
As also shown in Table 1, plasma levels of sTNFR1 were similar in lean and overweight subjects (p>0.05), but were significantly increased in obese subjects (p<0.01 overweight vs. obese and p<0.001 lean vs. obese).
Fig. 1 shows plasma levels of adiponectin, resistin, and leptin in obese, overweight, and lean subjects. Adipokines did not differ when overweight were compared to obese subjects (Fig. 1). Adiponectin levels (pg/mL) were decreased in overweight and obese subjects in comparison with lean subjects (5199.18 in lean subjects; 4537.57 in the overweight group; 3467.57 in the obese group [p<0.001 overweight vs. lean and p<0.001 obese vs. lean, Fig. 1]). Plasma levels of resistin (pg/mL) were increased in the overweight and obese groups in comparison with lean subjects (1140.38 in the lean group; 1788.51 in the overweight group; 2256.39 in the obese group [p<0.001 overweight vs. lean and p<0.001 obese vs. lean, Fig. 1]). The same profile was detected for leptin levels (702.54pg/mL in the lean group; 1933.04pg/mL in the overweight group; 1965.91pg/mL in the obese group [p<0.001 overweight vs. lean and p<0.001 obese vs. lean, Fig. 1]).
 in lean (n=24), overweight (n=30), and obese subjects (n=50). * p<0.01 (Kruskal–Walis, Dunn")
In order to evaluate gender influence, this study also compared plasma levels of adipokines in males vs. females for each group (lean, overweight, and obese subjects), as shown in Fig. 2. In the lean group, males presented higher levels of adiponectin (5642.81 vs. 4983.64pg/mL in females, p=0.005) and lower concentrations of leptin than females (371.79pg/mL in males vs. 1391.26pg/mL in females, p<0.001). No other marker differed when comparing males and females. No differences were detected in leptin, resistin, and adiponectin levels for the comparisons between male and females in overweight and obese groups (Fig. 2).
 in lean (n=24), overweight (n=30), and obese subjects (n=50). A, adiponectin; B, leptin; C, resistin. * p<0.01. ** p<0.001 Mann–Whitney test.")
To investigate a potential interference of Tanner's stage, the levels of adipokines in pre-pubertal vs. early puberty vs. late puberty were compared for each group (lean, overweight, and obese individuals). No differences were detected in resistin and adiponectin levels for the comparisons between Tanner's stages classification in all groups. Leptin levels exhibited a mild increase according to the progression of Tanner's stage only in the obese group (data not shown).
Correlation analysisConsidering all subjects (n=104), plasma levels of adiponectin were negatively correlated with BMI (p<0.001; ρ=−0.402), insulin (p=0.02; ρ=−0.247), HOMA-IR (p=0.02; ρ=−0.263), and triglycerides (p=0.02; ρ=−0.261). Leptin levels were positively correlated with age (p<0.001; ρ=0.425), BMI (p<0.001; ρ=0.577), insulin (p<0.001; ρ=0.500), HOMA-IR (p<0.001; ρ=0.497), triglycerides (p=0.003; ρ=0.325), and negatively correlated with HDL-cholesterol (p=0.03; ρ=−0.240). Resistin concentrations were positively correlated with BMI (p<0.001; ρ=0.469), and negatively correlated with HDL-cholesterol (p=0.02; ρ=−0.247). Plasma levels of sTNFR1 were positively correlated with BMI (p<0.001; ρ=0.338) and negatively correlated with adiponectin levels (p=0.03; p=−0.212).
DiscussionThis study showed that circulating levels of adipokines discriminated lean from overweight/obese subjects. Overweight and obese individuals presented similar levels of all the evaluated adipokines. Remarkably, adiponectin levels were decreased while leptin and resistin levels were increased in overweight and obese groups in comparison with lean controls. Traditional metabolic parameters were similar in all groups, while sTNFR1 levels were increased in the obese in comparison with the overweight and lean groups.
Fasting plasma glucose, insulin, HOMA-IR, LDL cholesterol, and triglycerides are traditionally used to assess metabolic and cardiovascular risks in obesity,15 and their mean values were comparable among lean, overweight, and obese groups in the present study. On the other hand, sTNFR1 levels were higher in obese individuals than in the lean or overweight groups. Increased levels of sTNFR1 support the general idea of a low-grade inflammatory state in obesity.5,8,9 Furthermore, adipokines were significantly altered in subjects with overweight and obesity in comparison with lean individuals, suggesting that adipokines might be early markers of changing from lean to overweight/obesity status, even before the occurrence of metabolic alterations. Similarly, other studies have shown that serum levels of leptin and resistin were significantly higher in obese children than in lean children.16–18 In addition, BMI positively correlated with leptin and resistin, and negatively with adiponectin levels, as previously described.17–20 In contrast, another study reported similar levels of resistin in obese and lean subjects.21 Nevertheless, when obese children were stratified by insulin resistance values, obese children with insulin resistance had higher resistin levels than children with normal weight or obese children without insulin resistance.21 Corroborating the present data, Adamska et al. reported increased levels of sTNFR1 and reduced levels of adiponectin in overweight and obese adults compared with lean subjects.9 On the other hand, the relation between sTNFR and BMI is controversial. Whereas there was also positive correlation between BMI and sTNFR1 in the present sample, Huang et al. did not detect any association.18 No significant correlation was previously observed among sTNFRs and lipid profile,18,22 while, in the present study, sTNFR1 was negatively correlated with HDL-cholesterol.
There is a paucity of data on the role of adipokines in the transition from lean to overweight and from overweight to obesity, especially in pediatric patients without metabolic syndrome or comorbidities. In comparison with the control group, it was found that circulating levels of adipokines are already changed in overweight subjects, who present a similar profile to the obese group. Similarly, Ko et al. have shown that leptin levels were associated with increased risk of children being overweight.17 Leptin is critical for metabolic regulation by signaling nutritional status to the hypothalamus, which, in turn, produces neuropeptides and neurotransmitters to modulate food intake and energy expenditure.5,23 Leptin levels positively correlated with insulin, HOMA-IR, and triglycerides; they negatively correlated with HDL cholesterol.17 Johnson et al. found a significant association between leptin levels and increasing fat mass in children.24 Two possible explanations are that resistance to leptin actions at the receptor level might contribute to overweight and that homeostatic alterations precede the occurrence of obesity.25,26
In the present study, plasma levels of adiponectin negatively correlated with insulin, HOMA-IR, and triglycerides, while leptin concentrations were positively correlated with the same metabolic parameters. Adamska and co-workers showed that insulin sensitivity positively correlated to adiponectin and negatively correlated to sTNFR1 and sTNFR2 levels in obese adults. Soluble TNF receptors and adiponectin also negatively correlated with insulin sensitivity, and these markers have multiple effects on glucose and lipid metabolism in obesity.9 Plasma levels of adiponectin negatively correlated with insulin, HOMA-IR, and triglycerides21,27 and positively correlated with insulin sensitivity.9 The present results also showed a negative correlation between sTNFR1 and adiponectin levels, supporting the general idea that increased concentrations of adiponectin may compensate low-grade inflammation. Indeed, adiponectin has anti-inflammatory effects that contribute to its protective role against metabolic stress in obesity.5,28 In this context, increased concentrations of adiponectin may be related to better metabolic profile despite the greater fat mass. However, the majority of studies included obese adults already exhibiting significant changes in metabolic parameters, while the present sample only had pediatric individuals without co-morbidities or metabolic syndrome. Therefore, reduction of adiponectin levels seems to occur later than changes in leptin concentrations, but may come before metabolic alterations in pediatric obesity.
Circulating levels of resistin have also been positively associated with body fat mass.29,30 Accordingly, a study with Mexican children and adolescents found negative correlation between resistin and HDL-cholesterol levels.18 Studies have also associated high resistin levels with increased risk for metabolic and cardiovascular diseases.5 Similarly to adiponectin, the elevation of resistin levels probably precedes co-morbidities related to obesity in pediatric patients.
The authors are aware of the limitations of this study. First, the cross sectional design precludes the evaluation of interactions among variables. Second, the sample was relatively small, mostly considering overweight and lean subjects. Third, the use of a convenience sample makes homogeneity among the selected groups very difficult to obtain, since differences in gender and Tanner's stage may change adipokine levels. However, no differences were detected in resistin and adiponectin levels for the comparisons between male and females and between Tanner's stage in the overweight and obese groups. Leptin levels only exhibited a mild elevation according to Tanner's stage in obese group. Nevertheless, other aspects increase the strength of the findings, such as strict inclusion and exclusion criteria, well-established protocol for measurements, and a representative number of obese individuals.
In conclusion, the findings suggest that changes in plasma levels of adipokines (leptin, resistin, and adiponectin) may come before alterations in traditional metabolic markers of obesity in pediatric patients. Longitudinal studies with larger samples are necessary to elucidate how adipokines interact with clinical, metabolic, and inflammatory markers in pediatric obesity.
FundingThis work was supported by grants from the Research Foundation of the State of Minas Gerais (FAPEMIG) and from the National Council of Scientific and Technological Development (CNPq).
Conflicts of interestThe authors declare no conflicts of interest.
Please cite this article as: Mantovani RM, Rocha NP, Magalhães DM, Barbosa IG, Teixeira AL, Simões e Silva AC. Early changes in adipokines from overweight to obesity in children and adolescents. J Pediatr (Rio J). 2016;92:624–30.


