
To analyze calcium intake in adolescents according to sociodemographic variables, health-related behaviors, morbidities, and body mass index.
MethodsThis was a cross-sectional population-based study, with a two-stage cluster sampling that used data from a survey conducted in Campinas, São Paulo, Brazil, between 2008 and 2009. Food intake was assessed using a 24-hour dietary recall. The study included 913 adolescents aged 10–19 years.
ResultsAverage nutrient intake was significantly lower in the segment with lower education of the head of the family and lower per capita family income, in individuals from other cities or states, those who consumed fruit less than four times a week, those who did not drink milk daily, those who were smokers, and those who reported the occurrence of headaches and dizziness. Higher mean calcium intake was found in individuals that slept less than seven hours a day. The prevalence of calcium intake below the recommendation was 88.6% (95% CI: 85.4–91.2).
ConclusionThe results alert to an insufficient calcium intake and suggest that certain subgroups of adolescents need specific strategies to increase the intake of this nutrient.
Analisar a ingestão de cálcio em adolescentes segundo variáveis sociodemográficas, de comportamentos relacionados à saúde, morbidades e índice de massa corporal.
MétodosTrata-se de estudo transversal de base populacional, com amostra por conglomerados, tomada em dois estágios e que utilizou dados de inquérito realizado em Campinas, São Paulo, Brasil, em 2008/09. O consumo alimentar foi estimado pelo Recordatório de 24 horas. Foram analisados 913 adolescentes de 10 a 19 anos.
ResultadosMédias significativamente inferiores de ingestão do nutriente foram verificadas nos segmentos de menor escolaridade do chefe da família, de menor renda familiar per capita, nos naturais de outros municípios ou Estados, nos que consomem frutas menos que quatro vezes na semana, nos que não bebem leite diariamente, nos fumantes e nos que referiram presença de dor de cabeça e tontura. Média superior de ingestão de cálcio foi encontrada nos indivíduos que dormem menos de sete horas por dia. A prevalência de ingestão de cálcio inferior ao recomendado foi de 88,6% (IC95%: 85,4-91,2).
ConclusõesOs resultados deste estudo alertam para o consumo insuficiente de cálcio e sugerem que determinados subgrupos de adolescentes necessitam de estratégias mais específicas para aumentar a ingestão deste nutriente.
Calcium is an essential nutrient for maintaining bone health, as it contributes to bone mineralization and rigidity, thus preventing problems such as osteoporosis and fractures in adulthood and old age.1,2 It also participates in fibrin formation during the blood coagulation process and regulation of muscle contraction, since the protein troponin, a regulator of actin and myosin contractility, depends on calcium.3
Adequate calcium intake is essential for the development and maintenance of bone mass peak during adolescence.1,2 From birth to adulthood, bone mass increases 40 times, and the peak is reached at the end of the second decade of life.2 Between 40% and 60% of bone mass increase occurs during adolescence.2
The nutritional recommendation of calcium intake for children and adolescents aged 9–18 years is of 1100mg/day, according to the estimated average requirements (EAR), which should not exceed the tolerable upper intake level of 3000mg/day.4 According to the 2008–2009 Household Budget Survey (Pesquisa de Orçamentos Familiares [POF]), the highest mean values of calcium intake were 565.7mg in boys aged 14–18 years and 521.7mg in girls aged 10–13 years.5
Dairy products, dark green vegetables, certain types of fish, and nuts are important dietary sources of this mineral.6 Brazilian research has shown that the dietary patterns of adolescents is characterized by low consumption of certain foods, such as milk and other dairy products, fruit, and vegetables, and by the increased intake of high-calorie foods, saturated fats, sugars, and sodium, such as sugary drinks, sweets, and cookies.7–10 This dietary pattern may be harming the consumption of calcium-rich foods.
Considering the importance of the nutrient intake for good health and the results of studies that evidence a severely inadequate calcium intake by adolescents, this study aimed to evaluate the epidemiological profile of calcium intake in adolescents in the city of Campinas, state of São Paulo, Brazil, and to identify which segments are more susceptible to calcium intake deficiency, according to demographic and socioeconomic variables, health-related behaviors, morbidities, and body mass index (BMI).
MethodsThis was a cross-sectional population-based study that included 929 non-institutionalized adolescents aged 10–19 years, living in the urban area of the city of Campinas. The study data were obtained from the Campinas Health Survey (Inquérito de Saúde no município de Campinas – ISACamp 2008/09), carried out between February of 2008 and March of 2009.
The study sample was determined by probabilistic sampling procedures by clusters, and in two stages: census sectors and households. In the first stage, 50 census sectors were selected by drawing lots, with probability proportional to size (number of households). In the second stage, the households were selected by drawing lots.
The sample size was calculated considering the estimated prevalence of 50% (corresponding to the maximum variability), with a confidence level of 95%, sampling error between 4% and 5%, and a second design effect, totaling 1000 adolescents (10–19 years). Expecting 20% of non-response, the sample size was corrected to 1250. To achieve this number of individuals, 2150 households were randomly selected for interviews with the adolescents.
Information was collected through a questionnaire structured in thematic blocks that were tested in a pilot study and applied by trained and supervised interviewers. Dietary intake was estimated using the 24-hour food recall (24HR). During the fieldwork, the content of 24HR was checked to identify and resolve the incorrect filling out of forms.
A 24HR quantification was performed to convert the amounts of foods or preparations mentioned in household measures into grams or milliliters. For this purpose, the authors used information available in household measure tables,11,12 food labels, and customer care services. The intake information was inserted into the Nutrition Data System for Research software database (NDS-R, version 2007, University of Minnesota, USA). The analyses excluded adolescents with caloric intake lower than 600kcal/day and greater than 6000kcal/day.13
Study variablesDependent variable: mean calcium intake (mg/day)The prevalence of inadequate nutrient intake was estimated using the EAR as the cutoff point, which corresponds to 1100mg and 800mg for adolescents aged 10–18 years and 19 years, respectively.4
The following sets of independent variables were selected:
- •
Demographic and socioeconomic information: gender, age (years), ethnicity/skin color (self-reported), number of household members, place of birth, educational level of the head of the family (years), employment, private health insurance, school attendance by the adolescent, number of appliances in the household, and per capita family income (in Brazilian minimum wages).
- •
Health-related behaviors: smoking, frequency of weekly consumption of alcohol, fruit, raw vegetables, and milk obtained by the food frequency questionnaire; physical activity in the context of leisure, categorized as: active (adolescents who practiced at least 150minutes a week, distributed in at least three days), insufficiently active (those who practiced less than 150minutes a week or more, but in fewer than three days a week) and sedentary (those who did not practice any kind of leisure physical activity on any day of the week)14; and number of hours/day intended for sleep and computer use.
- •
Morbidities and BMI: presence of headache/migraine, dizziness, number of chronic diseases, and number of health complaints among those included in the checklist. BMI was calculated from the self-reported weight and height information. The cutoffs recommended for adolescents15 were used, with the following classifications: underweight, normal weight, overweight, and obese.
For the study analyses, the mean calcium intake was calculated according to the categories of the independent variables. The means and 95% confidence intervals were estimated using single and multiple generalized linear regression models (GLM). The selection of variables for the model adjustment was performed in two stages. In the first stage, the demographic and socioeconomic variables that showed a significance level <0.20 in the bivariate analysis were entered, and those with p<0.05 remained in the model. In the second stage, the health-related behavior and morbidity variables that had p<0.20 in the bivariate analysis were added to the model and those that remained at the 5% significance level were maintained. The model was adjusted for total caloric intake, as recommended by Willett et al.16
The GLM allows for the assumption of distributions other than the normal for the response variable, and provides greater flexibility for the functional association between the mean of the response variable and the linear predictor. Distributions modeled by GLM belong to the exponential family, including distributions for both continuous and mild response variables.17 The graphical analysis and statistical hypothesis testing demonstrated that the gamma distribution was appropriate to model the calcium intake.
The interviews were entered into the database developed using Epidata 3.1 (Epidata Assoc., Odense, Denmark) and the statistical analyses were performed using Stata 11.0 (Stata Corp., College Station, USA), svy module, which takes into account the weights and the study sampling design.
The present study was approved by the Research Ethics Committee of Universidade Estadual de Campinas and the National Research Ethics Committee, under CAAE No. 37303414.4.0000.5404. For adolescents younger than 18 years, the consent form was signed by their parents or guardians.
ResultsOf the total of 929 interviews, five were excluded due to refusal in filling out the 24HR and 11 for having a daily caloric intake <600kcal or >6000kcal. Therefore, 913 adolescents were assessed, with a mean age of 14.1 years (95% CI: 13.8–14.4).
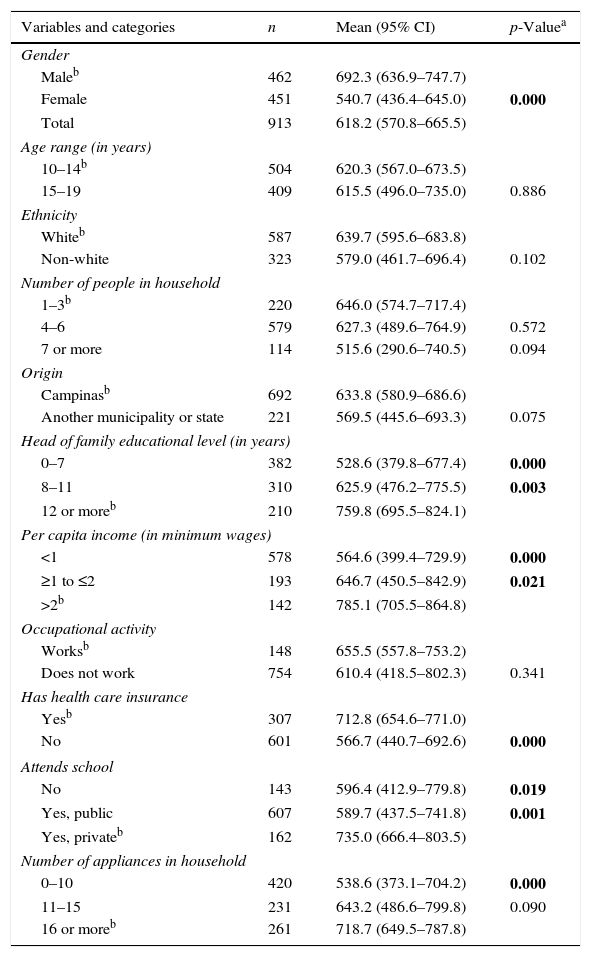
Calcium intake was significantly lower in girls, in adolescents belonging to the lower per capita income strata, and in those whose head of the family had lower educational level, those without private health insurance, and those who had fewer household appliances in the residence. Compared to adolescents from private schools, those who did not attend school or who attended public schools had lower mean calcium intake (Table 1).
Mean calcium intake (mg) in adolescents aged 10–19 years, according to sociodemographic variables. Campinas Health Survey (Inquérito de Saúde de Campinas [ISACamp]), 2008/09.
| Variables and categories | n | Mean (95% CI) | p-Valuea |
|---|---|---|---|
| Gender | |||
| Maleb | 462 | 692.3 (636.9–747.7) | |
| Female | 451 | 540.7 (436.4–645.0) | 0.000 |
| Total | 913 | 618.2 (570.8–665.5) | |
| Age range (in years) | |||
| 10–14b | 504 | 620.3 (567.0–673.5) | |
| 15–19 | 409 | 615.5 (496.0–735.0) | 0.886 |
| Ethnicity | |||
| Whiteb | 587 | 639.7 (595.6–683.8) | |
| Non-white | 323 | 579.0 (461.7–696.4) | 0.102 |
| Number of people in household | |||
| 1–3b | 220 | 646.0 (574.7–717.4) | |
| 4–6 | 579 | 627.3 (489.6–764.9) | 0.572 |
| 7 or more | 114 | 515.6 (290.6–740.5) | 0.094 |
| Origin | |||
| Campinasb | 692 | 633.8 (580.9–686.6) | |
| Another municipality or state | 221 | 569.5 (445.6–693.3) | 0.075 |
| Head of family educational level (in years) | |||
| 0–7 | 382 | 528.6 (379.8–677.4) | 0.000 |
| 8–11 | 310 | 625.9 (476.2–775.5) | 0.003 |
| 12 or moreb | 210 | 759.8 (695.5–824.1) | |
| Per capita income (in minimum wages) | |||
| <1 | 578 | 564.6 (399.4–729.9) | 0.000 |
| ≥1 to ≤2 | 193 | 646.7 (450.5–842.9) | 0.021 |
| >2b | 142 | 785.1 (705.5–864.8) | |
| Occupational activity | |||
| Worksb | 148 | 655.5 (557.8–753.2) | |
| Does not work | 754 | 610.4 (418.5–802.3) | 0.341 |
| Has health care insurance | |||
| Yesb | 307 | 712.8 (654.6–771.0) | |
| No | 601 | 566.7 (440.7–692.6) | 0.000 |
| Attends school | |||
| No | 143 | 596.4 (412.9–779.8) | 0.019 |
| Yes, public | 607 | 589.7 (437.5–741.8) | 0.001 |
| Yes, privateb | 162 | 735.0 (666.4–803.5) | |
| Number of appliances in household | |||
| 0–10 | 420 | 538.6 (373.1–704.2) | 0.000 |
| 11–15 | 231 | 643.2 (486.6–799.8) | 0.090 |
| 16 or moreb | 261 | 718.7 (649.5–787.8) | |
n, number of individuals in the unweighted sample.
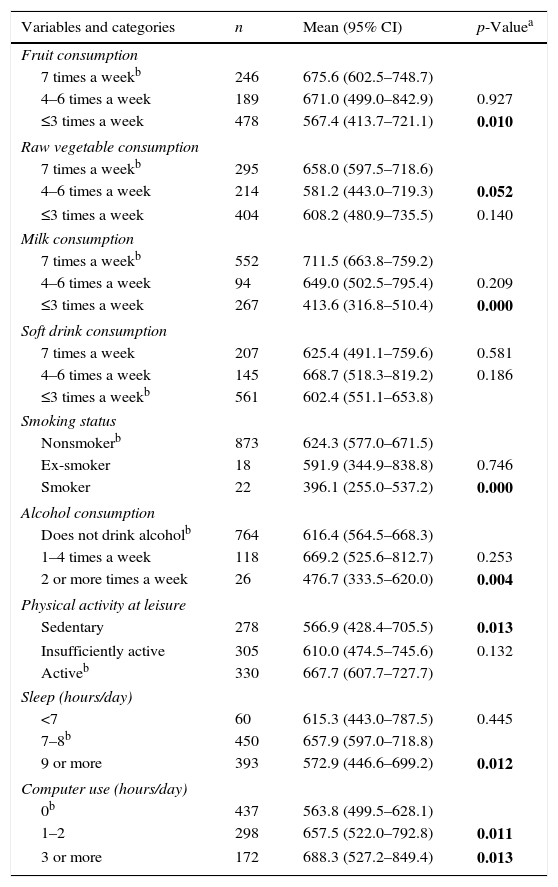
Table 2 shows that individuals who consumed fruit and milk less than four times a week had a lower intake of the nutrient, which was also significantly lower among those who did not consume raw vegetables daily, in smokers, those who consumed alcohol two or more times a week, those who reported nine or more hours of sleep, and those who did not use a computer.
Mean calcium intake (mg) in adolescents aged 10–19 years, according to variables of health-related behaviors. Campinas Health Survey (Inquérito de Saúde de Campinas [ISACamp]), 2008/09.
| Variables and categories | n | Mean (95% CI) | p-Valuea |
|---|---|---|---|
| Fruit consumption | |||
| 7 times a weekb | 246 | 675.6 (602.5–748.7) | |
| 4–6 times a week | 189 | 671.0 (499.0–842.9) | 0.927 |
| ≤3 times a week | 478 | 567.4 (413.7–721.1) | 0.010 |
| Raw vegetable consumption | |||
| 7 times a weekb | 295 | 658.0 (597.5–718.6) | |
| 4–6 times a week | 214 | 581.2 (443.0–719.3) | 0.052 |
| ≤3 times a week | 404 | 608.2 (480.9–735.5) | 0.140 |
| Milk consumption | |||
| 7 times a weekb | 552 | 711.5 (663.8–759.2) | |
| 4–6 times a week | 94 | 649.0 (502.5–795.4) | 0.209 |
| ≤3 times a week | 267 | 413.6 (316.8–510.4) | 0.000 |
| Soft drink consumption | |||
| 7 times a week | 207 | 625.4 (491.1–759.6) | 0.581 |
| 4–6 times a week | 145 | 668.7 (518.3–819.2) | 0.186 |
| ≤3 times a weekb | 561 | 602.4 (551.1–653.8) | |
| Smoking status | |||
| Nonsmokerb | 873 | 624.3 (577.0–671.5) | |
| Ex-smoker | 18 | 591.9 (344.9–838.8) | 0.746 |
| Smoker | 22 | 396.1 (255.0–537.2) | 0.000 |
| Alcohol consumption | |||
| Does not drink alcoholb | 764 | 616.4 (564.5–668.3) | |
| 1–4 times a week | 118 | 669.2 (525.6–812.7) | 0.253 |
| 2 or more times a week | 26 | 476.7 (333.5–620.0) | 0.004 |
| Physical activity at leisure | |||
| Sedentary | 278 | 566.9 (428.4–705.5) | 0.013 |
| Insufficiently active | 305 | 610.0 (474.5–745.6) | 0.132 |
| Activeb | 330 | 667.7 (607.7–727.7) | |
| Sleep (hours/day) | |||
| <7 | 60 | 615.3 (443.0–787.5) | 0.445 |
| 7–8b | 450 | 657.9 (597.0–718.8) | |
| 9 or more | 393 | 572.9 (446.6–699.2) | 0.012 |
| Computer use (hours/day) | |||
| 0b | 437 | 563.8 (499.5–628.1) | |
| 1–2 | 298 | 657.5 (522.0–792.8) | 0.011 |
| 3 or more | 172 | 688.3 (527.2–849.4) | 0.013 |
n, number of individuals in the unweighted sample.
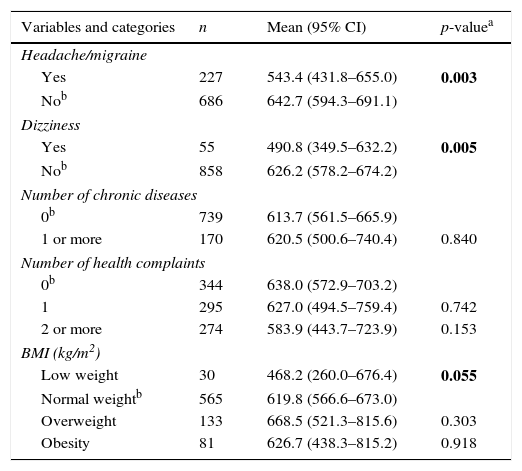
Lower mean calcium intake was found in adolescents who reported the presence of headache and dizziness (Table 3).
Mean calcium intake (mg) in adolescents aged 10–19 years, according to morbidities and body mass index (BMI). Campinas Health Survey of Campinas (Inquérito de Saúde de Campinas [ISACamp]), 2008/09.
| Variables and categories | n | Mean (95% CI) | p-valuea |
|---|---|---|---|
| Headache/migraine | |||
| Yes | 227 | 543.4 (431.8–655.0) | 0.003 |
| Nob | 686 | 642.7 (594.3–691.1) | |
| Dizziness | |||
| Yes | 55 | 490.8 (349.5–632.2) | 0.005 |
| Nob | 858 | 626.2 (578.2–674.2) | |
| Number of chronic diseases | |||
| 0b | 739 | 613.7 (561.5–665.9) | |
| 1 or more | 170 | 620.5 (500.6–740.4) | 0.840 |
| Number of health complaints | |||
| 0b | 344 | 638.0 (572.9–703.2) | |
| 1 | 295 | 627.0 (494.5–759.4) | 0.742 |
| 2 or more | 274 | 583.9 (443.7–723.9) | 0.153 |
| BMI (kg/m2) | |||
| Low weight | 30 | 468.2 (260.0–676.4) | 0.055 |
| Normal weightb | 565 | 619.8 (566.6–673.0) | |
| Overweight | 133 | 668.5 (521.3–815.6) | 0.303 |
| Obesity | 81 | 626.7 (438.3–815.2) | 0.918 |
n, number of individuals in the unweighted sample.
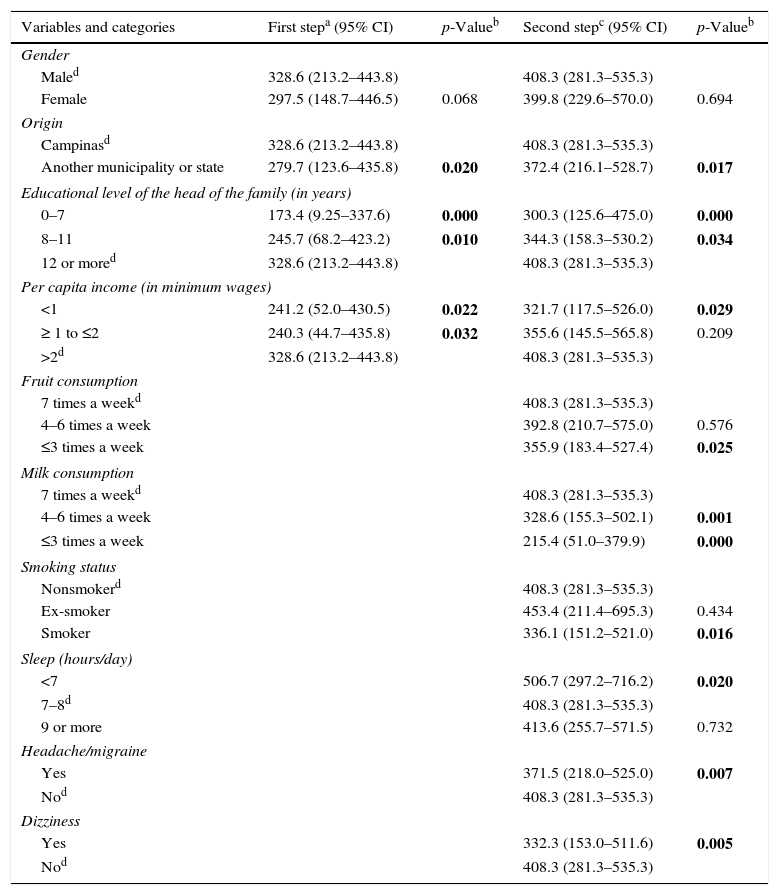
The results in Table 4 indicate a lower mean calcium intake in individuals from other municipalities or states, those with lower educational level of the head of the family, those with a family income below a minimum wage, those who consumed fruit at a lower weekly frequency, those who did not drink milk daily, smokers, and those who reported the presence of headaches and dizziness. Conversely, a higher mean was found in adolescents who slept less than seven hours/day when compared with those who reported between seven and eight hours of sleep.
Two-step generalized linear model. Campinas Health Survey (Inquérito de Saúde de Campinas [ISACamp]), 2008/09.
| Variables and categories | First stepa (95% CI) | p-Valueb | Second stepc (95% CI) | p-Valueb |
|---|---|---|---|---|
| Gender | ||||
| Maled | 328.6 (213.2–443.8) | 408.3 (281.3–535.3) | ||
| Female | 297.5 (148.7–446.5) | 0.068 | 399.8 (229.6–570.0) | 0.694 |
| Origin | ||||
| Campinasd | 328.6 (213.2–443.8) | 408.3 (281.3–535.3) | ||
| Another municipality or state | 279.7 (123.6–435.8) | 0.020 | 372.4 (216.1–528.7) | 0.017 |
| Educational level of the head of the family (in years) | ||||
| 0–7 | 173.4 (9.25–337.6) | 0.000 | 300.3 (125.6–475.0) | 0.000 |
| 8–11 | 245.7 (68.2–423.2) | 0.010 | 344.3 (158.3–530.2) | 0.034 |
| 12 or mored | 328.6 (213.2–443.8) | 408.3 (281.3–535.3) | ||
| Per capita income (in minimum wages) | ||||
| <1 | 241.2 (52.0–430.5) | 0.022 | 321.7 (117.5–526.0) | 0.029 |
| ≥ 1 to ≤2 | 240.3 (44.7–435.8) | 0.032 | 355.6 (145.5–565.8) | 0.209 |
| >2d | 328.6 (213.2–443.8) | 408.3 (281.3–535.3) | ||
| Fruit consumption | ||||
| 7 times a weekd | 408.3 (281.3–535.3) | |||
| 4–6 times a week | 392.8 (210.7–575.0) | 0.576 | ||
| ≤3 times a week | 355.9 (183.4–527.4) | 0.025 | ||
| Milk consumption | ||||
| 7 times a weekd | 408.3 (281.3–535.3) | |||
| 4–6 times a week | 328.6 (155.3–502.1) | 0.001 | ||
| ≤3 times a week | 215.4 (51.0–379.9) | 0.000 | ||
| Smoking status | ||||
| Nonsmokerd | 408.3 (281.3–535.3) | |||
| Ex-smoker | 453.4 (211.4–695.3) | 0.434 | ||
| Smoker | 336.1 (151.2–521.0) | 0.016 | ||
| Sleep (hours/day) | ||||
| <7 | 506.7 (297.2–716.2) | 0.020 | ||
| 7–8d | 408.3 (281.3–535.3) | |||
| 9 or more | 413.6 (255.7–571.5) | 0.732 | ||
| Headache/migraine | ||||
| Yes | 371.5 (218.0–525.0) | 0.007 | ||
| Nod | 408.3 (281.3–535.3) | |||
| Dizziness | ||||
| Yes | 332.3 (153.0–511.6) | 0.005 | ||
| Nod | 408.3 (281.3–535.3) | |||
The prevalence of inadequate calcium intake was 88.6% for the total population (95% CI: 85.4–91.2), reaching 85.1% in boys (95% CI: 80.6–88.7) and 92.2% in girls (95% CI: 89.1–94.5). In the segment with higher educational level of the head of the family (12 years or more), the values corresponded to 79.8% in the group of adolescents (95% CI: 71.1–86.0), 75.9% in males (95% CI: 65.0–84.4) and 84.5% in females (95% CI: 76.0–90.4) (data not shown).
DiscussionThis study identified inadequate calcium intake in adolescents. It was significantly lower in individuals from other municipalities or states, in the strata of lower educational level of the head of the family, in the lowest per capita income segment, in those who consumed fruit less than four times a week, in those who reported not drinking milk daily, in smokers, and in those who reported the presence of headache and dizziness.
The limitations of this study include the application of only one 24HR, which does not reflect the usual intake of adolescents, as it does not detect consumption variability. However, the 24HR is considered an appropriate tool to assess the mean intake of foods and nutrients when applied in population-based samples and on different days of the week and months of the year, as in the ISACamp 2008/09.18 Moreover, the possibility of reverse causality in a cross-sectional study prevents interpreting the results as of cause and effect.
The Dietary Guideline for the Brazilian Population, published in 2014, proposed a comprehensive assessment of diet and its association with health, setting its guidelines based on nutrients, foods, combinations of foods, and preparations.19 The focus of this study was to assess calcium intake, as it is an essential nutrient for the development and maintenance of bone mass throughout life, as well as for the prevention of osteoporosis during childhood and adulthood, and fracture resulting from this condition.2
Among the adolescents, evidence on the low consumption of calcium-rich foods10,20 and on the high intake of sodium20 and soft drinks,8 together with the finding that a significant portion does not meet the recommended levels of physical activity,21 reinforce the need for performing epidemiological research on calcium intake.
In this study, the mean calcium intake was 692.3mg in boys and 540.7mg in girls, higher than the values found in the 2008–2009 POF, which were 565.7mg in boys and 521.7mg in girls aged 10–18 years.5 However, it was lower than the mean obtained in a study of 507 students in the city of Ouro Preto, state of Minas Gerais, which observed a consumption of 730.6mg and 679.4mg in boys and girls, respectively.22
Calcium intake below the EAR was observed in 88.6% of the adolescents in the city of Campinas. Analyzing data from the National Food Survey (Inquérito Nacional de Alimentação [INA]) 2008–2009, Veiga et al.20 found an inadequacy prevalence >95.0% in individuals aged between 10 and 18 years. This result was attributed to a low consumption of dairy products, which are the main food sources of the nutrient, as well as its replacement by soft drinks and other sugary beverages.5,23
In the bivariate analysis, female gender was associated with lower calcium consumption, but it did not remain in the final model, due to the adjustment by caloric consumption (kcal). The caloric intake was significantly lower in girls, being, respectively, in boys was 2715.2kcal (95% CI: 2522.8–2907.6) and 2277.1 (95% CI: 1977.0–2577.1) in girls. Nonetheless, the authors decided to maintain the gender variable to adjust the model.
When compared with adolescents born in Campinas, those from other municipalities or states had lower calcium intake. Regarding individuals aged 10–18 years, the 2008–2009 POF showed changes in mean calcium intake among the major regions of Brazil: the Northeast region presented the lowest values and the Southeast, the highest.5
The findings of this study show a significant increase in calcium intake with the improvement in the educational level of the head of the family. Data from the 2009 National Schoolchildren's Health Survey (Pesquisa Nacional de Saúde do Escolar [PeNSE]) demonstrated a positive association between regular consumption of milk (five days a week or more) with maternal educational level.24 Studies that analyzed the quality of diet in adolescents found a higher intake of dairy products and vegetables in the strata with higher educational level of the head of the family.25,26
Lower calcium intake was observed in individuals who lived in households with a monthly per capita income of less than Brazilian one minimum wage. The PeNSE results showed a low proportion of regular milk consumption in individuals from lower socioeconomic classes.24 Based on the 2008–2009 POF, Levy et al.27 identified an increase in the participation of milk and dairy products in the diet associated with an increase in household income. In Pelotas, researchers assessed 2209 adolescents and observed a significant reduction in the frequency of daily consumption of milk with worsening in the socioeconomic level.7
Fruit consumption less than four times a week was associated with lower calcium intake. A population-based study carried out in São Paulo found that, of the 812 interviewed adolescents, only 6.5% met the minimum daily recommendation of 400g of fruit and vegetables.9 According to data from the 2009 PeNSE, 31.5% (95% CI: 30.8–32.2) of the students reported consuming fresh fruit regularly, with no differences between genders and the administrative location of schools.21 The increase in the consumption of fruit and vegetables is one of the national targets intended to halt the increase of non-communicable chronic diseases, which involves actions aimed at promoting healthy eating in the School Feeding Program, lower prices, and greater supply and production of these foods.28
Individuals who reported drinking milk daily had higher mean levels of the nutrient. Among the participants of PeNSE, 53.6% reported consuming milk five or more days per week.24 Of the 20 foods most often mentioned by the adolescents included in the 2008–2009 POF, the item “juices and artificial juices” was in the sixth position (43.5%), while whole milk was in the 18th (12.9%).29 National data show that, between 1974 and 2003, the household availability of dairy products increased by 36% and of soft drinks, by 400%.23 A cross-sectional study conducted in Canada with 610 children aged 8–10 years observed a decrease in the consumption of sugary drinks with the increased consumption of dairy products, as well as a significant reduction in systolic blood pressure in the segment that had two or more daily servings of dairy products.30
When compared with non-smokers, smokers had lower calcium intake. In a population-based survey with adolescents aged 12–19 years, Bigio et al.9 found a decrease in the consumption of fruit and vegetables among smokers. In a sample of 2375 individuals aged 12 years or more, Andrade et al.31 observed that smokers had a worse overall diet quality, reflected by a lower consumption of fruit and dairy products, and higher consumption of meat and sodium. By observing the association with diet, tobacco control can contribute to the effectiveness of strategies aimed at promoting healthy behaviors, including eating habits.
Adolescents who reported having headaches/migraine and dizziness showed significantly lower calcium intake. To the best of the authors’ knowledge, no study in the literature has analyzed the association between calcium intake and the occurrence of headache or dizziness. Using the same sample assessed in this research, Braz et al.32 found a prevalence of health problems in 61.5% of the sample, and frequent headache/migraine was reported by 24.8% of the adolescents.
A higher calcium intake was observed in individuals that mentioned sleeping less than seven hours a day. Leal et al.10 found that 21.0% of adolescents did not have breakfast and 22.0% did not eat a mid-afternoon snack, meals that usually consist of milk other dairy products. Therefore, the fact that adolescents had longer sleep duration may have contributed to the skipping of breakfast and, consequently, to a lower intake of foods with high calcium content.
A calcium-poor diet was observed concurrently with other unhealthy behaviors, such as smoking and lower frequency of fruit consumption. This result highlights the importance of actions aimed at the group of behaviors that influence the adolescents’ overall health, including the promotion of a healthy diet.
The present study provided population-level information on calcium intake in individuals aged 10–19 years living in the city of Campinas. It was observed that there is a deficiency in the intake of this nutrient in all assessed segments, demonstrating that those in the lower socioeconomic status strata and those with other inappropriate behaviors show even more unfavorable results. These findings suggest that strategies promoting healthy eating habits should take into account the specificities of each population subgroup.
Conflicts of interestThe authors declare no conflicts of interest.
The authors would like to thank Conselho Nacional de Desenvolvimento Científico e Tecnológico (CNPq, process n. 409747/2006-8) for funding this research and for the productivity grants given to M.B.A. Barros and R.M. Fisberg; the Municipal Health Secretariat of Campinas and the Health Surveillance Secretariat of the Ministry of Health, for the financial support to perform the field research of ISACAMP 2008; and CAPES, for the Ph.D. scholarship received by D. Assumpção.
Please cite this article as: de Assumpção D, Dias MR, de Azevedo Barros MB, Fisberg RM, de Azevedo Barros Filho A. Calcium intake by adolescents: a population-based health survey. J Pediatr (Rio J). 2016;92:251–9.


