
To investigate child growth, cognitive/language development, and their environmental and biological determinants.
MethodsThis was a cross-sectional, predictive correlation study with all 92 children aged 24–36 months who attended the municipal early childhood education network in a town in the Vale do Jequitinhonha region, in 2011. The socioeconomic profile was determined using the questionnaire of the Associação Brasileira de Empresas de Pesquisa. The socio-demographicand maternal and child health profiles were created through a self-prepared questionnaire. The height-for-age indicator was selected to represent growth. Cognitive/language development was assessed through the Bayley Scale of Infant and Toddler Development. The quality of educational environments was assessed by Infant/Toddler Environment Scale; the home environment was assessed by the Home Observation for Measurement of the Environment. The neighborhood quality was determined by a self-prepared questionnaire. A multivariate linear regression analysis was performed.
ResultsFamilies were predominantly from socioeconomic class D, with low parental education. The prevalence of stunted growth was 14.1%; cognitive and language development were below average at 28.6% and 28.3%, respectively. Educational institutions were classified as inadequate, and 69.6% of homes were classified as presenting a risk for development. Factors such as access to parks and pharmacies and perceived security received the worst score regarding neighborhood environment. Biological variables showed a greater association with growth and environmental variables with development.
ConclusionThe results showed a high prevalence of stunting and below-average results for cognitive/language development among the participating children. Both environmental and biological factors were related to growth and development. However, biological variables showed a greater association with growth, whereas environmental variables were associated with development.
Investigar o crescimento e desenvolvimento cognitivo/linguagem de crianças e seus determinantes ambientais e biológicos.
MétodoEstudo transversal, correlacional preditivo, com todas as 92 crianças entre 24-36 meses, frequentadoras da rede municipal de educação infantil de uma cidade no Vale do Jequitinhonha, ano 2011. Traçou-se o perfil econômico utilizando-se o questionário da Associação Brasileira de Empresas de Pesquisa. O perfil sociodemográfico e saúde materno-infantil por questionário próprio. Elegeu-se o indicador estatura/idade para representar o crescimento. O desenvolvimento cognitivo/linguagem foi avaliado por meio do Bayley Scale of Infant and Toddler Development. Avaliou-se os ambientes educacionais pelo Infant/Toddler Environment Scale, e o ambiente domiciliar pelo Home Observation for Measurement of the Environment. Aferiu-se a qualidade da vizinhança através de questionário próprio. Foram realizadas análises de regressão linear multivariada.
ResultadosAs famílias eram predominantemente da classe D com baixa escolaridade dos pais. A prevalência de déficit de estatura foi 14,1%; desenvolvimento abaixo da média na linguagem 28,6% e cognitivo 28,3%. As instituições educacionais classificaram-se como inadequadas e 69,6% dos domicílios como de risco para o desenvolvimento. Aspectos como, disponibilidade de praças e farmácias e segurança foram aspectos de pior pontuação no ambiente vizinhança. Variáveis biológicas demonstraram maior associação com o crescimento e variáveis ambientais ao desenvolvimento.
ConclusãoObservou-se elevado déficit de estatura e de resultados abaixo da média para desenvolvimento cognitivo/linguagem entre as crianças participantes. Fatores ambientais e biológicos relacionaram-se tanto ao crescimento quanto ao desenvolvimento. Entretanto, variáveis biológicas demonstraram maior associação com o crescimento e variáveis ambientais com o desenvolvimento.
Over the past few years, Brazil has observed a decrease in childhood mortality rates on account of measures such as immunization coverage, prenatal care, and breastfeeding promotion.1 In this new scenario, healthcare professionals, the government, and researchers have turned their attention to the monitoring of adequate child growth and development.2 Once survival is guaranteed, it is necessary to give all children the opportunity to achieve academic success and reach their full capacities as adults.3
The monitoring of child growth and development is necessary, as deficits in these parameters can have negative effects throughout life. It is estimated that, in countries where the development deficit rates affect more than 20% of their adult population, the national economy may suffer a negative impact.3 Among the negative consequences of short stature in women are losses in reproductive health, survival, and stunting of their children.4,5 For men, low economic productivity has been identified as a result of short stature, originated in childhood.4
Child growth and development are multifactorial constructs,3,6 associated with environmental, socioeconomic, and biological aspects. Studies have either investigated risk factors related to child developmental delay3,7,8 or the risk factors associated with malnutrition.6 It is observed, however, that these constructs are associated and have many determinants in common. Factors associated with poverty, such as restrictions in diet, consumer goods, and services; insufficient psychosocial stimuli; and adverse perinatal conditions have been reported as risk factors for both child growth and development.3,5–7,9–11
However, few studies have proposed to investigate both growth and development concurrently, which would allow for a better understanding of possibly more specific risk factors for each construct, important for the promotion of prevention and intervention strategies for both child malnutrition and developmental delay.2,3,7
Thus, the aim of this study was to investigate the environmental, socioeconomic, and biological risk factors associated with and growth and child development, regarding economically underprivileged children in a town in Vale do Jequitinhonha, a region with low socioeconomic indicators located in southeastern Brazil.1
MethodsThis was a cross-sectional, predictive correlation study, approved by the Research Ethics Committee of Universidade Federal de Minas Gerais (585/2010).
The study consisted of children aged 24–36 months with normal development, i.e., no congenital or acquired disabilities. Additionally, they had to be attending, for at least six months, the municipal early childhood education network in a town located in Vale do Jequitinhonha, in 2011. To ensure representativeness, all ten institutions located in the urban region were included. As this was a small population, it was decided that all children who met the criteria would be eligible. A total of 96 children were considered eligible; however, after excluding some participants due to the lack of cooperation from the child and lack of parental consent, 92 children were enrolled in the study.
The following parameters were used to evaluate growth: weight for age, height for age, weight for height, and body mass index (BMI) for age, considering the parameters recommended by the World Health Organization (WHO) as critical Z-score values.12 A Marte® digital scale (Marte, SP, Brazil), with a maximum capacity of 199.95kg, and precision of 50g was used to assess weight. Height was measured using a portable stadiometer (Alturaexata®, MG, Brazil), with a precision of 1mm. The techniques used to obtain all measurements followed standard procedures according to the manual of the Food and Nutrition Surveillance System.13
Child development was assessed according to the Bayley Scale of Infant and Toddler Development (Bayley III),14 the gold standard, widely used in scientific research to assess child development.15,16 It is based on the sum of tasks performed by the child generating gross scores, then converted to composite or balanced scores. For the present study, the following scales were used: cognitive, composite score, with mean and standard deviation of 10 (±15) points, and expressive language scale, balanced score, with mean and standard deviation of 10 (±3) points.
The quality of early childhood education was evaluated by the Infant/Toddler Environment Rating Scale Revised (ITERS-R).17 This tool consists of seven subscales: Space and Furnishings, Personal Care Routines, Listening and Talking, Activities, Interaction between staff and children, Program Structure, Parents and Staff. The scores on each scale and overall score range from 0 to 7, generating the following classification: inadequate (1–2.99), minimum (3–4.99), good (5–6.99), and excellent (7).17 in Brazil, some studies used ITERS-R, and their results showed evidence of tool validity and accuracy.18,19
The home environment quality was assessed using the Home Observation for Measurement of the Environment (HOME) inventory,20 which has six subscales: parental responsivity, acceptance of child, organization of the environment, learning materials, parental involvement, and variety in experience. The tool recognizes as a risk environment for development a score ≤27 in the overall score.20 According to Totsika and Sylva,21 the HOME inventory has been successfully used in research because it is easy to apply and has characteristics considered to be appropriate.
The qualitative assessment of the neighborhood environment was performed through a questionnaire developed based on literature,22 containing questions where the respondent expressed his/her opinion about the accessibility and quality of services, both public and private, as well as social relations between neighbors.
For the economic classification of the children's families, the questionnaire of the Associação Brasileira de Empresas de Pesquisa (ABEP – Brazilian Association of Research Companies) was used. This tool defines socioeconomic status according to durable goods, the number of bathrooms, whether the family employed a housemaid, and the household head's level of education. The score is added and interpreted from the ordinal scale, ranging from class E to A1.23 The socio-demographic and the child's pre- and post-natal health profiles were obtained using a semistructured, self-prepared questionnaire, applied to the child's caregiver.
Prior to the research, some pilot studies were carried out in order to practice the application of tools, as well as to perform the reliability measures. A pilot study was conducted with 20 preschool children to practice the Bayley III application. The same children underwent home visits to practice for the HOME application. The data obtained from these children were not used in the final study.
The reliability among the four examiners who applied the Bayley III scale and the HOME tool was assessed and the intraclass correlation (ICC) results of the subscale means were 0.95 and 0.94, respectively. The ICC between the two examiners who applied the ITERS-R was 0.83. All anthropometric measurements were performed by the same nutritionist. The intra-examiner reliability, measured by the ICC, showed a mean of 0.99 for weight measurement of and 0.98 for height measurement.
The anthropometric assessment and the application of Bayley III scale and ITERS-R inventory were performed in the daycare center, while the other tools were applied at the children's homes by two previously trained examiners.
The descriptive and inferential analyses were performed using SPSS for Windows (IBM Corp. Released 2011. IBM SPSS Statistics for Windows, Version 20.0; NY, USA). A significance level of 0.05 was used to analyze the association between environmental and biological conditions and investigated phenomena, both in the univariate linear regression and the multivariate analyses. The univariate analyses included the independent variables with p-value≤0.20 in Spearman's correlation test and showed no multicollinearity with the other variables.
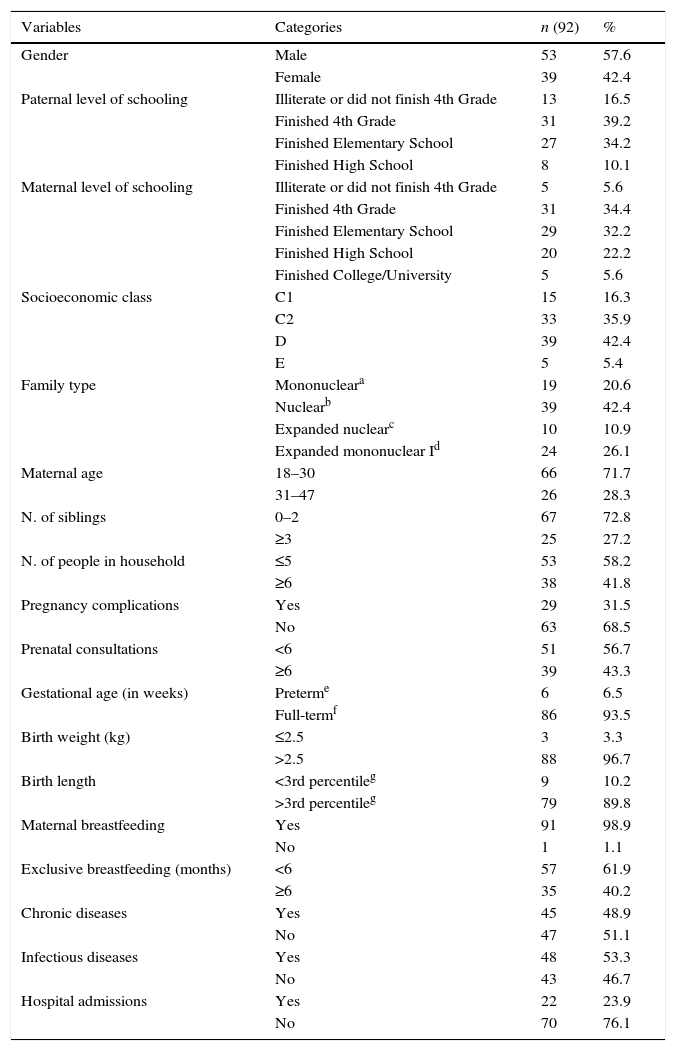
ResultsTable 1 shows the characterization of biological and socioeconomic aspects of the 92 children included in the study. It is noteworthy, among the socioeconomic indicators, low parental education, especially of the father, as 89.9% did not finish high school; the predominance of class D families; and the percentage of biological parents who did not live with their children (46.7%). Most children were born after over 37 weeks of gestation and pregnancy complications were infrequent, as well as birth weight <2.5kg. However, 56.7% of the mothers had had fewer than six prenatal consultations. Despite the high prevalence of breastfeeding, exclusive breastfeeding until six months of life was recorded for only 38.1% of mothers. Almost half of the children had had chronic (45%) and/or infectious diseases (48%) in the last three months prior to data collection.
Socioeconomic characterization and biological profile of the 92 participants. Diamantina, Brazil, 2011.
| Variables | Categories | n (92) | % |
|---|---|---|---|
| Gender | Male | 53 | 57.6 |
| Female | 39 | 42.4 | |
| Paternal level of schooling | Illiterate or did not finish 4th Grade | 13 | 16.5 |
| Finished 4th Grade | 31 | 39.2 | |
| Finished Elementary School | 27 | 34.2 | |
| Finished High School | 8 | 10.1 | |
| Maternal level of schooling | Illiterate or did not finish 4th Grade | 5 | 5.6 |
| Finished 4th Grade | 31 | 34.4 | |
| Finished Elementary School | 29 | 32.2 | |
| Finished High School | 20 | 22.2 | |
| Finished College/University | 5 | 5.6 | |
| Socioeconomic class | C1 | 15 | 16.3 |
| C2 | 33 | 35.9 | |
| D | 39 | 42.4 | |
| E | 5 | 5.4 | |
| Family type | Mononucleara | 19 | 20.6 |
| Nuclearb | 39 | 42.4 | |
| Expanded nuclearc | 10 | 10.9 | |
| Expanded mononuclear Id | 24 | 26.1 | |
| Maternal age | 18–30 | 66 | 71.7 |
| 31–47 | 26 | 28.3 | |
| N. of siblings | 0–2 | 67 | 72.8 |
| ≥3 | 25 | 27.2 | |
| N. of people in household | ≤5 | 53 | 58.2 |
| ≥6 | 38 | 41.8 | |
| Pregnancy complications | Yes | 29 | 31.5 |
| No | 63 | 68.5 | |
| Prenatal consultations | <6 | 51 | 56.7 |
| ≥6 | 39 | 43.3 | |
| Gestational age (in weeks) | Preterme | 6 | 6.5 |
| Full-termf | 86 | 93.5 | |
| Birth weight (kg) | ≤2.5 | 3 | 3.3 |
| >2.5 | 88 | 96.7 | |
| Birth length | <3rd percentileg | 9 | 10.2 |
| >3rd percentileg | 79 | 89.8 | |
| Maternal breastfeeding | Yes | 91 | 98.9 |
| No | 1 | 1.1 | |
| Exclusive breastfeeding (months) | <6 | 57 | 61.9 |
| ≥6 | 35 | 40.2 | |
| Chronic diseases | Yes | 45 | 48.9 |
| No | 47 | 51.1 | |
| Infectious diseases | Yes | 48 | 53.3 |
| No | 43 | 46.7 | |
| Hospital admissions | Yes | 22 | 23.9 |
| No | 70 | 76.1 |
n, absolute number; %, percentage.
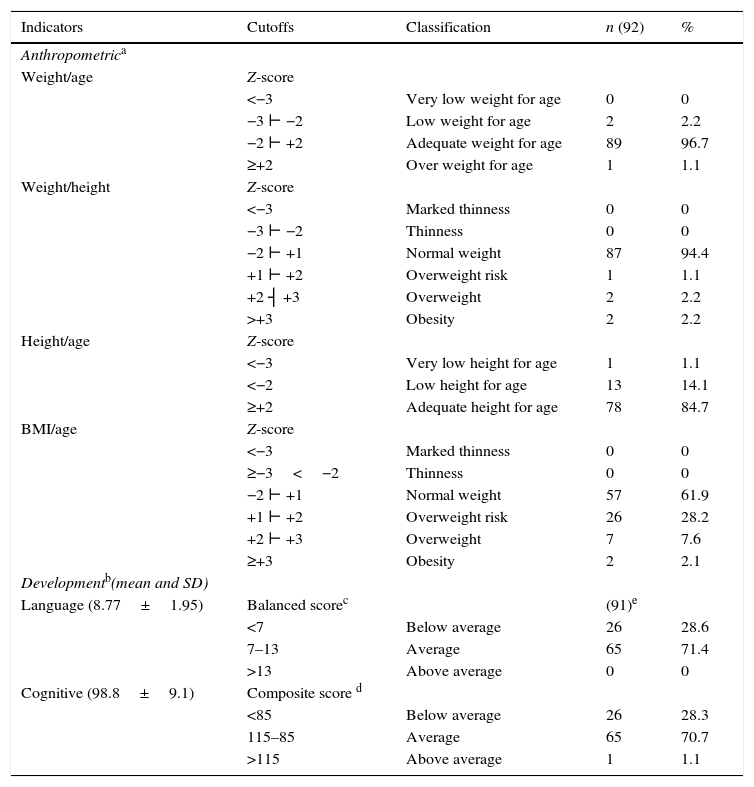
Table 2 shows the results for the growth and development constructs. Among the indicators of growth, height for age showed the highest percentage of deficit, and was thus chosen as the dependent variable in the subsequent inferential analyses. The percentage of children with below-average language and cognitive development showed a difference of only 0.3% between each other. Thus, both were used for the uni- and multilinear regression analyses as dependent variables, representative of the development construct.
Results of the growth and development assessment. Diamantina, Brazil, 2011.
| Indicators | Cutoffs | Classification | n (92) | % |
|---|---|---|---|---|
| Anthropometrica | ||||
| Weight/age | Z-score | |||
| <−3 | Very low weight for age | 0 | 0 | |
| −3 ⊢ −2 | Low weight for age | 2 | 2.2 | |
| −2 ⊢ +2 | Adequate weight for age | 89 | 96.7 | |
| ≥+2 | Over weight for age | 1 | 1.1 | |
| Weight/height | Z-score | |||
| <−3 | Marked thinness | 0 | 0 | |
| −3 ⊢ −2 | Thinness | 0 | 0 | |
| −2 ⊢ +1 | Normal weight | 87 | 94.4 | |
| +1 ⊢ +2 | Overweight risk | 1 | 1.1 | |
| +2 ┤ +3 | Overweight | 2 | 2.2 | |
| >+3 | Obesity | 2 | 2.2 | |
| Height/age | Z-score | |||
| <−3 | Very low height for age | 1 | 1.1 | |
| <−2 | Low height for age | 13 | 14.1 | |
| ≥+2 | Adequate height for age | 78 | 84.7 | |
| BMI/age | Z-score | |||
| <−3 | Marked thinness | 0 | 0 | |
| ≥−3<−2 | Thinness | 0 | 0 | |
| −2 ⊢ +1 | Normal weight | 57 | 61.9 | |
| +1 ⊢ +2 | Overweight risk | 26 | 28.2 | |
| +2 ⊢ +3 | Overweight | 7 | 7.6 | |
| ≥+3 | Obesity | 2 | 2.1 | |
| Developmentb(mean and SD) | ||||
| Language (8.77±1.95) | Balanced scorec | (91)e | ||
| <7 | Below average | 26 | 28.6 | |
| 7–13 | Average | 65 | 71.4 | |
| >13 | Above average | 0 | 0 | |
| Cognitive (98.8±9.1) | Composite score d | |||
| <85 | Below average | 26 | 28.3 | |
| 115–85 | Average | 65 | 70.7 | |
| >115 | Above average | 1 | 1.1 | |
n, absolute number; %, percentage; SD, standard deviation; BMI, body mass index; ––|, including.
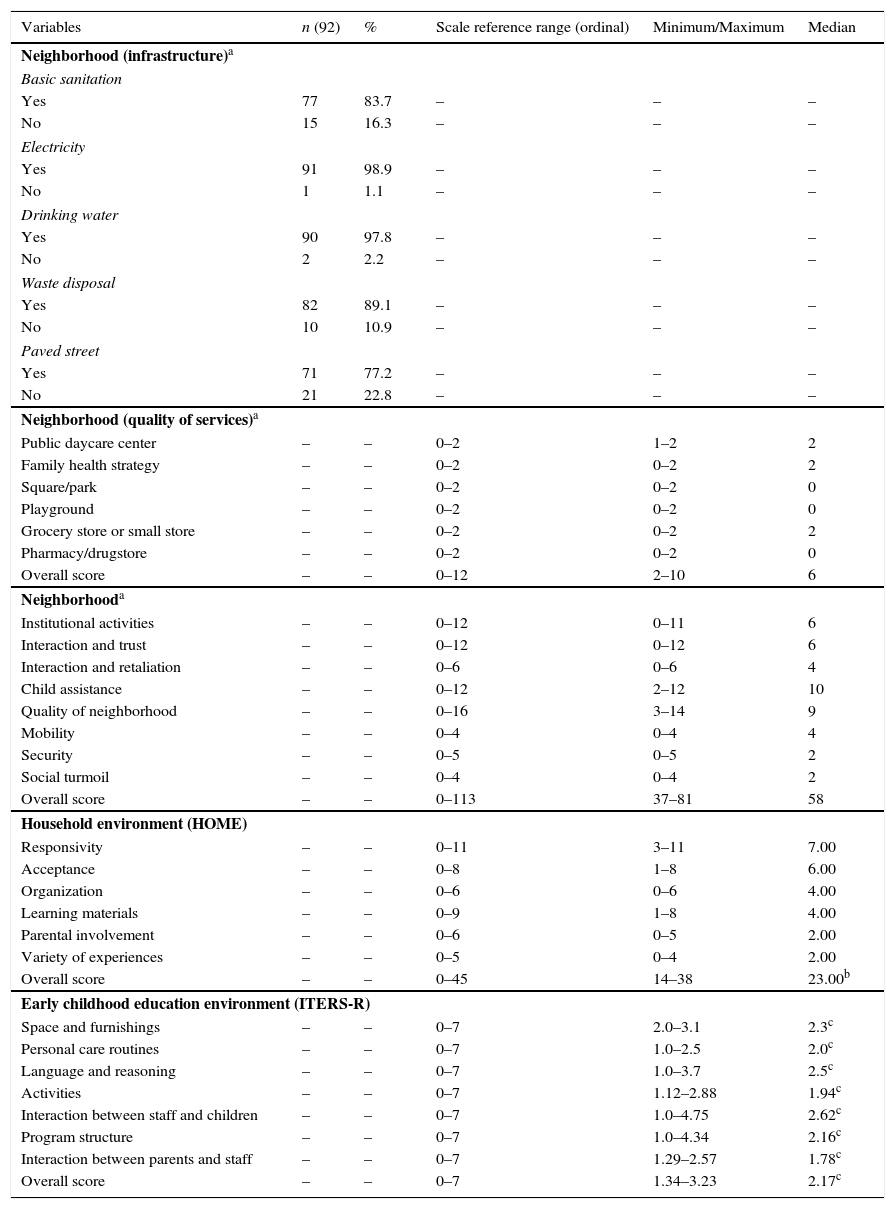
Table 3 shows the results for the assessed environmental factors: neighborhood, home, and preschools. In the neighborhood environment, in the infrastructure category, street pavement and sanitation showed higher levels of inadequacy. Among the offered services, the lower scores were related to parks and playgrounds. Neighborhood security, interaction and trust between neighbors, and social turmoil also showed negative results. At home, it was observed that 69.6% of the children's environment was considered at risk, according to HOME. Regarding the quality of preschools, the median overall score in ITERS-R (2.17) showed that these environments were inadequate.
Quality of environments: neighborhood, home, and early childhood education institutions for the 92 participants. Diamantina, Brazil, 2011.
| Variables | n (92) | % | Scale reference range (ordinal) | Minimum/Maximum | Median |
|---|---|---|---|---|---|
| Neighborhood (infrastructure)a | |||||
| Basic sanitation | |||||
| Yes | 77 | 83.7 | – | – | – |
| No | 15 | 16.3 | – | – | – |
| Electricity | |||||
| Yes | 91 | 98.9 | – | – | – |
| No | 1 | 1.1 | – | – | – |
| Drinking water | |||||
| Yes | 90 | 97.8 | – | – | – |
| No | 2 | 2.2 | – | – | – |
| Waste disposal | |||||
| Yes | 82 | 89.1 | – | – | – |
| No | 10 | 10.9 | – | – | – |
| Paved street | |||||
| Yes | 71 | 77.2 | – | – | – |
| No | 21 | 22.8 | – | – | – |
| Neighborhood (quality of services)a | |||||
| Public daycare center | – | – | 0–2 | 1–2 | 2 |
| Family health strategy | – | – | 0–2 | 0–2 | 2 |
| Square/park | – | – | 0–2 | 0–2 | 0 |
| Playground | – | – | 0–2 | 0–2 | 0 |
| Grocery store or small store | – | – | 0–2 | 0–2 | 2 |
| Pharmacy/drugstore | – | – | 0–2 | 0–2 | 0 |
| Overall score | – | – | 0–12 | 2–10 | 6 |
| Neighborhooda | |||||
| Institutional activities | – | – | 0–12 | 0–11 | 6 |
| Interaction and trust | – | – | 0–12 | 0–12 | 6 |
| Interaction and retaliation | – | – | 0–6 | 0–6 | 4 |
| Child assistance | – | – | 0–12 | 2–12 | 10 |
| Quality of neighborhood | – | – | 0–16 | 3–14 | 9 |
| Mobility | – | – | 0–4 | 0–4 | 4 |
| Security | – | – | 0–5 | 0–5 | 2 |
| Social turmoil | – | – | 0–4 | 0–4 | 2 |
| Overall score | – | – | 0–113 | 37–81 | 58 |
| Household environment (HOME) | |||||
| Responsivity | – | – | 0–11 | 3–11 | 7.00 |
| Acceptance | – | – | 0–8 | 1–8 | 6.00 |
| Organization | – | – | 0–6 | 0–6 | 4.00 |
| Learning materials | – | – | 0–9 | 1–8 | 4.00 |
| Parental involvement | – | – | 0–6 | 0–5 | 2.00 |
| Variety of experiences | – | – | 0–5 | 0–4 | 2.00 |
| Overall score | – | – | 0–45 | 14–38 | 23.00b |
| Early childhood education environment (ITERS-R) | |||||
| Space and furnishings | – | – | 0–7 | 2.0–3.1 | 2.3c |
| Personal care routines | – | – | 0–7 | 1.0–2.5 | 2.0c |
| Language and reasoning | – | – | 0–7 | 1.0–3.7 | 2.5c |
| Activities | – | – | 0–7 | 1.12–2.88 | 1.94c |
| Interaction between staff and children | – | – | 0–7 | 1.0–4.75 | 2.62c |
| Program structure | – | – | 0–7 | 1.0–4.34 | 2.16c |
| Interaction between parents and staff | – | – | 0–7 | 1.29–2.57 | 1.78c |
| Overall score | – | – | 0–7 | 1.34–3.23 | 2.17c |
N, absolute number; %, percentage.
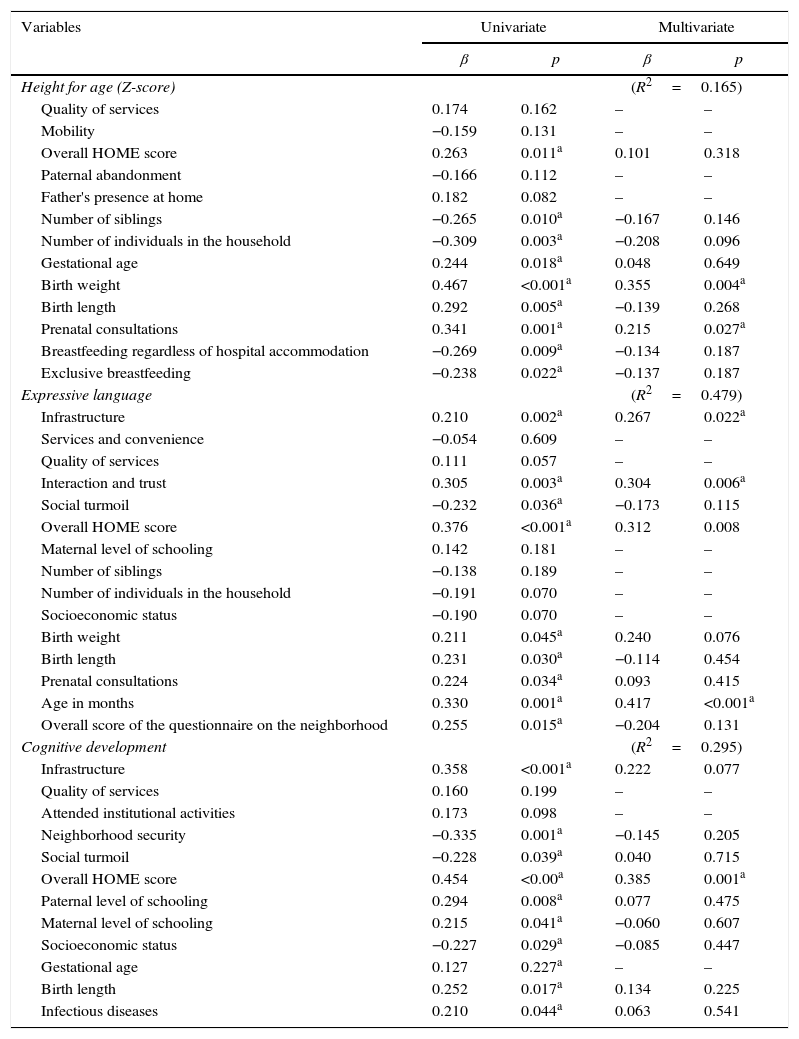
Table 4 shows the predictive factors for growth (height for age) and development (cognitive and language). It was observed that biological, socioeconomic, and environmental factors were associated with the growth construct in the univariate analysis. However, in the multivariate analysis, only birth weight (p<0.004) and number of prenatal consultations (p<0.027) were predictive of the outcome, with an explanatory power of approximately 17%. Environmental and biological factors were associated with language development, considering the univariate analysis. However, in the multivariate analysis, infrastructure (p=0.022) and interaction and trust (p=0.006) remained among the “neighborhood” environment variables; the overall score of the HOME inventory (p=0.008) and the child's age (p<0.001) also remained as explanatory variables of language. This group showed a 48% explanatory power.
Univariate and multivariate linear regression analyses: height for age, expressive language, and cognitive development. Diamantina, Brazil, 2011.
| Variables | Univariate | Multivariate | ||
|---|---|---|---|---|
| β | p | β | p | |
| Height for age (Z-score) | (R2=0.165) | |||
| Quality of services | 0.174 | 0.162 | – | – |
| Mobility | −0.159 | 0.131 | – | – |
| Overall HOME score | 0.263 | 0.011a | 0.101 | 0.318 |
| Paternal abandonment | −0.166 | 0.112 | – | – |
| Father's presence at home | 0.182 | 0.082 | – | – |
| Number of siblings | −0.265 | 0.010a | −0.167 | 0.146 |
| Number of individuals in the household | −0.309 | 0.003a | −0.208 | 0.096 |
| Gestational age | 0.244 | 0.018a | 0.048 | 0.649 |
| Birth weight | 0.467 | <0.001a | 0.355 | 0.004a |
| Birth length | 0.292 | 0.005a | −0.139 | 0.268 |
| Prenatal consultations | 0.341 | 0.001a | 0.215 | 0.027a |
| Breastfeeding regardless of hospital accommodation | −0.269 | 0.009a | −0.134 | 0.187 |
| Exclusive breastfeeding | −0.238 | 0.022a | −0.137 | 0.187 |
| Expressive language | (R2=0.479) | |||
| Infrastructure | 0.210 | 0.002a | 0.267 | 0.022a |
| Services and convenience | −0.054 | 0.609 | – | – |
| Quality of services | 0.111 | 0.057 | – | – |
| Interaction and trust | 0.305 | 0.003a | 0.304 | 0.006a |
| Social turmoil | −0.232 | 0.036a | −0.173 | 0.115 |
| Overall HOME score | 0.376 | <0.001a | 0.312 | 0.008 |
| Maternal level of schooling | 0.142 | 0.181 | – | – |
| Number of siblings | −0.138 | 0.189 | – | – |
| Number of individuals in the household | −0.191 | 0.070 | – | – |
| Socioeconomic status | −0.190 | 0.070 | – | – |
| Birth weight | 0.211 | 0.045a | 0.240 | 0.076 |
| Birth length | 0.231 | 0.030a | −0.114 | 0.454 |
| Prenatal consultations | 0.224 | 0.034a | 0.093 | 0.415 |
| Age in months | 0.330 | 0.001a | 0.417 | <0.001a |
| Overall score of the questionnaire on the neighborhood | 0.255 | 0.015a | −0.204 | 0.131 |
| Cognitive development | (R2=0.295) | |||
| Infrastructure | 0.358 | <0.001a | 0.222 | 0.077 |
| Quality of services | 0.160 | 0.199 | – | – |
| Attended institutional activities | 0.173 | 0.098 | – | – |
| Neighborhood security | −0.335 | 0.001a | −0.145 | 0.205 |
| Social turmoil | −0.228 | 0.039a | 0.040 | 0.715 |
| Overall HOME score | 0.454 | <0.00a | 0.385 | 0.001a |
| Paternal level of schooling | 0.294 | 0.008a | 0.077 | 0.475 |
| Maternal level of schooling | 0.215 | 0.041a | −0.060 | 0.607 |
| Socioeconomic status | −0.227 | 0.029a | −0.085 | 0.447 |
| Gestational age | 0.127 | 0.227a | – | – |
| Birth length | 0.252 | 0.017a | 0.134 | 0.225 |
| Infectious diseases | 0.210 | 0.044a | 0.063 | 0.541 |
β, estimate of the increase or decrease of the dependent variable for each increase of one unit of the independent variable; p, statistical significance; R2, coefficient of determination.
Most environmental and biological factors were associated with the cognitive development in the univariate analysis; however, only the HOME inventory overall score remained in the multivariate model (p=0.001), explaining 29.5% of the outcome.
DiscussionIt is indisputable that, in the past decades, several childhood-related indicators have improved, mainly those related to survival.2 In light of this fact, it is necessary to ensure that these children have the opportunity to reach their full potential for growth and development.3,7 Thus, the present study aimed to investigate growth and development of underprivileged children and their association with environmental, socioeconomic, and biological risk factors.
Regarding the economic profile, it was in agreement with the Brazilian scenario,24 which has shown in recent decades a decrease in the number of individuals in class E. However, the proportion of households belonging to class D (46%) demonstrates the concentration of the study population in economically disadvantaged classes. According to the literature, this fact affects not only the capacity to purchase consumer goods, but also parents’ emotional well-being, which in turn can interfere with adequate child growth and development.3,7
The higher maternal level of education, when compared with the paternal, is consistent with national statistics that show a higher mean of years of study among females (7.6%) when compared with males (7.3%).1 However, it is noteworthy that only 27.8% of the mothers in this study finished high school. Maternal education has been identified as a determining factor for child growth6,11 and development.3,7
The family composition also showed that 46.7% of the children did not live with their biological parents. According to Pilz and Shermann,25 the likelihood of children whose mothers are not supported by the fathers to have suspected developmental delay is seven times higher than those children whose mothers are assisted by their children's father.
As for the maternal and child's health history, it is noteworthy the number of mothers who had had fewer than six prenatal consultations. The percentage of 56.7% was found to be much higher than the 11.8% recorded in the southeast region in 2006.1 Prenatal care is reported as one of the determinants of adequate child growth.6,11 Although 98.9% of the children were breastfed, the rate of exclusive breastfeeding up to six months of life was 2.9%, below the average for the set of Brazilian capital cities.21 Studies have shown both a protective effect of breastfeeding on growth and development when it occurs,7 as well as the risk when it does not.6 The fact that almost half of children had a record of chronic and infectious diseases is of concern, given the association demonstrated by other authors between diseases and growth and development deficits.3,6
Similarly to other studies,10,11,26 the height-for-age indicator was shown to be the most prevalent and representative index of malnutrition. The proportion of 15.2% of low height for age in this population is higher than that found in the Southeast region of the country (5.6%) in the year 2006,26 but it is close to that observed in other studies in areas recognized for their low Human Development Index (HDI), such as the northern region of the country, which recorded 14.7% of stunting in 2006,26 and the Brazilian semi-arid region, with prevalence rates of 13% and 10.9%11 in 2007 and 2008, respectively. These results reflect the inequality among the regions of Brazil, as shown by both health indicators and the HDI.
As for the quality of the assessed households, over half of them were considered to represent a risk for child development. These results corroborate other Brazilian studies that used HOME in the context of underprivileged families.9,27
The quality of the assessed preschool environment ranged from poor to minimally adequate. Some authors,6,28 when assessing the quality of preschool environment through ITERS, found similar results, identifying several inadequacies such as insufficient training of professionals, poor infrastructure, few adequate materials and devices, lack of pedagogical project, and lack of family participation.
Regarding the neighborhood environment, it was observed that more than half of households were disadvantaged, with the following subscales showing the worst results: security, social turmoil, and interaction and trust. For Farias and Pinheiro,29 changes in lifestyle, mediated by increasingly more private and individualized social habits, have hindered the establishment of more participative neighborhood relations.
As for the determinants of the growth and development construct, it appears that biological factors, as well as socioeconomic and environmental ones exert their influence. However, environmental variables were associated with development, whereas biological variables showed a greater association with growth.
Corroborating two other studies, the variables number of prenatal visits and birth weight were explanatory for the height-for-age outcome. Correia et al.10 found an association between this nutritional index and the child's birth weight, whereas Ramos et al.11 found an inverse correlation between stunting and the number of prenatal consultations.
A close association was observed between these explanatory variables, since, according to the literature, one of the most important determinants of birth weight is adequate prenatal care assistance, which can only be achieved with an adequate number of consultations.6 Even if only 3.3% of children were born weighing less than 2.5kg, the multivariate linear regression analysis showed that for every 1kg of birth weight, there was a 0.355 increase in the Z-score of the height-for-age index, which is in agreement with other studies.
The quality of the home environment was the only determinant that explained the cognitive development construct. For language, in addition to the quality of this environment, the neighborhood quality and the child's age were also relevant.
The risk scenario for child development in the household demonstrated by the HOME inventory aimed at home is similar to that found by Lamy Filho et al.9 and by Santos et al.27 The latter authors found that, for every extra unit of domestic stimulation, there was an improvement of half a point in cognitive performance for the children in their study.
The variables related to the neighborhood associated with expressive language performance were infrastructure and interaction and trust between neighbors. Regarding the infrastructure, for Macintyres and Ellaway,30 the greater the access to services and infrastructure, such as sanitation, transportation, healthcare, and leisure, the better the living conditions, and hence the more adequate the child growth and development. As for trust interactions between neighbors and their association with the language construct, it is noteworthy the importance of interactions between the individual and the social environment for the human development process. This process, during childhood, is always mediated by other individuals, whether family members, healthcare and education professionals, or even neighbors. It is through the interaction with the family and its social network that the child assimilates the skills previously constructed throughout human history.26
The third and last variable associated with the “expressive language” outcome corresponds to the child's age. Even if the used measurement tool assesses the child according to his/her age's skills, this variable also appears to be associated with performance in this domain in other studies.8,31 These results could be explained by both biological and environmental factors.31
The model proposed in this study was based on the complexity and context of the growth and development constructs, while considering environmental, biological, and socioeconomic variables. In this sense, the family socioeconomic status and quality of educational institutions, which were not considered by the statistical analysis as predictors of the investigated outcomes, may be exerting their influence indirectly.
Therefore, future studies should investigate the type of influence (direct or indirect), the mediation and moderation associations, and the magnitude of the home, educational, and neighborhood environment impact, as well as socioeconomic and biological factors in child development and growth. One limitation of the present study was the small variability regarding the quality of educational institutions, which may have contributed to the results.
In conclusion, there was a high prevalence of height-for-age deficit, when compared with the national average, and below average results for cognitive development and expressive language among economically disadvantaged children participating in this study. Environmental, socioeconomic, and biological factors influence both development and growth.
However, the biological variables showed a greater association with growth and environmental variables with the assessed development variables, i.e., the cognitive and expressive language domains.
FundingCAPES and UFVJM.
Conflicts of interestThe authors declare no conflicts of interest.
Please cite this article as: da Rocha Neves K, de Souza Morais RL, Teixeira RA, Pinto PA. Growth and development and their environmental and biological determinants. J Pediatr (Rio J). 2016;92:241–50.


