

To examine the associations between socioeconomic and biological factors and infant weight gain.
MethodsAll infants (0-23 months of age) with available birth and postnatal weight data (n = 1763) were selected from the last nationally representative survey with complex probability sampling conducted in Brazil (2006/07). The outcome variable was conditional weight gain (CWG), which represents how much an individual has deviated from his/her expected weight gain, given the birth weight. Associations were estimated using simple and hierarchical multiple linear regression, considering the survey sampling design, and presented in standard deviations of CWG with their respective 95% of confidence intervals. Hierarchical models were designed considering the UNICEF Conceptual Framework for Malnutrition (basic, underlying and immediate causes).
ResultsThe poorest Brazilian regions (-0.14 [-0.25; -0.04]) and rural areas (-0.14 [-0.26;-0.02]) were inversely associated with CWG in the basic causes model. However, this association disappeared after adjusting for maternal and household characteristics. In the final hierarchical model, lower economic status (-0.09 [-0.15; -0.03]), human capital outcomes (maternal education < 4th grade (-0.14[-0.29; 0.01]), higher maternal height (0.02[0.01; 0.03])), and fever in the past 2 weeks (-0.13[-0.26; -0.01]) were associated with postnatal weight gain.
ConclusionThe results showed that poverty and lower human capital are still key factors associated with poor postnatal weight gain. The approach used in these analyses was sensitive to characterize inequalities among different socioeconomic contexts and to identify factors associated with CWG in different levels of determination.
Examinar as associações entre fatores socioeconômicos e biológicos e o ganho de peso de lactentes.
MétodosForam selecionados todos os lactentes (0-23 meses de idade) com dados de peso ao nascer e pós-natal avaliados na última pesquisa com representatividade nacional realizada no Brasil (2006/07) por amostragem probabilística complexa. A variável de resultado foi o Evolução Ponderal Condicional (CWG), que representa quanto um indivíduo desviou de seu ganho de peso esperado, considerando o peso ao nascer. As associações foram estimadas utilizando regressão linear simples e múltipla hierárquica, considerando o plano amostal da pesquisa e apresentadas em desvios padrão do CWG com seus respectivos intervalos de confiança de 95%. Os modelos hierárquicos foram estruturados considerando o Modelo Conceitual de Desnutrição da UNICEF (causas básicas, inerentes e imediatas).
ResultadosAs regiões brasileiras mais pobres (-0,14[-0,25; -0,04]) e a área rural (-0,14[-0,26;-0,02]) foram inversamente associadas ao CWG no modelo de causas básicas. Contudo, essa associação desapareceu após o ajuste pelas características maternas e do ambiente familiar. No modelo hierárquico final, a baixa condição econômica (-0,09[-0,15; -0,03]), as variáveis de capital humano (escolaridade materna < 5° ano (-0,14[-0,29; -0,01])), maior estatura materna (0,02[0,01; 0,03])) e febre nas duas semanas anteriores à pesquisa (-0,13[-0,26; -0,01]) foram inversamente associadas ao ganho de peso pós-natal.
ConclusãoOs resultados mostraram que a pobreza e baixo capital humano ainda são fatores fundamentais associados ao ganho de peso pós-natal abaixo de esperado. A abordagem utilizada em nossas análises foi sensível ao caracterizar desigualdades entre diferentes contextos socioeconômicos e ao identificar fatores associados ao CWG em diferentes níveis de determinação.
Nutritional disorders are cyclically determined by cultural, social, economic, and biological factors at different levels, from the most proximal, such as food availability and the occurrence of diseases, to distal factors such as access to information and the cultural superstructure.1,2
The first two years of life are characterized by accelerated growth and development, which require high nutritional intake and define infants as a group with high biological vulnerability, especially considering that, by this time, growth and development are more strongly determined by environmental factors than by genetic characteristics.3,4 Nutritional disorders beginning in this period are associated with increased mortality, increased susceptibility to infectious diseases, impaired psychomotor development, academic underachievement, and lower productive capacity in adulthood.1,4–6
In Brazil, the predominant nutrition and health policies and programs, such as the exclusive breastfeeding campaign, immunization and supplementation programs, and the food fortification initiative, address infants and their mothers. The main Brazilian social support programs are known as “Fome Zero” and “Plano Brasil Sem Miséria”, which aim to promote household food security and autonomy for low-income families by means of conditional cash transfers, the funding of family farming, and aid for purchasing goods and services.7,8
National health surveys are important tools to evaluate such public policies because they describe the health and nutrition profile of the population, identifying risk factors, to allow comparisons among regions and countries as well as the plotting of trends over time.9,10 Therefore, given the significance of children's growth in the first two years of life3 and using data from the last Brazilian National Survey on Demography and Health of Women and Children (PNDS-2006/07), this study aimed to examine the associations between socioeconomic and biological conditions and postnatal weight gain.
Materials and methodsStudy design and settingsThe PNDS-2006/07 was a national survey conducted between November of 2006 and May of 2007, focused on the health and nutrition of women of reproductive age (15-49 years old) and children under 5 years of age, including social, economic and cultural factors. The PNDS-2006/07 used complex probability sampling in two stages: the primary sampling unit was the census area, and the secondary sampling unit was the household. The study group comprised only private households (including slums). Eligible households were selected at random, taking into account the number of census areas in each region and the urban/rural areas. Further details on methodology, including sampling design and data collection, have been reported elsewhere.11
Eligibility and selection criteriaThe households considered eligible included at least one woman of reproductive age. Data were collected from all children under 59 months for each eligible mother. For the purpose of this study, the authors selected the subgroup of infants (0–23 months of age) living in the same house as their mothers.
Data collection and variables definitionData were collected by pairs of trained female field workers in the children's residence. Children were weighed using an electronic portable scale (Y60) with precision of 100g (Dayhome®, São Paulo, SP, Brazil).11 Birth weight was collected from the child's maternity card, and when not available, by mother's recall. Weight-for-age Z-score (WAZ) was calculated using macros of the World Health Organization (WHO) Anthro Software version 3.2.2 for Stata and the WHO Child Growth Standards were used for anthropometric classification.12
Conditional weight gain (CWG) – the outcome variable – represents a child's deviation from the expected weight gain, given his/her birth weight, and is expressed in standard deviations (SD). CWG is derived from the standardized residuals obtained from a sex-specific linear regression adjusted for WAZ at birth and age at survey, where WAZ at survey is the dependent variable.
It is important to consider this approach in longitudinal analysis of individuals’ growth, since it: 1) overcomes the statistical phenomenon of regression to the mean, where extreme values tend to move closer to the sample mean; 2) incorporates the different ages at survey's date; and, 3) deals with the collinearity of dependent weight measures.13,14 For example, if a child with high birth weight reduces his or her WAZ, likewise for the rest of the children in the sample who were born with high birth weight, the CWG would be ∼0 SD; but, in a counterfactual perspective, if this child keeps the same WAZ when the rest of the sample's WAZ tends to reduce, his or her CWG would be greater than zero SD.
The rationale for the selection of the exposure variables was based on UNICEF's Conceptual Framework of Malnutrition, which considers the basic, underlying, and immediate determinants. The Conceptual Framework of Malnutrition is a useful tool that helps to organize possible causes of nutritional disorders and identify situations where investigations or interventions are required.2
Two variables were included as basic causes: children's area of residence (urban/rural) and regions, dichotomized as South and Southeast or as North, Northeast, and Midwest; this approach was used to contrast socioeconomic differences, the latter regions being more deprived.
As underlying causes, some household and maternal factors were considered. Economic status was assessed by a validated asset-based questionnaire, which classifies households into eight mean family income categories,15 which were reduced to four categories (A1-C1/C2/D/E); the categories A1-C1 (richest) were merged to produce balanced cell sizes in each category. Household food insecurity was assessed using the Brazilian Food Insecurity Scale (EBIA, in Portuguese) a translated and validated version of the USDA Food Security Module, known currently as the US Household Food Security Survey Measure – which classifies the household's in food security level as mild, moderate or severe food insecurity.16,17 Human capital outcomes (maternal education level [< 4th grade] and height [cm]), age at birth (< 18 years), parity (number of deliveries), prenatal care (number of visits), and type of delivery (vaginal/caesarean) were also included.
Lastly, fever or diarrhea in the previous two weeks; hospitalization due to diarrhea, pneumonia, or bronchitis in the previous 12 months; duration of exclusive breastfeeding (< 1 month/1-4 months/> 4 months); age; and sex were considered as basic causes.
Data analysisData were merged and analyzed using Stata software (StataCorp. 2011. Stata Statistical Software: Release 12. College Station, TX: StataCorp LP, USA), considering the stratification and clustering effects of the complex sampling design. Sample weights were only applied to the descriptive statistics to avoid overestimating subgroups.10
In the analytical approach, simple and multivariable linear regression analyses were performed. The multivariable regression was conducted by applying a hierarchical structure to the analysis,18 considering the UNICEF's Framework for Malnutrition.2 Initially, all variables were tested by a simple linear regression and those with p-value < 0.20 were considered eligible for multivariable analyses, within each level of determination. Then, a multivariable analysis was performed for variables considered in the basic causes (Model 1), adjusted for age and sex. This procedure was repeated for the set of underlying (Model 2) and immediate causes (Model 3).
Additionally, these models were adjusted for the previous model, following the hierarchical sequence – that is Model 2 was adjusted for Model 1, and Model 3 was adjusted for Model 2 and 1. Model 3 was also controlled for the source of birth weight data (maternity card or mother's recall). The coefficients were reported as the SD of CWG with their respective 95% confidence intervals (in parenthesis or square brackets through the text). Following the technical literature recommendations, estimates were interpreted in terms of their relevance toward the subject, effect size, and inherent uncertainties, represented herein as the 95% confidence intervals, avoiding the usual accept/reject approach based on the p-value < 0.05 cut-off.19
Ethical AspectsAll procedures involving human subjects in the PNDS-2006/07 were approved by the Research Ethics Committee of the Center of Reference and Training on STD/HIV of São Paulo's State Health Department. The present research was approved by the Research Ethics Committee of the Universidade Federal de São Paulo – CEP/UNIFESP.
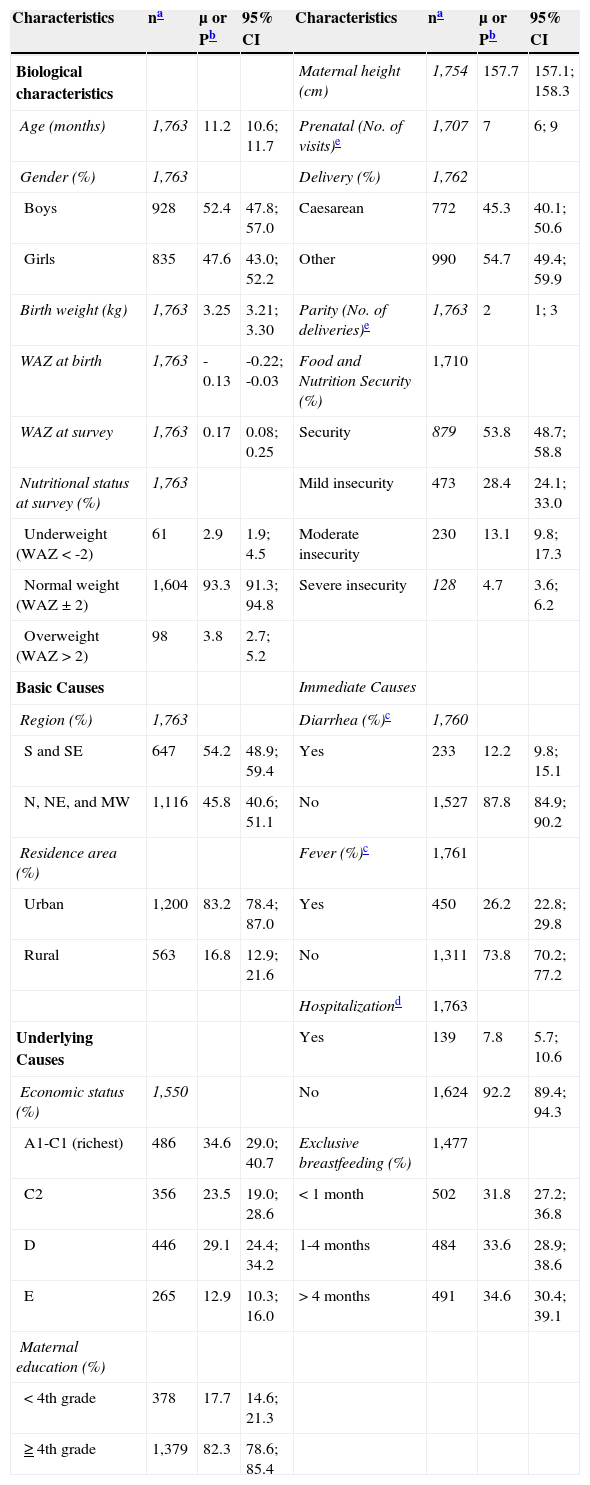
ResultsOf the 6,011 children born after January 2001 who were available in the dataset, 1,763 were infants (0-23 months of age) living in the same house as their mothers, having biologically plausible WAZ data (-6 to +5 SD) at birth and at survey date (Fig. 1). The sample's characteristics are described in Table 1.

Characteristics of Brazilian infants from the Brazilian Children's and Women's Demographic and Health Survey – PNDS – 2006/07.
| Characteristics | na | μ or Pb | 95% CI | Characteristics | na | μ or Pb | 95% CI |
|---|---|---|---|---|---|---|---|
| Biological characteristics | Maternal height (cm) | 1,754 | 157.7 | 157.1; 158.3 | |||
| Age (months) | 1,763 | 11.2 | 10.6; 11.7 | Prenatal (No. of visits)e | 1,707 | 7 | 6; 9 |
| Gender (%) | 1,763 | Delivery (%) | 1,762 | ||||
| Boys | 928 | 52.4 | 47.8; 57.0 | Caesarean | 772 | 45.3 | 40.1; 50.6 |
| Girls | 835 | 47.6 | 43.0; 52.2 | Other | 990 | 54.7 | 49.4; 59.9 |
| Birth weight (kg) | 1,763 | 3.25 | 3.21; 3.30 | Parity (No. of deliveries)e | 1,763 | 2 | 1; 3 |
| WAZ at birth | 1,763 | -0.13 | -0.22; -0.03 | Food and Nutrition Security (%) | 1,710 | ||
| WAZ at survey | 1,763 | 0.17 | 0.08; 0.25 | Security | 879 | 53.8 | 48.7; 58.8 |
| Nutritional status at survey (%) | 1,763 | Mild insecurity | 473 | 28.4 | 24.1; 33.0 | ||
| Underweight (WAZ < -2) | 61 | 2.9 | 1.9; 4.5 | Moderate insecurity | 230 | 13.1 | 9.8; 17.3 |
| Normal weight (WAZ ± 2) | 1,604 | 93.3 | 91.3; 94.8 | Severe insecurity | 128 | 4.7 | 3.6; 6.2 |
| Overweight (WAZ > 2) | 98 | 3.8 | 2.7; 5.2 | ||||
| Basic Causes | Immediate Causes | ||||||
| Region (%) | 1,763 | Diarrhea (%)c | 1,760 | ||||
| S and SE | 647 | 54.2 | 48.9; 59.4 | Yes | 233 | 12.2 | 9.8; 15.1 |
| N, NE, and MW | 1,116 | 45.8 | 40.6; 51.1 | No | 1,527 | 87.8 | 84.9; 90.2 |
| Residence area (%) | Fever (%)c | 1,761 | |||||
| Urban | 1,200 | 83.2 | 78.4; 87.0 | Yes | 450 | 26.2 | 22.8; 29.8 |
| Rural | 563 | 16.8 | 12.9; 21.6 | No | 1,311 | 73.8 | 70.2; 77.2 |
| Hospitalizationd | 1,763 | ||||||
| Underlying Causes | Yes | 139 | 7.8 | 5.7; 10.6 | |||
| Economic status (%) | 1,550 | No | 1,624 | 92.2 | 89.4; 94.3 | ||
| A1-C1 (richest) | 486 | 34.6 | 29.0; 40.7 | Exclusive breastfeeding (%) | 1,477 | ||
| C2 | 356 | 23.5 | 19.0; 28.6 | < 1 month | 502 | 31.8 | 27.2; 36.8 |
| D | 446 | 29.1 | 24.4; 34.2 | 1-4 months | 484 | 33.6 | 28.9; 38.6 |
| E | 265 | 12.9 | 10.3; 16.0 | > 4 months | 491 | 34.6 | 30.4; 39.1 |
| Maternal education (%) | |||||||
| < 4th grade | 378 | 17.7 | 14.6; 21.3 | ||||
| ≥ 4th grade | 1,379 | 82.3 | 78.6; 85.4 |
μ, mean; P, prevalence; CI, confidence interval; WAZ, weight-for-age Z-score; S, South; SE, Southeast; N, North; NE, Northeast; MW, Midwest.
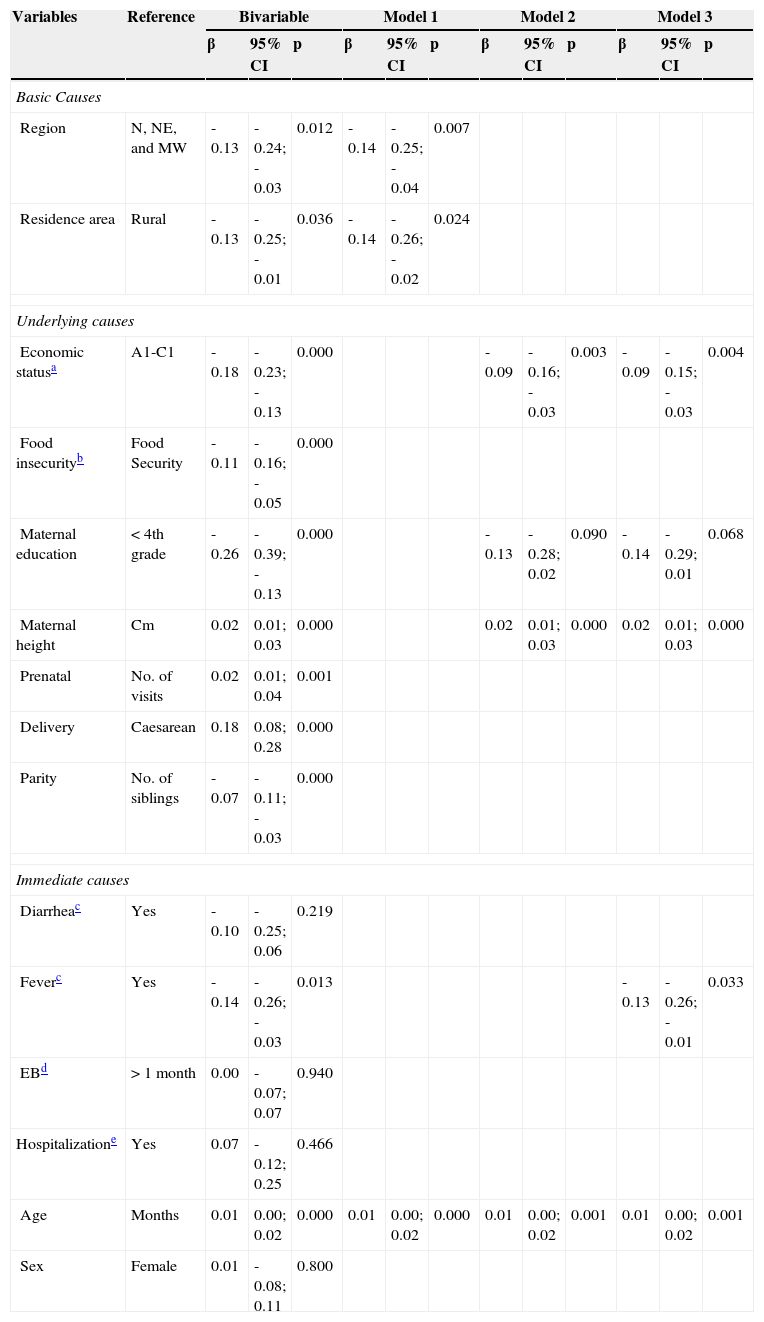
Diarrhea in the past two weeks, duration of exclusive breastfeeding and hospitalization for diarrhea, pneumonia, and bronchitis in the past 12 months were not considered for multivariable analyses (p-value > 0.20). Sex was kept in the models to adjust for potential sex-related confounding. Sample losses occurred in the Models 2 and 3 due to missing values in the dataset (Table 2).
Linear models of association between environmental and individual factors and conditional weight gain (CWG) among Brazilian infants – PNDS - 2006/07.
| Variables | Reference | Bivariable | Model 1 | Model 2 | Model 3 | ||||||||
|---|---|---|---|---|---|---|---|---|---|---|---|---|---|
| β | 95% CI | p | β | 95% CI | p | β | 95% CI | p | β | 95% CI | p | ||
| Basic Causes | |||||||||||||
| Region | N, NE, and MW | -0.13 | -0.24; -0.03 | 0.012 | -0.14 | -0.25; -0.04 | 0.007 | ||||||
| Residence area | Rural | -0.13 | -0.25; -0.01 | 0.036 | -0.14 | -0.26; -0.02 | 0.024 | ||||||
| Underlying causes | |||||||||||||
| Economic statusa | A1-C1 | -0.18 | -0.23; -0.13 | 0.000 | -0.09 | -0.16; -0.03 | 0.003 | -0.09 | -0.15; -0.03 | 0.004 | |||
| Food insecurityb | Food Security | -0.11 | -0.16; -0.05 | 0.000 | |||||||||
| Maternal education | < 4th grade | -0.26 | -0.39; -0.13 | 0.000 | -0.13 | -0.28; 0.02 | 0.090 | -0.14 | -0.29; 0.01 | 0.068 | |||
| Maternal height | Cm | 0.02 | 0.01; 0.03 | 0.000 | 0.02 | 0.01; 0.03 | 0.000 | 0.02 | 0.01; 0.03 | 0.000 | |||
| Prenatal | No. of visits | 0.02 | 0.01; 0.04 | 0.001 | |||||||||
| Delivery | Caesarean | 0.18 | 0.08; 0.28 | 0.000 | |||||||||
| Parity | No. of siblings | -0.07 | -0.11; -0.03 | 0.000 | |||||||||
| Immediate causes | |||||||||||||
| Diarrheac | Yes | -0.10 | -0.25; 0.06 | 0.219 | |||||||||
| Feverc | Yes | -0.14 | -0.26; -0.03 | 0.013 | -0.13 | -0.26; -0.01 | 0.033 | ||||||
| EBd | > 1 month | 0.00 | -0.07; 0.07 | 0.940 | |||||||||
| Hospitalizatione | Yes | 0.07 | -0.12; 0.25 | 0.466 | |||||||||
| Age | Months | 0.01 | 0.00; 0.02 | 0.000 | 0.01 | 0.00; 0.02 | 0.000 | 0.01 | 0.00; 0.02 | 0.001 | 0.01 | 0.00; 0.02 | 0.001 |
| Sex | Female | 0.01 | -0.08; 0.11 | 0.800 | |||||||||
Model 1: n = 1,763 – adjusted for age and sex; Model 2: n = 1,448 – adjusted for Model 1, household food insecurity, prenatal, type of delivery, and parity; Model 3: n = 1,447 – adjusted for Model 2 and source of birth weight data (maternity card/mother's recall).
EB, exclusive breastfeeding.
Both basic causes were inversely associated with the CWG (Table 2 – Model 1). However, this association was lost after adjusting the model for underlying causes (Model 2). When adjusted for immediate causes (Model 3), economic status (-0.09 [-0.15; -0.03]), maternal education (-0.14 [-0.29; -0.01]), and fever in the past two weeks (-0.13 [-0.26; -0.01]) were inversely associated with children's weight gain. However, each 1cm increment in maternal height was associated with an increase of 0.02 SD (0.01; 0.03) in children's postnatal weight gain.
DiscussionUsing data from the PNDS-2006/07, the most recent survey with national representativeness conducted in Brazil, it was possible to identify the level of association between a set of factors – in different hierarchical levels of determination – and postnatal weight gain among Brazilian infants. It was found that lower economic status and maternal education and fever in the past two weeks had a negative impact on postnatal weight gain, and that maternal height was positively associated with CWG.
Although geographical factors were highly associated with CWG in Model 1, when the maternal and household characteristics were introduced in the hierarchical model (Model 2), the association between geographical factors and CWG disappeared, and was replaced by economic status and higher maternal height; low maternal education presented only a moderate association. However, when the third level (immediate causes) was introduced into the analysis, fever remained associated with CWG and the level of association between low maternal education and CWG increased.
The trajectory of growth is mediated by a complex network of non-mutually exclusive factors, acting at different levels of causation, from social, economic, and political determinants; followed by access to health services, food security, income, and educational level; to individual factors related to the burden of disease, eating/feeding practices, metabolic programming, and genetic factors.2,3,20
The present results demonstrated that low income and maternal educational levels are still key factors to weight faltering. However, contrary to expected, geographical characteristics were not independent factors associated with CWG. This lack of association may be a consequence of the coverage expansion of the public primary health care system in Brazil8 and/or the intense migratory process from the poorest to the richest regions and from rural to urban areas.21 However, this statement may not hold true for geographical disparities within neighborhoods or cities.22,23
Besides geographical factors, the lack of association of CWG and diarrhea can also be explained by the improvement of health and sanitation systems. The increased access to health services enables the provision of adequate rehydration and antibiotic therapy to infants, which prevents important acute weight loss and/or promotes faster recovery.8,24,25 Moreover, one of the components of social programs in Brazil consists of having young children periodically evaluated by health practitioners. Together with the expansion of the water supply and sewerage, Brazil has substantially reduced nutritional disorders and mortality rates from acute infections.8,25
The associations found here depict a society in transition, where geographical characteristics or acute diseases are no longer major determinants of negative nutritional disorders, but low socioeconomic status and educational attainment still are. It contrasts with high-income countries, where weight faltering is most attributed to higher parity, low appetite, weaning/feeding/eating difficulties, or lack of positive interactions between infants and parents.26 This study also observed an inverse and significant association between parity and CWG; however, it was not sustained after adjusting for the other factors. This may have occurred due to the relationship between higher parity and lower income and educational levels in Brazil.27
Although food insecurity and income level are related variables, in the present analysis economic status performed better as explanatory variable of CWG. The authors attribute this to the fact that the questions in the EBIA are related to any event of food insecurity in the past three months, without considering the frequency of events; furthermore, the process for a family to improve their economic status may require considerable time (even generations). The CWG was sensitive to such difference and, therefore, it is reasonable to consider that infants were exposed to the same or similar economic environment described at survey since birth, considering that those living in less privileged households experienced poorer postnatal weight gain compared to those from wealthy families.
The variation in the effect size and the level of association between low maternal education and CWG in the bivariate and multivariate analyses was noteworthy. The same rationale described previously can be used to explain such variation, since economic status and educational level are related variables. However, there was some effect on CWG that was not fully explained by economic status, and after adding the occurrence of fever in the previous two weeks, the level of association between low maternal education and poor weight gain increased.
Lack of maternal education is a recognized risk factor for negative health outcomes28 and, in this context, this result was interpreted as the maternal inability to provide adequate care, either due to the inability to recognize the development of an infectious process, or delay in seeking health services. The impact on weight gain is a consequence of increased energy expenditure and reduced food intake, due to the anorectic effect of pro-inflammatory cytokines on appetite regulatory hormones (i.e. leptin) and neuropeptides (i.e. neuropeptide Y) during the acute phase response.29 Considering the family's socioeconomic status in this equation – that is, living in an unhealthy environment – these infants may have experienced multiple infectious events during their lives.
Finally, the positive association between maternal height and child weight gain should not be interpreted solely as a consequence of shared genetic characteristics, but also as a milieu of inadequate health and nutrition during a woman's childhood (compromising her growth and, consequently, reproductive organ size) and pregnancy (insufficient provision of nutrients impairing intrauterine growth).3 This relationship highlights the importance of improving not only infants’ but also women's health and nutritional status to break this cycle.
Using data from the ALSPAC cohort, Din et al.30 compared the patterns of weight gain among children who had “early weight faltering” (< 5th percentile of weight gain at 8 weeks), “late weight faltering” (< 5th percentile of weight gain at 9 months), and a control group. Similarly to the present study, they observed a positive association between age and CWG. The pattern of weight gain was different depending on when the weight faltering occurred, but by the age of 13 years these children substantially recovered weight; however, their standardized mean weight and height was statistically different from the control group.
Such findings highlight the importance of preventing nutritional disorders during the first 1,000 days of life – from conception to 2 years of age – because damages that occur in this period will be reflected in long-term health and human capital outcomes.3
The main strengths of this study include its basis on the most recent representative sample of the Brazilian population, designed and conducted by a team of experienced researchers, who used CWG to evaluate children's growth; thus, these results have not only internal validity, but also can be generalized to all Brazilian infants and, although the PNDS dates from 2006/07, it is considered that the findings are still valid, since no major political or structural changes have occurred in Brazilian society in the last several years. However, a new PNDS is needed to update the knowledge about the current children's nutritional and health status in Brazil, allowing comparisons with previous national and international health surveys.
It is important to consider two limitations in the interpretation of this study. First, although the PNDS-2006/07 included slums in the household sample, it did not considered institutionalized (i.e. hospital or orphanage), homeless, or children living in settlements; second, the mortality bias, which is related to the death of children who were born under inadequate conditions or were exposed to adverse conditions during the gestational period. Therefore, these findings cannot be generalized to children living under the described circumstances, and furthermore, these limitations may have underestimated the magnitude and level of association of the results.
Contrary to the attained nutritional status (i.e., WAZ), the CWG is generated considering the birth weight, which allows for the analysis of how much a child deviated from his/her expected weight gain, considering his/her peers, providing a better measure of environmental influences of growth. However, this is a measure exclusive to academic research, and cannot feasibly be used in a clinical setting.
Regardless, its interpretation has important clinical and public health implications. It highlights the importance of tracking infants’ weight gain, particularly among those living in poorer contexts and whose mothers have lower education. To break the cycle of intergenerational negative effects on child growth, special attention regarding health and education should be given to girls and women. In terms of public health, this approach was sensitive in identifying factors associated with postnatal weight gain and quantifying the size and direction of the associations, which may be a useful tool to evaluate programs targeted at improving children's and women's nutrition and health status and human capital.
These results showed that poverty and lower human capital are still key factors associated with poor postnatal weight gain. The approach used was sensitive in characterizing inequalities among different socioeconomic contexts and in identifying factors at different levels of determination associated with CWG.
FundingThe Brazilian Children's and Women's Demographic and Health Survey 2006/07 was funded by the Ministry of Health and executed by the Brazilian Center for Analysis and Planning (CEBRAP). The author JS received a scholarship from Fundação de Amparo à Pesquisa do Estado de São Paulo (FAPESP) protocol no. 2011/17736-4. The author AP received a scholarship from Coordenação de Aperfeiçoamento de Pessoal de Nível Superior (CAPES). The author JT is partially funded by Conselho Nacional de Desenvolvimento Científico e Tecnológico (CNPq).
Conflicts of interestThe authors declare no conflicts of interest.
Please cite this article as: Silveira JA, Colugnati FA, Poblacion AP, Taddei JA. Association between socioeconomic and biological factors and infant weight gain: Brazilian Demographic and Health Survey – PNDS-2006/07. J Pediatr (Rio J). 2015;91:284–91.
Study conducted at Departamento de Pediatria, Universidade Federal de São Paulo (UNIFESP), São Paulo, SP, Brazil.


