
To compare different methods of screening for blood pressure disorders in children and adolescents.
MethodA database with 17,083 medical records of patients from a pediatric cardiology clinic was used. After analyzing the inclusion and exclusion criteria, 5,650 were selected. These were divided into two age groups: between 5 and 13 years and between 13 and 18 years. The blood pressure measurement was classified as normal, pre-hypertensive, or hypertensive, consistent with recent guidelines and the selected screening methods. Sensitivity, specificity, and accuracy were then calculated according to gender and age range.
ResultsThe formulas proposed by Somu and Ardissino's table showed low sensitivity in identifying pre-hypertension in all age groups, whereas the table proposed by Kaelber showed the best results. The ratio between blood pressure and height showed low specificity in the younger age group, but showed good performance in adolescents.
ConclusionScreening tools used for the assessment of blood pressure disorders in children and adolescents may be useful to decrease the current rate of underdiagnosis of this condition. The table proposed by Kaelber showed the best results; however, the ratio between BP and height demonstrated specific advantages, as it does not require tables.
comparar diferentes métodos de rastreamento para distúrbios da pressão arterial em crianças e adolescentes.
Métodofoi utilizado um banco de dados com 17083 prontuários de pacientes de uma clínica de cardiologia pediátrica. Após análise dos critérios de inclusão e exclusão, 5650 foram selecionados. Estes foram divididos em duas faixas etárias: entre cinco e 13 anos e entre 13 e 18 anos De acordo com a aferição da pressão arterial, a mesma era classificada como normal, pré-hipertensiva ou hipertensiva de acordo com guidelines recentes e dos métodos de rastreamento selecionados. Posteriormente, foram calculadas a sensibilidade, especificidade e acurácia de cada um de acordo com o gênero e faixa etária.
Resultadosas fórmulas de Somu e a tabela proposta por Ardissino apresentaram baixa sensibilidade na identificação de pré-hipertensão em todas as faixas etárias, enquanto a tabela proposta por Kaelber apresentou os melhores resultados. A razão entre pressão arterial e altura apresentou baixa especificidade na faixa etária menor, mas apresentou bom desempenho em adolescentes.
Conclusãoas ferramentas de rastreamento para distúrbios da pressão arterial em crianças e adolescentes podem ser úteis para diminuir o subdiagnóstico que ocorre atualmente nessa condição. A tabela proposta por Kaelber apresentou os melhores resultados, entretanto a razão entre PA e altura apresenta vantagens específicas, como a não necessidade de tabelas.
Systemic arterial hypertension (SAH) is a major risk factor for cardiovascular morbid events,1 which predominantly occurs in adults and the elderly. However, its prevalence is increasing in the pediatric age group,2 mainly due to changes in lifestyle.
Despite the importance of this condition, SAH is rarely diagnosed in childhood.3 Several factors contribute to this, but the diagnostic process is deemed as one of the main reasons.4 It involves the analysis of several tables of percentiles, as the blood pressure (BP) in pediatric patients varies according to age, gender, and height.
Several methods have been described to simplify the diagnosis of hypertension in children and adolescents.5 Some of them involve the use of mathematical formulas,6 others use simplified tables,7–9 and the latest uses cutoffs based on the ratio between BP and height.4 The comparison of these methods can be useful in determining an adequate tool for the screening of BP disorders.
Therefore, this study aimed to compare different screening methods to identify high BP in children and adolescents. The methods used were Somu equations, the ratio between BP and height, and the tables proposed by Kaelber, Mitchell et al., and Ardissino.
MethodsThis was a retrospective study based on medical record analysis in a pediatric cardiology clinic in Northeast Brazil. A total of 17,083 records were analyzed and those that did not have all of the following information were excluded: weight, height, systolic BP (SBP), diastolic BP (DBP), and gender. Also excluded were those aged less than 5 years and those 18 years of age or older. A total of 5,650 records were analyzed.
The outpatient clinic protocol established the measurement of BP with appropriate cuff size for age and arm circumference (Bic Medical Device Industry, SP, Brazil), after ten minutes of rest, on the right arm, and with the patient in the sitting position. Height was determined using a stadiometer, with the patient barefoot, whereas weight was measured using an electronic scale and with the patient wearing light clothing. Body mass index (BMI) was defined as weight divided by height squared. BP was measured by a pediatric cardiologist, while height and weight were measured by a trained professional. Only the first measurement of each variable was considered for each patient.
All data were tabulated in a spreadsheet. BP levels were classified as normal, pre-hypertensive, and hypertensive according to the recommendations of NHBPEP (National High Blood Pressure Education Program)10 These guidelines use a combination of several tables of percentiles (SBP, DBP, age, and height for each gender) for the diagnosis of pre-hypertension and hypertension, and are considered the gold standard in this study. They were also divided into two age groups: between 5 and 13 years and between 13 and 18 years. In this study, children are defined as belonging to the first age group and adolescents to the second. It is worth mentioning that more than one BP measurement is needed to diagnose BP disorder. Therefore, in the present study, the terms pre-hypertensive and hypertensive refer, respectively, to patients with pre-hypertensive and hypertensive BP levels at the first measurement rather than at the final diagnosis.
Patients were classified as normal or high BP according to the simplified tables proposed by Kaelber,8 Mitchell et al., 7 and Ardissino,9 by the equations proposed by Somu,6 as well as by the ratio between BP and height proposed by Lu.4 The latter uses cutoffs obtained from the ratio between SBP and height and between DBP and height. The cutoff points used in the study were those described by Guo et al. 11 for pre-hypertension and SAH. Table 1 depicts these methods. Obesity was defined as BMI greater than or equal to the 95th percentile.
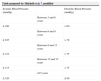
Different screening methods for blood pressure disorders in children and adolescents.
| Table proposed by Mitchell et al. 7, modified | ||
|---|---|---|
| Systolic Blood Pressure (mmHg) | Diastolic Blood Pressure (mmHg) | |
| Between 3 and 6 years | ||
| ≥ 100 | > 60 | |
| Between 6 and 9 years | ||
| ≥ 105 | > 70 | |
| Between 9 and 12 years | ||
| ≥ 110 | > 75 | |
| Between 12 and 15 years | ||
| ≥ 115 | > 75 | |
| ≥15 years | ||
| ≥ 120 | ≥ 80 | |
| Table proposed by Kaelber, modified8 | ||
|---|---|---|
| Age in years | Blood Pressure (mmHg) | |
| Male gender | Female gender | |
| Systolic/diastolic | Systolic/diastolic | |
| 3 | 100/59 | 100/61 |
| 4 | 102/62 | 101/64 |
| 5 | 104/65 | 103/66 |
| 6 | 105/68 | 104/68 |
| 7 | 106/70 | 106/69 |
| 8 | 107/71 | 108/71 |
| 9 | 109/72 | 110/72 |
| 10 | 111/73 | 112/73 |
| 11 | 113/74 | 114/74 |
| 12 | 115/74 | 116/75 |
| 13 | 117/75 | 117/76 |
| 14 | 120/75 | 119/77 |
| 15 | 120/76 | 120/78 |
| 16 | 120/78 | 120/78 |
| 17 | 120/80 | 120/78 |
| ≥18 | 120/80 | 120/80 |
| Table proposed by Ardissino, modified9 | ||||
|---|---|---|---|---|
| Height in cm | Blood Pressure (mmHg) | |||
| Male gender | Female gender | |||
| Systolic | Diastolic | Systolic | Diastolic | |
| 55 | 97 | 70 | 99 | 70 |
| 60 | 106 | 68 | 108 | 68 |
| 70 | 110 | 69 | 111 | 70 |
| 80 | 104 | 59 | 105 | 60 |
| 90 | 108 | 63 | 107 | 64 |
| 100 | 110 | 67 | 108 | 68 |
| 110 | 113 | 73 | 110 | 72 |
| 120 | 115 | 79 | 113 | 76 |
| 130 | 117 | 82 | 117 | 79 |
| 140 | 120 | 83 | 119 | 81 |
| 150 | 124 | 85 | 123 | 83 |
| 160 | 127 | 85 | 127 | 85 |
| 170 | 127 | 85 | 127 | 85 |
| 180 | 127 | 85 | 127 | 85 |
| 190 | 127 | 85 | - | - |
| Somu's formulae6 | ||
|---|---|---|
| Blood Pressure | Age | Formula |
| Systolic (mmHg) | Between 1 and 17 years | 100+(age in years x 2) |
| Diastolic (mmHg) | Between 1 and 11 years | 60+(age in years x 2) |
| Between 11 and 17 years | 70+(age in years) | |
| BP and height ratio4 | |||||
|---|---|---|---|---|---|
| Age range | Blood Pressure | Cutoffs11 | |||
| Male gender | Female gender | ||||
| Pre-hypertension | SAH | Pre-hypertension | SAH | ||
| Between 5 and 13 years | Systolic | 0.81 | 0.84 | 0.77 | 0.83 |
| Diastolic | 0.50 | 0.54 | 0.50 | 0.53 | |
| Between 13 and 18 years | Systolic | 0.71 | 0.77 | 0.73 | 0.79 |
| Diastolic | 0.46 | 0.48 | 0.48 | 0.51 | |
SAH, systemic arterial hypertension; BP, blood pressure.
Subsequently, sensitivity, specificity, accuracy, likelihood ratios, and predictive values for each test were calculated and compared with the gold standard, for both pre-hypertension and hypertension values. Categorical variables were compared using the chi-squared test. A value of p<0.05 was considered statistically significant. Odds ratios were used to demonstrate the strength of correlation.
This study was approved by the Research Ethics Committee of Complexo Hospitalar Oswaldo Cruz.
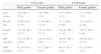
ResultsOf the assessed patients, 41.61% were females. Regarding age range, the most prevalent was that of 5 to 13 years old, with 4,796 individuals. Table 2 shows the means of the assessed characteristics divided by gender and age range.
Mean age, weight, height, systolic blood pressure, and diastolic blood pressure by age range and gender.
| 5-13 years | 13-18 years | |||
|---|---|---|---|---|
| Male gender | Female gender | Male gender | Female gender | |
| Age (years) | 8.84 (SD=2.29) | 8.90 (SD=2.25) | 14.57 (SD=1.14) | 14.77 (SD=1.33) |
| Weight (kg) | 33.90 (SD=12.38) | 33.38 (SD=12.28) | 57.35 (SD=14.56) | 53.45 (SD=12.86) |
| Height (cm) | 133.28 (SD=14.37) | 133.32 (SD=15.25) | 164.40 (SD=11.20) | 158.77 (SD=6.89) |
| SBP (mmHg) | 101.45 (SD=10.02) | 100.93 (SD=9.67) | 108.65 (SD=12.23) | 108.65 (SD=12.23) |
| DBP (mmHg) | 62.30 (SD=8.25) | 62.12 (SD=8.02) | 68.43 (SD=8.09) | 67.18 (SD=9.25) |
SD, standard deviation; DBP, diastolic blood pressure; SBP, systolic blood pressure.
The prevalence of high BP was 10.71%; it was lower in children (9.78%) than in adolescents (15.93%). The same did not occur with obesity, with an overall prevalence of 19.50%, representing 21.33% in children and 9.25% in adolescents. There was a positive correlation between obesity and high BP in both children and adolescents (odds ratio=3.8272 in children and 5.9585 in adolescents with p<0.01 in both groups).
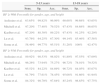
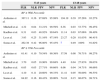
The table proposed by Ardissino and Somu's equations had low sensitivity, despite good accuracy. Table 3 shows the values of sensitivity, specificity, and accuracy per age range when compared to the gold standard for pre-hypertension and hypertension. Table 4 shows the predictive values and likelihood ratios.
Test sensitivity, specificity, and accuracy.
| 5-13 years | 13-18 years | |||||
|---|---|---|---|---|---|---|
| Sens. | Sp. | Acc. | Sens. | Sp. | Acc. | |
| BP ≥ 90th Percentile for gender, age, and height | ||||||
| Ardissino et al. | 63.65% | 99.82% | 96.09% | 60.68% | 99.68% | 93.65% |
| Mitchell et al. | 97.20% | 77.48% | 79.52% | 97.43% | 84.68% | 86.65% |
| Kaelber et al. | 97.20% | 88.30% | 89.22% | 97.43% | 91.25% | 92.20% |
| Lu et al. | 93.76% | 64.25% | 67.30% | 99.14% | 85.46% | 87.58% |
| Somu et al. | 58.49% | 99.77% | 95.51% | 51.28% | 100% | 92.47% |
| BP ≥ 95th Percentile for gender, age, and height | ||||||
| Ardissino et al. | 89.92% | 98.53% | 98.02% | 91.80% | 97.55% | 97.09% |
| Mitchell et al. | 96.26% | 73.94% | 75.27% | 96.72% | 78.01% | 79.52% |
| Kaelber et al. | 95.52% | 84.22% | 84.89% | 96.72% | 84.05% | 85.07% |
| Lu et al. | 91.79% | 77.61% | 78.45% | 95.08% | 91.66% | 91.94% |
| Somu et al. | 84.32% | 98.70% | 97.84% | 85.24% | 98.85% | 97.75% |
BP, blood pressure.
Positive and negative likelihood ratios and positive and negative predictive values of the tests.
| 5-13 years | 13-18 years | |||||||
|---|---|---|---|---|---|---|---|---|
| PLR | NLR | PPV | NPV | PLR | NLR | PPV | NPV | |
| BP ≥ 90th Percentile | ||||||||
| Ardissino et al. | 367.11 | 0.36 | 97.69% | 95.98% | 194.19 | 0.39 | 97.26% | 93.27% |
| Mitchell et al. | 4.32 | 0.04 | 33.21% | 99.59% | 6.36 | 0.03 | 53.77% | 99.45% |
| Kaelber et al. | 8.31 | 0.03 | 48.92% | 99.64% | 11.14 | 0.03 | 67.06% | 99.49% |
| Lu et al. | 3.93 | 0.25 | 31.16% | 97.19% | 23.27 | 0.20 | 81.03% | 96.41% |
| Somu et al. | 262.38 | 0.42 | 96.80% | 95.43% | a | 0.49 | 100% | 91.82% |
| BP ≥ 95th Percentile | ||||||||
| Ardissino et al. | 61.41 | 0.10 | 79.54% | 99.36% | 37.59 | 0.08 | 76.71% | 99.27% |
| Mitchell et al. | 3.70 | 0.05 | 18.96% | 99.68% | 4.40 | 0.04 | 27.83% | 99.63% |
| Kaelber et al. | 6.05 | 0.05 | 27.71% | 99.66% | 6.06 | 0.04 | 34.71% | 99.66% |
| Lu et al. | 4.10 | 0.11 | 20.60% | 99.33% | 11.41 | 0.05 | 50.00% | 99.53% |
| Somu et al. | 64.92 | 0.16 | 80.43% | 99.00% | 74.16 | 0.15 | 86.67% | 98.71% |
BP, blood pressure; NLR, negative likelihood ratio; PLR, positive likelihood ratio; NPV, negative predictive value; PPV, positive predictive value.
Many records were excluded from the analysis due to lack of complete data. This fact is relatively common in studies using this type of source. However, even after exclusions, a significant sample for the study was obtained, allowing an effective comparison between the screening methods.
Another factor that should be highlighted is the high prevalence of abnormal levels of BP (9.78% of children and 15.93% of adolescents). This is due to two main factors: the method of study based on a single measurement and the location where the data were obtained. In relation to the single measurement, it was demonstrated that studies based on this method have a high prevalence of abnormal BP levels, which tends to decrease with multiple measurements.12 As for the site of data collection, it was a pediatric cardiology clinic, where children are usually referred due to hypertension. This might increase the number of children with BP disorders when compared to the general population.
BP measurement in children is recommended from 3 years of age.10 The identification of the child as pre-hypertensive suggests lifestyle modifications to prevent future hypertension, whereas the diagnosis of hypertension may indicate drug treatment and investigation of secondary causes. In this study, children younger than 5 years were excluded to allow comparison with the ratio between BP and height, as cutoff points have yet to be described for this age group.
In this study, BP measurement according to a recent guideline10 was considered the gold standard. However, there are other, more efficient methods for the detection of SAH (such as ambulatory BP monitoring - ABPM), but they generally are expensive and are reserved for specific cases, rather than being used with regard to populations. However, even though it most often requires only low technology, the underdiagnosis of hypertension in children and adolescents is frequently observed.3 A primary factor for such occurrence is the need to associate several tables of percentiles, which is more time-consuming and, thus, usually disregarded considering the relatively low prevalence of hypertension in the pediatric population. In an attempt to simplify the diagnosis of BP disorders, several methods have been proposed for the screening of these conditions.4,6–8
This study compared five of these methods. Three are based on the use of simplified tables; one uses mathematical equations and the other, the ratio between BP and height. The latter was first proposed by Lu,4 but used the values proposed by Guo.11 That was due to the presence, in the latter, of cutoffs established for the age group of 5 to 13 years and cutoffs for pre-hypertension.
The tables proposed by Mitchell et al. and Kaelber have the same principle, i.e., they seek correlate a threshold for SBP and DBP according to age and gender. The difference is that the first has a smaller number of variables, as it covers three-year intervals. The latter determines SBP and DBP thresholds for each year according to the gender. Thus, one can expect lower specificity in the table proposed by Mitchell et al., a fact noted in Table 3.
On the other hand, the table proposed by Ardissino seeks to correlate height with SBP and DBP threshold according to gender. It can be observed that all described tables eliminate one of the utilized variables. Mitchell et al. and Kaelber eliminated height, while Ardissino eliminated age. However, the sensitivity of the latter was much lower when compared to the other methods that used tables in both age groups.
This fact, however, is not associated with the choice of the variable height, but with the use of definitions proposed in a previous guideline,13 published in 1996. In this guideline, BP between the 90th and the 95th percentiles was considered high-normal, with abnormal results considered only above the 95th percentile. Thus, the table proposed by Ardissino uses the values situated in this percentile as minimum BP for positive screening. This fact also explains the increased sensitivity, specificity, and accuracy of this table when considering the identification of hypertensive BP levels.
A similar fact occurred with Somu's equations. They were created based on a regression analysis of the 95th BP percentile, considering the 50th percentile for height in both genders. Then, the equations establish the value for the 95th BP percentile based on age. According to the results shown in Table 3, it can be observed that this method has very low sensitivity in identifying pre-hypertension, which was not observed with hypertension.
As for the ratio between BP and height proposed by Lu, it was the most recently proposed method, and has been gradually validated in several populations.14–16 It has shown good sensitivity levels in both age groups, both for the diagnosis of pre-hypertension as well as for SAH, demonstrating to be a good screening tool. However, its specificity has shown unsatisfactory levels in children, which greatly decreases its accuracy in these patients. It is important keep in mind that although a good screening test should have a high level of sensitivity, misdiagnosis can lead to psychological implications for patients and their caregivers.17 This fact should be considered, especially when there are methods available with similar sensitivities and distinct specificities, a situation in which the higher specificity method should be preferred.
When the results of different screening methods are considered, it is observed that the tables proposed by Kaelber and Mitchell et al. show better results in the identification of pre-hypertension levels in children, with better performance of the former. In adolescents, in turn, the ratio between BP and height shows similar results.
When identifying hypertensive levels, however, all methods demonstrated satisfactory results, with the ratio between BP and height more effective in adolescents than in children. The table proposed by Mitchell et al., in this case, showed the lowest accuracy in both groups.
Considering only these results, it can be concluded that the table proposed by Kaelber shows the best sensitivity and accuracy for use in the screening for pre-hypertension and SAH. However, the need to use a pre-defined table can be a hindrance to the performance of the screening. In this context, the ratio between BP and height can be considered a viable option in adolescents. Another advantage of this method is that it requires the memorization of few cutoffs, and thus, its use is possible without a specific device.
Additionally, it should be remembered that these screening tests are used to facilitate the identification of children and adolescents with BP disorders. Therefore, it is strongly recommended to use these tests to identify pre-hypertensive and elevated BP levels, with subsequent confirmation of positive results with the percentile tables. In this manner, an efficient screening is guaranteed, followed by adequate treatment.
Therefore, consistent with the aforementioned evidence, it can be concluded that screening should focus on identifying pre-hypertension or elevated BP levels. The best methods for that purpose are the tables proposed by Kaelber and Mitchell et al. for children, whereas the ratio between BP and height shows very good results in adolescents. Additionally, the latter requires the memorization of few cutoffs, which is an advantage for its use.
Conflicts of interestThe authors declare no conflicts of interest.
Please cite this article as: Mourato FA, Lima-Filho JL, Mattos SS. Comparison of different screening methods for blood pressure disorders in children and adolescents. J Pediatr (Rio J). 2015;91:278–83.


