
To investigate the risk of adverse perinatal outcomes in women aged ≥41 years relatively to those aged 21–34.
MethodsApproximately 8.5 million records of singleton births in Brazilian hospitals in the period 2004–2009 were investigated. Odds ratios were estimated for preterm and post-term births, for low Apgar scores at 1min and at 5min, for asphyxia, for low birth weight, and for macrosomia.
ResultsFor pregnant women ≥41, increased risks were identified for preterm births, for post-term births (except for primiparous women with schooling ≥12 years), and for low birth weight. When comparing older vs. younger women, higher educational levels ensure similar risks of low Apgar score at 1min (for primiparous mothers and term births), of low Apgar score at 5min (for term births), of macrosomia (for non-primiparous women), and of asphyxia.
ConclusionAs a rule, older mothers are at higher risk of adverse perinatal outcomes, which, however, may be mitigated or eliminated, depending on gestational age, parity, and, especially, on the education level of the pregnant woman.
Investigar o risco de resultados perinatais adversos em mulheres ≥ 41 anos de idade relativamente àquelas com idade 21-34.
MétodosCerca de 8,5 milhões de registros de nascimentos únicos em hospitais brasileiros no período 2004-2009 foram investigados. Odds ratios foram estimados para nascimentos prematuros e pós-termo, baixos índices de Apgar no 1° e 5° minutos, asfixia, baixo peso ao nascer e macrossomia.
ResultadosPara as mulheres grávidas ≥ 41, aumento de riscos foram identificados para nascimentos prematuros, partos pós-termo (com exceção de primíparas com escolaridade ≥ 12 anos) e baixo peso ao nascer. Relativamente a mulheres mais velhas vs. mais jovens, maiores níveis de escolaridade garantem riscos semelhantes de baixo índice de Apgar no 1° minuto (para primíparas e nascimentos a termo), de baixo índice de Apgar no 5° minuto (para nascimentos a termo), de macrossomia (para não primíparas) e de asfixia.
ConclusãoEm geral, mães mais velhas estão sob maiores riscos de desfechos perinatais adversos, mas estes são minimizados ou eliminados dependendo da idade gestacional, da paridade e, em especial, da escolaridade da gestante.
For a number of social and medical reasons, such as career-related delays and the possibility of assisted fertilization, an increasing number of women wait until age 40 or greater before motherhood.1,2 For instance in Brazil, births among women ≥41 years old accounted for 1.75% of the live births in 1994, while, in 2009, this number was 2.22% – a relative increase of 27%.3 Therefore, the risks to the newborn associated with older age have been a matter of growing interest. However, the effects of advanced maternal age on newborn vitality and weight and on gestational age are still not well determined, with sometimes conflicting reports.4–14
Adverse perinatal outcomes can compromise the health and/or development of the newborn. The Apgar score at 5min, for example, is considered a predictor of neurological health and cognitive development of a child,15–17 and the association of low score (≤6 out of 10 points) with perinatal mortality, cerebral palsy, mental retardation, epilepsy, and low school performance has also been reported.15–21
The objective of the present work was to investigate the risk of adverse perinatal outcomes in women ≥41 years old relatively to those between 21 and 34 years, according to gestational age, primiparity, and the educational level of the mother. The analyzed outcomes were: birth in a gestation shorter than 37 weeks and longer than 41 weeks, low Apgar score at 1min, asphyxia, low Apgar at 5min, low birth weight, and macrosomia. To this end, a population-based cross-sectional study was performed using data from births in Brazil, 2004–2009.
Materials and methodsData comprised records of live births in Brazilian hospitals, 2004 to 2009. Only singleton pregnancies were studied, with mothers between 21 and 34 years or ≥41 years old. Data were obtained from the Information System (SINASC) of the Brazilian Ministry of Health,3,22 which makes available information on pregnant women, pregnancy, newborn care, and childbirth for all live births in the country. The analyzed characteristics were: age, maternal education level (years of education), number of previous live births and stillbirths, number of prenatal visits, gestational age (weeks), Apgar score at 1 and 5min, and weight at birth (grams). Based on the number of previous children (living and/or dead), a “primiparity” variable was created, indicating whether the pregnancy was the mother's first. Variables were categorized as: (i) age: 21–34 and ≥41 years; (ii) primiparity: yes or no; (iii) education level: <12 and ≥12 years; (iv) number of prenatal visits: 0–6 and ≥7; (v) gestational age: <37 (preterm), 37–41 (term) and >41 (post-term); (vi) Apgar score at 1min: 0–3 (low Apgar score at 1min) and ≥4; (vii) Apgar score at 5min: 0–4 (asphyxia) and ≥5; and 0–6 (low Apgar score at 5min) and ≥7; (viii) newborn weight: <2500g (low birth weight), 2500–4000g, and >4000g (macrosomia).
To quantify the risks associated with each perinatal outcome, odds ratios (OR) were estimated, together with their 95% confidence intervals (95% CIs).23 Different scenarios for risk assessment were considered, taking into account the gestational age, the primiparity, number of prenatal visits, and the educational level of the mother. With regard to the preterm and post-term outcomes, the reference category for the ORs was term births (gestational period 37–41 weeks); with regard to low birth weight and macrosomia, the reference was 2500–4000g. The study was analyzed and approved by the Escola de Enfermagem Anna Nery/Universidade Federal do Rio de Janeiro (EEAN/UFRJ) Institutional Review Board in 2010/April, under protocol 027/2010.
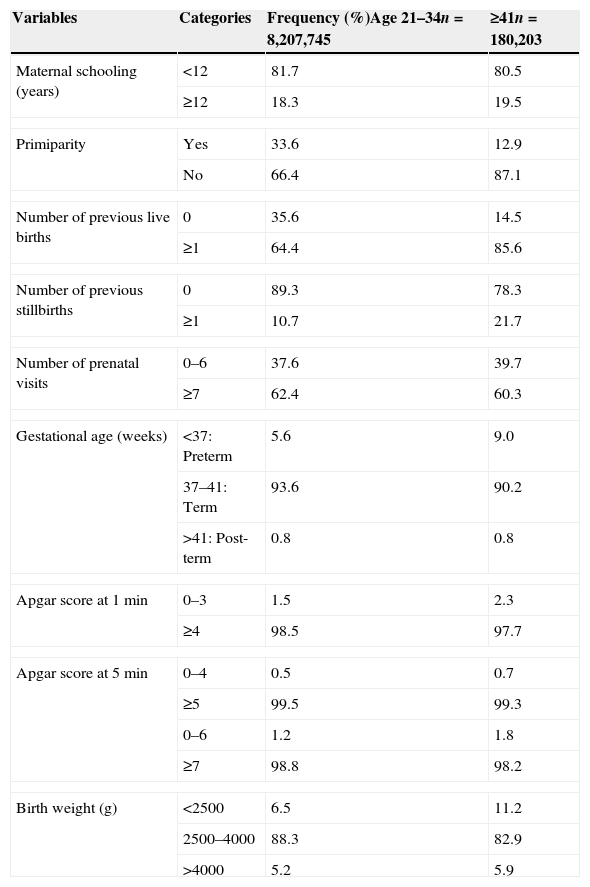
ResultsA total of 8,387,948 births were analyzed in the study. Table 1 shows the distribution of the maternal and newborn characteristics according to the two considered age groups. Irrespectively of age, most women had <12 years of education, seven or more pre-natal visits, and newborns with normal birth weight.
Maternal, pregnancy, and newborn characteristics according to age category in 8,387,948 live births, Brazil, 2004–2009.
| Variables | Categories | Frequency (%)Age 21–34n=8,207,745 | ≥41n=180,203 |
|---|---|---|---|
| Maternal schooling (years) | <12 | 81.7 | 80.5 |
| ≥12 | 18.3 | 19.5 | |
| Primiparity | Yes | 33.6 | 12.9 |
| No | 66.4 | 87.1 | |
| Number of previous live births | 0 | 35.6 | 14.5 |
| ≥1 | 64.4 | 85.6 | |
| Number of previous stillbirths | 0 | 89.3 | 78.3 |
| ≥1 | 10.7 | 21.7 | |
| Number of prenatal visits | 0–6 | 37.6 | 39.7 |
| ≥7 | 62.4 | 60.3 | |
| Gestational age (weeks) | <37: Preterm | 5.6 | 9.0 |
| 37–41: Term | 93.6 | 90.2 | |
| >41: Post-term | 0.8 | 0.8 | |
| Apgar score at 1min | 0–3 | 1.5 | 2.3 |
| ≥4 | 98.5 | 97.7 | |
| Apgar score at 5min | 0–4 | 0.5 | 0.7 |
| ≥5 | 99.5 | 99.3 | |
| 0–6 | 1.2 | 1.8 | |
| ≥7 | 98.8 | 98.2 | |
| Birth weight (g) | <2500 | 6.5 | 11.2 |
| 2500–4000 | 88.3 | 82.9 | |
| >4000 | 5.2 | 5.9 | |
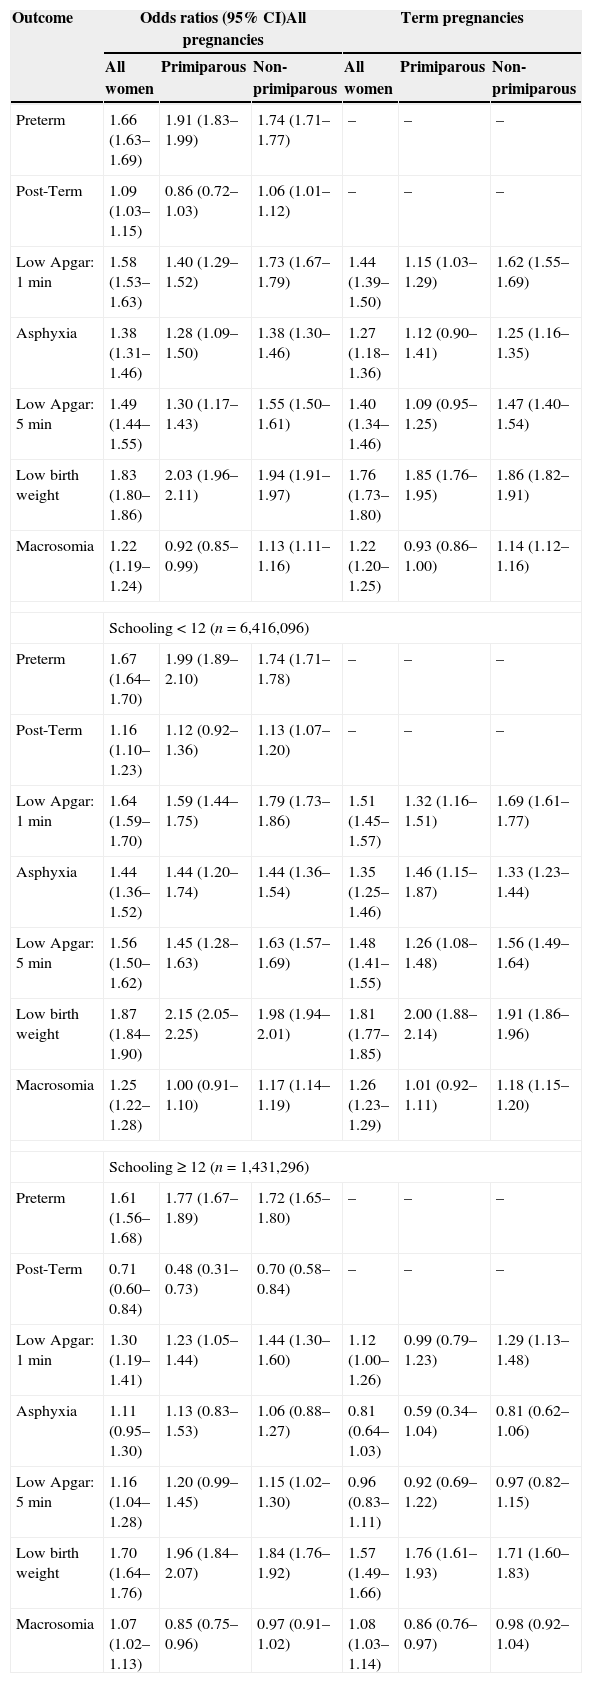
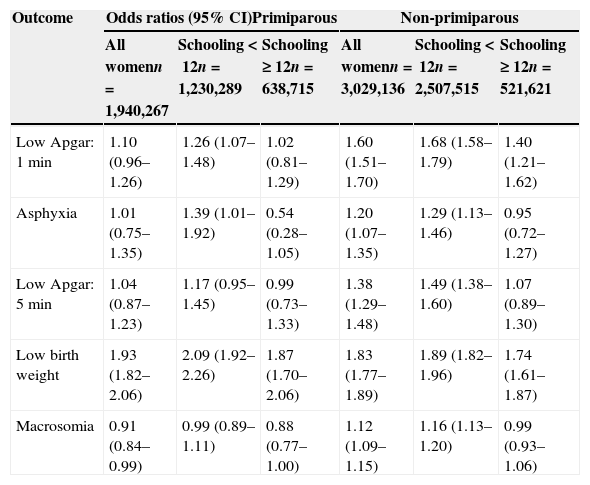
Table 2 shows the ORs for the adverse outcomes according to primiparity and level of education, considering all births and term births. In Table 3, only term pregnancies in which mothers had at least seven prenatal visits are considered. This table shows that, irrespectively of gestational age, a higher educational level allows older women to have a risk of adverse outcomes that is equal, or even smaller, than that of women in the younger group. In Table 3, the same effect may be seen for the non-primiparous group.
Odds-ratios for adverse outcomes in all pregnancies (n=8,378,948) and in term pregnancies (n=7,847,392), mothers ≥41 years old, according to primiparity and educational level, Brazil, 2004–2009. Reference category: age 21–34.
| Outcome | Odds ratios (95% CI)All pregnancies | Term pregnancies | ||||
|---|---|---|---|---|---|---|
| All women | Primiparous | Non-primiparous | All women | Primiparous | Non-primiparous | |
| Preterm | 1.66 (1.63–1.69) | 1.91 (1.83–1.99) | 1.74 (1.71–1.77) | – | – | – |
| Post-Term | 1.09 (1.03–1.15) | 0.86 (0.72–1.03) | 1.06 (1.01–1.12) | – | – | – |
| Low Apgar: 1min | 1.58 (1.53–1.63) | 1.40 (1.29–1.52) | 1.73 (1.67–1.79) | 1.44 (1.39–1.50) | 1.15 (1.03–1.29) | 1.62 (1.55–1.69) |
| Asphyxia | 1.38 (1.31–1.46) | 1.28 (1.09–1.50) | 1.38 (1.30–1.46) | 1.27 (1.18–1.36) | 1.12 (0.90–1.41) | 1.25 (1.16–1.35) |
| Low Apgar: 5min | 1.49 (1.44–1.55) | 1.30 (1.17–1.43) | 1.55 (1.50–1.61) | 1.40 (1.34–1.46) | 1.09 (0.95–1.25) | 1.47 (1.40–1.54) |
| Low birth weight | 1.83 (1.80–1.86) | 2.03 (1.96–2.11) | 1.94 (1.91–1.97) | 1.76 (1.73–1.80) | 1.85 (1.76–1.95) | 1.86 (1.82–1.91) |
| Macrosomia | 1.22 (1.19–1.24) | 0.92 (0.85–0.99) | 1.13 (1.11–1.16) | 1.22 (1.20–1.25) | 0.93 (0.86–1.00) | 1.14 (1.12–1.16) |
| Schooling<12 (n=6,416,096) | ||||||
| Preterm | 1.67 (1.64–1.70) | 1.99 (1.89–2.10) | 1.74 (1.71–1.78) | – | – | – |
| Post-Term | 1.16 (1.10–1.23) | 1.12 (0.92–1.36) | 1.13 (1.07–1.20) | – | – | – |
| Low Apgar: 1min | 1.64 (1.59–1.70) | 1.59 (1.44–1.75) | 1.79 (1.73–1.86) | 1.51 (1.45–1.57) | 1.32 (1.16–1.51) | 1.69 (1.61–1.77) |
| Asphyxia | 1.44 (1.36–1.52) | 1.44 (1.20–1.74) | 1.44 (1.36–1.54) | 1.35 (1.25–1.46) | 1.46 (1.15–1.87) | 1.33 (1.23–1.44) |
| Low Apgar: 5min | 1.56 (1.50–1.62) | 1.45 (1.28–1.63) | 1.63 (1.57–1.69) | 1.48 (1.41–1.55) | 1.26 (1.08–1.48) | 1.56 (1.49–1.64) |
| Low birth weight | 1.87 (1.84–1.90) | 2.15 (2.05–2.25) | 1.98 (1.94–2.01) | 1.81 (1.77–1.85) | 2.00 (1.88–2.14) | 1.91 (1.86–1.96) |
| Macrosomia | 1.25 (1.22–1.28) | 1.00 (0.91–1.10) | 1.17 (1.14–1.19) | 1.26 (1.23–1.29) | 1.01 (0.92–1.11) | 1.18 (1.15–1.20) |
| Schooling≥12 (n=1,431,296) | ||||||
| Preterm | 1.61 (1.56–1.68) | 1.77 (1.67–1.89) | 1.72 (1.65–1.80) | – | – | – |
| Post-Term | 0.71 (0.60–0.84) | 0.48 (0.31–0.73) | 0.70 (0.58–0.84) | – | – | – |
| Low Apgar: 1min | 1.30 (1.19–1.41) | 1.23 (1.05–1.44) | 1.44 (1.30–1.60) | 1.12 (1.00–1.26) | 0.99 (0.79–1.23) | 1.29 (1.13–1.48) |
| Asphyxia | 1.11 (0.95–1.30) | 1.13 (0.83–1.53) | 1.06 (0.88–1.27) | 0.81 (0.64–1.03) | 0.59 (0.34–1.04) | 0.81 (0.62–1.06) |
| Low Apgar: 5min | 1.16 (1.04–1.28) | 1.20 (0.99–1.45) | 1.15 (1.02–1.30) | 0.96 (0.83–1.11) | 0.92 (0.69–1.22) | 0.97 (0.82–1.15) |
| Low birth weight | 1.70 (1.64–1.76) | 1.96 (1.84–2.07) | 1.84 (1.76–1.92) | 1.57 (1.49–1.66) | 1.76 (1.61–1.93) | 1.71 (1.60–1.83) |
| Macrosomia | 1.07 (1.02–1.13) | 0.85 (0.75–0.96) | 0.97 (0.91–1.02) | 1.08 (1.03–1.14) | 0.86 (0.76–0.97) | 0.98 (0.92–1.04) |
Odds-ratios for adverse outcomes in term pregnancies (n=4,969,403), mothers ≥41 years old and at least seven pre-natal visits; according to primiparity and educational level, Brazil 2004–2009. Reference category: age 21–34.
| Outcome | Odds ratios (95% CI)Primiparous | Non-primiparous | ||||
|---|---|---|---|---|---|---|
| All womenn=1,940,267 | Schooling<12n=1,230,289 | Schooling≥12n=638,715 | All womenn=3,029,136 | Schooling<12n=2,507,515 | Schooling≥12n=521,621 | |
| Low Apgar: 1min | 1.10 (0.96–1.26) | 1.26 (1.07–1.48) | 1.02 (0.81–1.29) | 1.60 (1.51–1.70) | 1.68 (1.58–1.79) | 1.40 (1.21–1.62) |
| Asphyxia | 1.01 (0.75–1.35) | 1.39 (1.01–1.92) | 0.54 (0.28–1.05) | 1.20 (1.07–1.35) | 1.29 (1.13–1.46) | 0.95 (0.72–1.27) |
| Low Apgar: 5min | 1.04 (0.87–1.23) | 1.17 (0.95–1.45) | 0.99 (0.73–1.33) | 1.38 (1.29–1.48) | 1.49 (1.38–1.60) | 1.07 (0.89–1.30) |
| Low birth weight | 1.93 (1.82–2.06) | 2.09 (1.92–2.26) | 1.87 (1.70–2.06) | 1.83 (1.77–1.89) | 1.89 (1.82–1.96) | 1.74 (1.61–1.87) |
| Macrosomia | 0.91 (0.84–0.99) | 0.99 (0.89–1.11) | 0.88 (0.77–1.00) | 1.12 (1.09–1.15) | 1.16 (1.13–1.20) | 0.99 (0.93–1.06) |
The main objective of this study was to investigate the risk of adverse perinatal outcomes in pregnant women ≥41 years old, especially taking into account the impact of schooling on these risks. To this end, records of approximately 8.5 million singleton live births in Brazilian hospitals 2004 to 2009 were used. SINASC, the live births information system used in this study, has been used in many epidemiological studies since its implementation in 1990s.22 The results clearly indicate that, in general, pregnant women ≥41 with a level of education above or equal 12 years have risks similar to those of women 21–34 years old.
Recent local evaluations concluded that the SINASC system is “an excellent source of information about births”24 and “a source of reliable data on the maternal-child population” (on the studied municipalities).25 However, SINASC is a nationwide database, and some limitations have been pointed out for the system. For instance, despite recent improvements, records with incomplete information are still common in many regions of the country.22 Another problem concerns the definitions of categories for the variables “number of prenatal visits” and “gestational age,” which limit research based on these data. The Ministry of Health, however, recently introduced new variables in the database, such as newborn presentation, gestational age in weeks, and number of previous c-sections/vaginal births. Once consolidated, these data will allow for a better characterization of pregnancy/childbirth in the country.
Concerning preterm births, an OR of 1.66 (1.63–1.69) was observed (Table 2), with a higher risk in primiparous women (OR: 1.91 [1.83–1.99]). Furthermore, increased schooling indicated a risk reduction in primiparous women only (OR: 1.77 [1.67–1.89]). Prior research4 with 670,000 mothers of age groups 20–29 and ≥40 years found a higher risk for older women, whether primiparous (OR: 1.7 [1.6–1.9]) or not (OR: 1.4 [1.3–1.5]). In another study evaluating 400 pregnant women ≥40 and 20–30 years,7 this risk was identified only in the primiparous group (OR: 4.06 [1.69–9.72]) (estimated from data). These results are in conflict with another study that showed similar risks in women ≥40 vs. those women 20–29 years, primiparous or not.6 Still another study,5 which investigated 1000 gestations, did not detect a higher risk for older women, with OR for women ≥40 vs. <20 years of 1.18 (0.29–4.84) (similar conclusions were obtained for women ≥35 vs. <35 years).10
Regarding post-term births, in Table 2 it can be seen that the OR between the two studied age groups was 1.09 (1.03–1.15), suggesting increased risks for older women, except for primiparous mothers (OR: 0.86 [0.72–1.03]). Schooling ≥12 years allows women ≥41 to have a lower risk (OR: 0.71 [0.60–0.84]), and this risk is minimum in primiparous women with schooling ≥12 (OR: 0.48 [0.31–0.73]). Previous research has not identified increased risks in women ≥40 versus 20–30 years when considering primiparity,7 even when 119,162 pregnancies including the age groups 20–29 and ≥40 years were studied (OR: 1.10 [0.99–1.23]).8 These results differ from findings of lower risk for older women (OR: 0.6 [0.5–0.7]), both for primiparous and non-primiparous.4 A posterior comparison, however, with 1,176,131 women of ages 20–24 and ≥35 years, identified increased risks for older women (OR: 1.67 [1.63–1.72]).9
Relatively to low Apgar score at 1min, Table 2 shows that the risk is higher in women ≥41, but decreases in term births (OR: 1.44 [1.39–1.50]) and is at a minimum in primiparous women (OR: 1.15 [1.03–1.29]). However, a level of education ≥12 years implies in similar risks among pregnant women ≥41 vs. 21–34 years (OR: 0.99 [0.79–1.23]). A higher prevalence of this outcome in primiparous women ≥40 compared to those 20–29 has been previously indicated,6 although the data provided in that study yielded a very wide 95%CI, with OR: 2.05 (0.24–17.41).
Asphyxia risk is higher in women ≥41 years (Table 2), except for those with education level ≥12 (in which case risks are similar); and the risk is smaller among term primiparous pregnancies (OR: 0.59 [0.34–1.04]). This risk has been previously detected in women ≥40 vs. 20–29 years, either primiparous (OR: 1.6 [1.4–1.8]) or not (OR: 1.5 [1.4–1.7]).4
Regarding low Apgar score at 5min, two previous studies did not find a higher risk in older women.6,7 However, those studies did not consider the problems that arise when assessing the Apgar score at 5min in preterm pregnancies.26,27 Among term pregnancies (Table 2), the risk is greater in the group ≥41 years, unless mothers have level of schooling ≥12 years (OR: 0.92 [0.69–1.22] and 0.97 [0.82–1.15] for primiparous and non primiparous, respectively).
With regard to low birth weight, it can be seen (Table 2) that the risk is higher in older mothers (OR: 1.83 [1.80–1.86]), decreasing in term pregnancies where the mother had schooling ≥12 years (OR: 1.57 [1.49–1.66]). Previous research using either the age groups 25–30 vs. ≥40 years (OR: 3.08 [1.19–7.97])12; ≥40 vs. 20–34 (OR: 1.64 [1.20–2.25]),13 or even 20–39 vs. ≥40 (OR: 1.6 [1.1–2.3])14 also found that this risk is higher in older women. Other researchers argue, however, that the risk is higher only for primipara7 or even that no risk is associated with maternal age and parity.28 An overall protective effect of educational level for the risk of low birth weight has also been reported.29
Concerning macrosomia, a higher risk has not been previously identified for older mothers.7,12,14 However, the present study found a higher risk in women ≥41 years, either considering all pregnancies (OR: 1.22 [1.19–1.24]) or term births (OR: 1.22 [1.20–1.25]), except if the mother is primiparous or has education ≥12 years.
The beneficial effect of educational level on the risk of adverse outcomes is still present even in a scenario that considers only term pregnancies with at least 7 prenatal visits (Table 3). In this case, the risk in women ≥41 years old is always decreased with increased educational level, implying levels similar to those of the 21–34 non-primiparous mothers.
It should be pointed out that the lack of consensus in the study of adverse perinatal outcomes is related to methodological problems that frequently are not adequately addressed in the literature. For example, the definition of a reference age may considerably affect the assessment of risks associated with older pregnancies. Additionally, the evaluation of subgroups within age groups needs an adequate sample size, with power enough to detect the supposed effects. Similar concerns can be raised for the estimation of risks that are based on models with many confounding factors.
Since the present study was based on a very large number of records of live births, more precise estimates for the risk of adverse perinatal outcomes in women ≥41 years could be obtained, with narrow confidence intervals. The results disagreed with the literature regarding preterm and post-term births, low Apgar scores at 1 and 5min, and macrosomia. In most studies, these risks either are not present or are only present in specific sub-groups.
The impact of educational levels over risks was clear. In general, a higher level of education for women ≥41 implied risks similar to, or even smaller than those of 21–34 year-olds. It is reasonable to suppose that this effect is due to both an indirect association with the outcome (e.g. economic factors) and to direct associations, for instance, regarding the ability of a pregnant woman to understand and follow medical guidelines. Evidently, the importance of clinical factors should not be ignored, but the analysis of socio-economic factors could allow for the development of public health strategies, including better identification of at-risk pregnancies.
Conflicts of interestThe authors declare no conflicts of interest.
Part of this work was supported by the FAPERJ (Fundação de Amparo à Pesquisa do Estado do Rio de Janeiro), CAPES (Coordenação de Aperfeiçoamento de Pessoal de Nível Superior), PROEx Program (Pró-reitoria de Extensão Universitária) and CNPq (Conselho Nacional de Desenvolvimento Científico e Tecnológico) agencies, to whom the authors thank.
Please cite this article as: Almeida NK, Almeida RM, Pedreira CE. Adverse perinatal outcomes for advanced maternal age: a cross-sectional study of Brazilian births. J Pediatr (Rio J). 2015;91:493–8.


