

Children's differences in moderate-to-vigorous physical activity levels are not at random. This study investigates the relevance of individual- and school-level characteristics in explaining these differences.
MethodsIn total, 307 children (154 girls) aged 5–10 years, from 19 Portuguese schools, were sampled. Height and weight were measured, and body mass index was calculated. Time spent in moderate-to-vigorous physical activity was measured by accelerometry. Gross motor coordination was assessed with the KörperkoordinationsTest für Kinder battery and socio-economic status was obtained via the school social support system. School characteristics were obtained with an objective school audit. A multilevel analysis was used as implemented in Stata 15.
ResultsSchools explained 18.2% of the total variance in moderate-to-vigorous physical activity, with the remainder being ascribed to children's distinct characteristics. Boys were more active (β=29.59±11.52, p<0.05), and having higher gross motor coordination levels (β=0.11±0.04, p<0.05) was positively associated with daily moderate-to-vigorous physical activity, whereas being older (β=−5.00±1.57, p<0.05) and having higher socio-economic status (β=−7.89±3.12, p<0.05) were negatively related with moderate-to-vigorous physical activity. From the school-level correlates, only playground dimension was significantly associated with moderate-to-vigorous physical activity levels. Children from schools with medium (40m2 to 69m2) and large playground dimensions (≥70m2) were less active than children with smaller playground dimensions (10m2 to 39m2).
ConclusionsVariation in school children's moderate-to-vigorous physical activity is mostly explained by their individual characteristics; school characteristics also play a role but to a smaller degree. Future intervention programs to change this behavior should be more personalized, emphasizing mostly individual-level characteristics.
As diferenças entre crianças na atividade física moderada a vigorosa não são aleatórias. Este estudo investiga a relevância das características em níveis individuais e escolares para explicar essas diferenças.
MétodosForam amostradas 307 crianças (154 meninas) entre 5 e 10 anos, de 19 escolas portuguesas. A estatura e o peso foram medidos e o índice de massa corporal foi calculado. O tempo gasto em atividade física moderada a vigorosa foi medido por acelerometria. A coordenação motora grossa foi avaliada com a bateria do Körperkoordinationstest für Kinder e o status socioeconômico foi obtido através do sistema de apoio social da escola. As características da escola foram obtidas através de uma auditoria escolar objetiva. Uma análise multinível foi utilizada como implantada no Stata 15.
ResultadosAs escolas explicaram 18,2% da variância total da atividade física moderada a vigorosa, com o restante atribuído às diferentes características das crianças. Os meninos foram mais ativos (β=29,59±11,52, p<0,05) e o fato de ter níveis mais altos de coordenação motora grossa (β=0,11±0,04, p<0,05) foi positivamente associado com a atividade física moderada a vigorosa diária. Os mais velhos (β=-5,00±1,57, p<0,05) e com maior status socioeconômico (β=-7,89±3,12, p<0,05) foram negativamente relacionados com a atividade física moderada a vigorosa. Com base nos correlatos a nível escolar, apenas a dimensão da área recreativa foi significativamente associada aos níveis de atividade física moderada a vigorosa. As crianças das escolas com área recreativa média (40 m2 a 69 m2) e grande (≥ 70 m2) foram menos ativas que as crianças com áreas recreativas com menores dimensões (10 m2 a 39 m2).
ConclusõesA variação na atividade física moderada a vigorosa de escolares é explicada principalmente por suas características individuais; as características da escola também desempenham um papel, mas em menor grau. Futuros programas de intervenção para mudar esse comportamento devem ser mais personalizados, enfatizar principalmente as características em nível individual.
Although it is recognized that children's moderate-to-vigorous physical activity (MVPA) is positively associated with health,1 academic performance,2 and cognition,3 there is evidence that physical activity levels are declining.4 Children's differences in MVPA are not at random, and there is an intensive search for markers that may help explain these differences in order to better inform the development of interventions.
Systematic reviews of the correlates of physical activity (PA) have identified biological, psychological, cognitive, social, and cultural correlates, and emotional and behavioral attributes and skills.5 For example, boys, normal weight children, and those with better gross motor coordination (GMC) tend to engage in more MVPA than girls, overweight/obese children, and those with lower GMC, respectively.6 However, children's socioeconomic status (SES) has shown different associations with MVPA. For example, Drenowatz et al.7 showed that low SES was associated with lower PA in children from the United States. On the other hand, Brazilian children with higher SES were less likely to meet MVPA guidelines,8 and the O’Donoghue et al.9 review examining SES and PA across the life course showed no significant associations in school-aged children.
Several studies have demonstrated sex differences in children's MVPA. For example, Troiano et al.10 reported that 6–11y old girls spent 75.2mind−1 in MVPA, whereas boys of the same age spent 95.4mind−1. A similar sex difference was shown by Moller et al.11 in Danish children aged 8–10y (∼150mind−1 and ∼170mind−1 for girls and boys, respectively). Additionally, Katzmarzyk et al.12 reported 52mind−1 for girls and 70mind−1 for boys in a multi-national sample of 9–11 year old children. Differences in MVPA levels across studies can be attributable to differences in sampling and study designs, as well as the use of different accelerometer methods and thresholds. Additionally, when considering MVPA variability within studies (i.e., MVPA standard-deviations) a wide range emerges – from 2 to 54min, indicating substantial inter-individual differences.10–12
The ecological model of human development was developed by Bronfenbrenner13 and a modified version was applied to the PA field by Sallis et al.14 This model of active living links individual, social, and physical environmental factors into four domains: recreation, transport, occupation, and household. A key feature is the inter-dependence of individual traits and environmental/context characteristics in explaining PA differences within a multilevel framework.14 Since children spend a large portion of their time at school, it is possible that school characteristics may explain some of the variation in MVPA. For example, Nielsen et al.15 showed that the number of play facilities positively influenced children's PA in New Zealand. Further, Gomes et al.,16 using Portuguese children's data, reported that school size, location, type of playground area, frequency of physical education (PE) classes, time for PE, and qualifications of the PE teacher were linked with their PA levels.
However promising, very few studies have considered joint facets of the ecological model and have used multilevel models as a statistical approach to investigate children's MVPA during their primary school years.16,17 Hence this study, using a multilevel modeling approach, had the following aims: (1) to determine how relevant school characteristics were in explaining differences in children's MVPA; (2) to investigate the differential effect sizes of child-level variables in explaining MVPA differences; and (3) to identify which school correlates were the most relevant in explaining differences in children's MVPA levels.
MethodsSampleThe sample for this study was from the Growth, Motor Development, and Cognition study, a research project with a mixed-longitudinal design carried out in the Vouzela region in the central area of Portugal. Briefly, this project investigated the dynamics of the relationship between physical growth, motor performance, GMC, behaviors, and cognition in children aged 4–11 years. All Vouzela children from 19 schools were invited to take part in the project and the response rate was ∼90%, resulting in an overall sample of 485 children. The present study included 307 children aged 5–10 years (153 boys, 154 girls) from 19 schools because it only considered those with complete PA data and GMC results (the GMC test battery assesses children from 5+ years of age). The analytic sample did not differ from the overall sample in basic anthropometric characteristics, nor in physical fitness performance (p>0.05). Written informed consent was obtained from parents or legal guardians, and the project was approved by the Vouzela School Directorate, the Vouzela Health Center, as well as the Ethics Committee of the University.
Child-level correlatesAnthropometryHeight was measured using a Holtain portable stadiometer (Holtain Ltd., Crymych, United Kingdom) with children without shoes and with the head positioned in the Frankfort plane. Weight was measured with a portable Tanita scale (Segmental Body Composition Analyser BC-418 MA; Tanita Corporation, Tokyo, Japan). Body mass index (BMI) was computed as [weight (kg)/height (m)2].
Gross motor coordinationGMC was assessed with the KörperkoordinationsTest für Kinder battery (KTK) developed by Kiphard and Schilling,18 consisting of four tests: walking backwards on a beam, hopping a height, jumping sideways, and moving sideways on boxes. In this study, a total KTK score was calculated from the sum of points from each test.
Physical activityChildren's MVPA was measured with ActiGraph GT3X+ accelerometers (ActiGraph, Pensacola, FL, USA), which were attached by an elastic waistband on the right hip, and worn during awake time, for at least seven consecutive days. Children were instructed to remove the device only when performing aquatic activities (i.e., showering, swimming) and during sleep. ActiLife® software (ActiLife, version 6.5.4, FL, USA) was used to download data immediately upon retrieval of each accelerometer, and data were included in the analysis if at least four days, with ≥10hd−1 of wear time, were available. Non-wear time was defined as any sequence of at least 20 consecutive minutes with zero activity counts. PA counts were reduced into PA intensity variables using the cut-points of Evenson et al.19 For the purpose of this study, only time spent in MVPA (all activities >574 counts/15s epochs) was used, and was averaged across a week.19
Socioeconomic statusChildren's SES was obtained by the school social support system based on the Ministry of Education directives. Children are divided into three levels according to their family's annual income: low (≤2934 €year−1), medium (2935 €year−1 to 5895 €year−1), and high (≥5896 €year−1). This system is the same across all public schools in Portugal. A dummy coded variable was created with low SES as the reference.
School-level correlatesInformation about school characteristics was obtained using an objective audit, a modified and locally adapted version of the healthy eating and PA modules of the healthy school planner designed by the Joint Consortium for School Health. The audit tool includes information on the following domains: (i) school characterization (number of children, number of teachers, and school setting [rural or semi-urban] according to the Portuguese National Statistics Institute); (ii) policies and practices for PA (specifically the existence, or not, of policies and practices issued by the state, school board, or any other government agency to promote PA, health, and well-being of students and that are organized by the school); (iii) school physical infrastructure (playground dimension (m2), multi-sports roofed dimension (m2), number of structures for PE and equipment available for PE; and (iv) PE class duration. The school audit was conducted by the research team in cooperation with the Vouzela city hall education department. Similar versions of the school audit were used in the Canadian School Health Action, Planning, and Evaluation System (SHAPES) as well as in the International Study of Childhood Obesity, Lifestyle, and the Environment (ISCOLE).
Data quality controlTo ensure data quality, the following procedures were used: (1) experienced researchers from the Laboratory of the Faculty of Sports, University, trained the data collection team; (2) a pilot study to assess the quality of data acquisition was carried out prior to data collection; (3) a sub-sample of children was re-assessed on random days to compute in-field reliability using the technical error of measurement (TEM) as well as an intraclass correlation coefficient (R): TEM=0.2cm for height and 0.1kg for weight; for GMC, R varied from 0.79 for moving sideways on boxes to 0.92 for walking backwards on a beam.
Statistical analysisDescriptive statistics are reported as means, standard deviations, and percentages, as appropriate. Differences between boys and girls were assessed with the t-test and chi-squared test using SPSS software (SPSS Statistics for Windows, version 24.0. NY, USA). Since the data were structurally dependent, i.e., children nested within schools, and given that the sample was small in terms of participants and schools, a multilevel model with a method for small-sample inference developed by Kenward and Roger20 was used, as implemented in Stata 15. Further, all parameters were estimated with the restricted maximum likelihood technique and all predictors were centered, as advocated.21 A “step by step” approach was used as follows: first, a null model (M0) with no predictors was used to determine how much of the total variation in children's MVPA was explained by the schools. Then, a new model (M1) including only child-level correlates (age, sex, BMI, GMC, SES, and wear time) as well as a sex-by-age interaction term was included to test for differences in boys’ and girls’ MVPA across age. In the last model (M2), school-level correlates were added (number of students, number of teachers, school setting, policies and practices for PA, playground dimension, multi-sports roofed, equipment for PE, quantity of PE infrastructures, and PE class duration). Since these are two-level models, random components are at the child and the school. The deviance statistic was used as a measure of model fit. Model comparison was done with the likelihood ratio test, as advocated,21 and the significance level was set at 0.05.
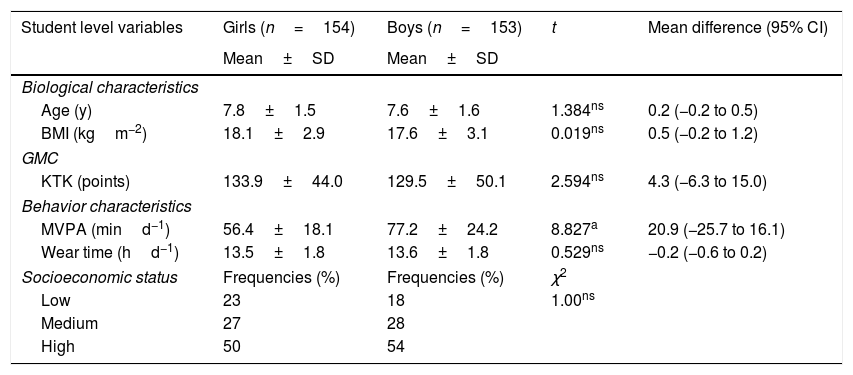
ResultsTable 1 provides descriptive statistics for the child-level variables. On average, no significant differences were found between girls and boys, with the exception of MVPA for girls being less active than boys, on average −20.9mind−1 (95% CI=−25.7 to −16.1).
Descriptive statistics for child-level variables.
| Student level variables | Girls (n=154) | Boys (n=153) | t | Mean difference (95% CI) |
|---|---|---|---|---|
| Mean±SD | Mean±SD | |||
| Biological characteristics | ||||
| Age (y) | 7.8±1.5 | 7.6±1.6 | 1.384ns | 0.2 (−0.2 to 0.5) |
| BMI (kgm−2) | 18.1±2.9 | 17.6±3.1 | 0.019ns | 0.5 (−0.2 to 1.2) |
| GMC | ||||
| KTK (points) | 133.9±44.0 | 129.5±50.1 | 2.594ns | 4.3 (−6.3 to 15.0) |
| Behavior characteristics | ||||
| MVPA (mind−1) | 56.4±18.1 | 77.2±24.2 | 8.827a | 20.9 (−25.7 to 16.1) |
| Wear time (hd−1) | 13.5±1.8 | 13.6±1.8 | 0.529ns | −0.2 (−0.6 to 0.2) |
| Socioeconomic status | Frequencies (%) | Frequencies (%) | χ2 | |
| Low | 23 | 18 | 1.00ns | |
| Medium | 27 | 28 | ||
| High | 50 | 54 | ||
BMI, body mass index; MVPA, moderate-to-vigorous physical activity; KTK, Köperkoordinations Test für Kinder battery; SD, standard deviation; ns, non-significant.
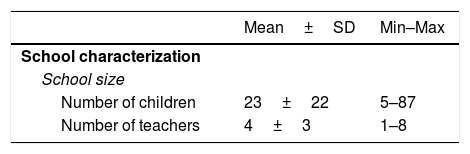
Table 2 shows school-level information. The number of students in schools ranged from five to 87, and the number of teachers ranged from one to eight; 63.2% of the schools were located in a rural region; 52.6% had policies and practices for PA; 68.4% of them had a large recreation space (≥70m2), and 73.7% had no multi-sports roofed complexes. 78.9% of schools had equipment for PE, and 88.9% only had one infrastructure for PE. Finally, in 68.4% of the schools, PE classes last 60min.
Descriptive statistics for school-level variables (n=19).
| Mean±SD | Min–Max | |
|---|---|---|
| School characterization | ||
| School size | ||
| Number of children | 23±22 | 5–87 |
| Number of teachers | 4±3 | 1–8 |
| n (%) | |
|---|---|
| School setting | |
| Rural | 12 (63.2) |
| Semi-urban | 7 (36.8) |
| Policies and practices for physical activity | |
| Policies and practices | 10 (52.6) |
| Only policies | 5 (26.3) |
| Only practices | 4 (21.1) |
| Physical structure of the school | |
| Playground dimension | |
| Small (10m2 to 39m2) | 2 (10.5) |
| Medium (40m2 to 69m2) | 4 (21.1) |
| Large (≥70m2) | 13 (68.4) |
| Multi-sports roofed facility dimension | |
| No multi-sports roofed facility available | 14 (73.7) |
| Small to medium (≤49m2) | 2 (10.5) |
| Large (≥50m2) | 3 (15.8) |
| Number of infrastructures for physical education | |
| One infrastructure | 15 (78.9) |
| Two infrastructures | 4 (21.1) |
| Equipment for physical education | |
| Yes | 15 (78.9) |
| No | 4 (21.1) |
| Physical education classes | |
| Physical education class duration | |
| 45 min | 6 (31.6) |
| 60 min | 13 (68.4) |
Results for the multilevel models are provided in Table 3 (detailed analyses are found in the supplementary file). The null model (M0) showed that school-level variables matter in explaining children's MVPA differences since the intraclass correlation was 18.2% (106.16/[106.16+478.12]); yet, 81.8% of the total variance in MVPA was explained by children's distinct characteristics, included or not included in the analysis. Further, the average child achieved 68.0minday-1 of MVPA. Model 1 (M1) included only child-level variables and fit the data significantly better than the M0 (χ2=162.84, with 8 degrees of freedom [df], p<0.001). In this model, the average girl achieved 43minday−1 of MVPA; on average, boys were more active (+30minday−1), and children with higher GMC obtained more minutes of MVPA (p<0.05). There was a significant decline in MPVA levels with age (∼5minyear−1), and those belonging to families with higher SES have lower MVPA levels than children with low SES (p<0.05). Further, children with longer accelerometer wear time tended to be, on average, more active (∼2minday−1). Additionally, the age-by-sex interaction was not statistically significant (p>0.05), meaning that the MVPA decline with age was similar for boys and girls. Model 2 (M2) added school-level variables and fit the data significantly better than M1 (χ2=77.1, with 12 df, p<0.001). In this model, and adjusted for all included covariates, the average girl now had a daily MVPA of 77min. However, child-level variables showed a similar trend as in M1, except that accelerometer wear time was not statistically significant (p>0.05) in this model. Out of the nine school-level variables, only playground dimension was statistically significant (p<0.05), suggesting that children from schools with larger playground dimensions tended to have lower MVPA levels.
Parameter estimates for fixed (children and school-level covariates) and random effects (children and schools), (±) standard-errors, and p-values for each of the three models.
| Parameters | Null model (M0) | p-Value | Model 1 | p-Value | Model 2 | p-Value |
|---|---|---|---|---|---|---|
| Regression coefficients (fixed effects) | ||||||
| Level-1 child level | ||||||
| Intercept | 68.00±2.90 | <0.001 | 42.98±9.35 | <0.001 | 76.66±25.14 | 0.002 |
| Age | −5.01±1.55 | 0.001 | −5.00±1.57 | 0.001 | ||
| Sex (boys) | 29.99±11.40 | 0.009 | 29.59±11.52 | 0.010 | ||
| Age-by-sex interaction | −1.28±1.44 | 0.375 | −1.24±1.45 | 0.394 | ||
| BMI (kgm−2) | −0.37±0.41 | 0.364 | −0.39±0.41 | 0.341 | ||
| KTK (points) | 0.11±0.04 | 0.011 | 0.11±0.04 | 0.007 | ||
| SES (Med)a | −2.86±3.25 | 0.379 | −2.62±3.34 | 0.432 | ||
| SES (High) | −7.77±3.02 | 0.010 | −7.89±3.12 | 0.012 | ||
| Wear time (hd−1) | 1.50±0.63 | 0.018 | 1.26±0.60 | 0.050 | ||
| Level-2 school level | ||||||
| No. of students | 0.42±0.44 | 0.343 | ||||
| No. of teachers | −3.62±2.86 | 0.206 | ||||
| School setting (mixed) | −4.28±15.56 | 0.783 | ||||
| Existence of policies or/and practices for PA (policies)b | 9.89±18.56 | 0.594 | ||||
| Existence of policies or/and practices for PA (practices) | 14.26±9.64 | 0.139 | ||||
| Playground dimensions (medium)c | −30.64±14.77 | 0.038 | ||||
| Playground dimensions (large) | −31.33±12.47 | 0.012 | ||||
| Multi-sports roofed (≤49m2)d | −4.29±9.74 | 0.660 | ||||
| Multi-sports roofed (≥50m2) | 9.27±21.28 | 0.663 | ||||
| Material for physical education (no) | 5.64±5.75 | 0.327 | ||||
| Infrastructures for physical education (two) | −7.27±16.49 | 0.659 | ||||
| Duration of physical education classes (60min) | −6.56±12.06 | 0.589 | ||||
| Variance components (random effects) | ||||||
| School | 106.16±52.72 | 65.00±31.55 | 42.95±41.37 | |||
| Child | 478.12±39.83 | 336.73±28.51 | 337.70±28.70 | |||
| Deviance | 2784.78 | 2621.94 | 2544.84 | |||
| Number of estimated parameters | 3 | 11 | 23 | |||
PA, physical activity.
It was shown that 18.2% of the total variance in MVPA was attributed to the schools children attended. These results confirm those of a previous study in Portuguese children using questionnaire data, showing that schools were an important source of variability in total PA (36.0%).16 A recent report from Katzmarzyk et al.17 using multi-country data (children aged 9–11 years) indicated a substantial disparity across countries, with Canadian schools explaining only 5.7% of the variability in MVPA, while Kenyan schools explained 49.9%, and Portuguese schools participating in the study explained 6.7% of the variance in MVPA time. In contrast to these results, Kristensen et al.22 reported an intraclass correlation close to zero in a Danish sample. These discrepancies in explained variance attributable to the school may reflect disparities in school location and overall characteristics, neighborhood SES differences, site specificities within and between countries, as well as sampling at the school level.
A major finding of this study was that the main fraction of MVPA variance (81.8%) was explained by children's individual characteristics. Consistent with previous data, boys engaged in more MVPA than girls and age was negatively associated with MVPA.23 However, the MVPA decline with age was similar in boys and in girls, since age-by-sex interaction was not statistically significant, which is contrary to other findings.24
BMI was not significantly associated with MVPA in this sample. Although overweight and obesity are generally linked to children's PA levels,25 available studies show inconsistent results. For example, Kettner et al.26 reported higher MVPA levels in overweight/obese than in normal weight German children, whereas Page et al.27 indicated that obese children from the UK were significantly less active than their non-obese peers. These discrepancies may be associated with different ways to assess MVPA, as well as with the cut-points used to define overweight and obesity. There is emerging evidence showing that adequate GMC and/or mature motor skills are associated with higher levels of PA during childhood. The present results confirmed this association, as higher GMC was associated with higher levels of MVPA. It was also shown that children from families with higher SES were less active, which supports the results from a study of Brazilian children.8
When considering the school-level correlates, it was found that playground dimension was the only statistically significant predictor, but was negatively related to children's MVPA. It is possible that other factors related to the playground are more important in relation to MVPA, such as the play facilities contained in the playground, and the quality and safety of the play area. A recent study with a large multi-country sample showed similar results, i.e., children with access to playground or sport equipment tended to comply less with the 60-minute daily MVPA recommendations.28 On the contrary, a previous study using a multi-level approach to identify school-level predictors of self-reported PA in Portuguese children16 showed associations with school size (positively), school setting (urban less than rural), type of playground area (disadvantage for schools without play facilities), frequency of PE classes (positively), PE class duration (negatively), and qualification of PE teachers (with qualification less than without qualification). Moreover, three other studies that explored associations between school contexts and children's MVPA did not explicitly consider the importance of children's individual characteristics.15,29 In summary, Nielsen et al.15 reported that the number of permanent facilities was positively associated with MVPA, whereas Lewis et al.29 indicated that the presence of a sports field was negatively associated with MVPA. In general, the existing studies have demonstrated that school-level characteristics explain a significant proportion of the variance in children's MVPA; however, the specific variables and direction of association varies among studies, which may be related to interactions among variables at the school- and child-levels.
This study is not without limitations. First, it is possible that the school audit may have overlooked relevant school characteristics; however, the authors mapped the most important characteristics commonly identified in prior research.30 Second, the use of total daily MVPA rather than its daily fragments (i.e., before, during, and after school) may not have been sensitive enough to detect school effects. It is important to keep in mind that this study did not investigate daily PA patterns, and that total daily MVPA is the most commonly used variable in this type of research. Third, care must be taken when trying to generalize these results to the Portuguese population of this age range. This study also had several strengths: first, the use of multilevel models with information at both the child and school levels; second, this study sampled children aged 5–11 years, which corresponds to an important time window in their growth and development; third, MVPA was objectively monitored using a device-based protocol; and fourth, data collection was based on highly standardized and reliable methods.
In conclusion, 18.2% of children's differences in MVPA were related to the schools they attended, leaving the majority of the variance explained by child-level characteristics. Sex, age, GMC, and SES were significantly, but differently, associated with children's MVPA. Within the school context, only playground dimension was associated, negatively, with children's MVPA. In sum, children's characteristics were more important than their school contexts in explaining variability in MVPA, although a significant proportion of the variance was explained by schools.
FundingCity council of Vouzela.
Conflicts of interestThe authors declare no conflicts of interest.
The following are the supplementary data to this article:
Please cite this article as: Pereira S, Reyes A, Moura-Dos-Santos MA, Santos C, Gomes TN, Tani G, et al. Why are children different in their moderate-to-vigorous physical activity levels? A multilevel analysis. J Pediatr (Rio J). 2020;96:225–32.
Study conducted at CIFI2D, Faculdade de Desporto, Universidade do Porto, Porto, Portugal.


