

To validate the Family Health Behavior Scale (FHBS) for Brazilian families.
MethodsThe sample included 272 children aged 5 to 12 years old. Caregivers and their healthy answered the FHBS and questions about physical activity. In addition, anthropometric measurements of the children's weight and height were performed, as well as the bioimpedance exam. The scale was translated and the following validities were assessed: content (qualitative analysis and content validity index), construct (factor analysis) and concurrent validity (difference between domains and the total score with the categories of BMI, fat percentage and physical activity). Reliability (Cronbach's alpha, ceiling-floor effect, two-half test, intraclass correlation and Bland – Altman) was also assessed.
ResultsFHBS instrument performed well with regard to the psychometric properties in the Brazilian population. The content validity index was 0.987. Fit indices of the factor analysis were considered satisfactory, according to Bartlett's sphericity test (χ 2 = 1927, df = 351; p < 0.001) and the Kaiser-Meyer-Olkin index (KMO = 0.789). Concurrent validity, the differences between the mean of the domains and the total score between the categories of BMI (p = 0.011), percentage of fat (0.004) and physical activity (p < 0.001) were all significant. The reliability results were Cronbach's alpha internal consistency = 0.83, adequate ceiling-floor effect, 0.8105 (0.09 SD) two-half test, 0.626 intraclass correlation (95% CI: 0.406 to 0.777) and Bland – Altman -0.840 (-22.76 to 21.07).
ConclusionThe FHBS adapted for the Brazilian population showed evidence of adequate psychometric performance.
The prevalence of childhood obesity has increased considerably in recent years and has become a public health problem worldwide. The main cause of obesity is the result of a positive energy balance with social, behavioral, and environmental determinants.1 In children and adolescents, obesity is associated with high blood pressure and abnormal fasting glucose, dyslipidemia, obstructive sleep apnea, depression, and low quality of life in general.2
Environmental factors contribute considerably to an obesogenic lifestyle such as the ingestion of high-energy-density foods and, low levels of physical activity, and a sedentary lifestyle. One of the foundations of childhood obesity prevention is considering the contribution of family behavior to development of obesity. Parents who have healthy lifestyles help to facilitate their children's adoption of healthy habits by encouraging family mealtime routines, creating access to a healthy food environment, and supporting healthy physical activity and screen time habits.3,4 Although there are already some instruments developed to assess the family's health behavior, the available instruments generally focus on the family's health and well-being5; or measure the quality of the diet, assessing the frequency of consumption of certain food groups6;or focus on child physical activity habits. 7 Comprehensive questionnaires targeting all the preceding domains are limited.
The Family Health Behavior Scale (FHBS) is one of the very few comprehensive scales available and that addresses concomitantly children's dietary habits, physical activity and parenting practices.
The FHBS consists of 27 items and includes the subscales to assess parental behavior, meal routines, physical activity, and children's behavior. The measure was originally created and validated in English in the United States (US)8 and later translated to Spanish and validated in Spain.9 The aim of the present study is to validate the Family Health Behavior Scale in Portuguese for use in Brazil.
MethodsStudy design and populationThis is a cross-sectional study following the Strobe checklist. Caregivers and their healthy community-dwelling children aged 5 to 12 years, of both sexes, were invited to participate in the study. Children were considered healthy if they had not been diagnosed with any chronic disease and were not on continuous medication. This study took place in public and private schools and sports centers in cities in southern Brazil.
This study was approved by the ethics committee of the Pontifícia Universidade Católica do Rio Grande do Sul – PUC/RS (CAAE: 81021317.9.0000.5336) and all children and their parents formally agreed to participate in the study. All parents provided informed consent and thechild's assent form.
The use of the scale in this study was authorized by the author who developed it.
Sample sizeThe sample size was calculated a-priori using a 10:1 ratio resulting in a sample of 270 participants.10
Data measuresFamily Health Behavior Scale (FHBS)Caregivers were interviewed by trained professionals. The original version of the FHBS includes 27 items covering four domains: assess parental behavior, meal routines, physical activity, and children's behavior. The answer categories ranged from 0 to 4, with 0 = almost never and 4 = almost always.8
Sociodemographic variablesSociodemographic variables were obtained by structured interviews and included age, sex, and self-reported skin color.
Physical activityTo assess the children's level of physical activity, caregivers answered a question regarding time spent daily on moderate- to vigorous-intensity physical activity: “Does your child practice moderate or intense physical activity every day?” and “How much time does your child practice moderate or intense physical activity every day?” Participants were classified as inactive or active according to the level of physical activity.11
Children's anthropometric and Bioelectrical impedance analysis (BIA) measurementsBody mass was measured with the participant in the standing position, with light clothing and no shoes, using a calibrated digital scale (Charder MS6121). Height using a Sanny compact stadiometer and a tape measure to the nearest 0.1 cm (American Medical do Brasil Ltda, São Bernardo do Campo, SP, Brazil). BMI was calculated by dividing weight (kg) per height square (m2), with the percentiles classified as underweight (< 5), healthy weight (> 5 and < 85), overweight (> 85 < 97), and obesity (≥ 97) according to the WHO BMI classification for children.12 Bioelectrical impedance analysis Multi-Frequency InBodyS10 (Ottoboni, Rio de Janeiro, RJ, Brazil) was used to assess fat percentage. Standard guidelines were followed for participants’ instructions before bioimpedance13 The percentage of body fat was classified with the percentiles and following cut-off points: low with the percentiles classified as low (< 5), healthy (≥ 5 and < 85), high (≥ 85 < 97), and excessively high (≥ 97).14
ValidationThe validation of the FHBS into Brazilian Portuguese was carried out in two phases, following the criteria proposed by the International Test Commission.15
Phase 1 - Translation
This phase was done in the following steps: (i) translation by two English – Brazilian Portuguese translators; (ii) harmonization between both Portuguese versions, resulting in a single version in Portuguese; (iii) back-translation of the harmonized version by two Brazilian Portuguese-English translators; (iv) harmonization between both translators, resulting in a single English version; and (v) general harmonization, where the versions resulting from the first and second harmonization were discussed by the four translators, to obtain a consensus version.15
Phase 2 - Field validation (testing psychometric properties)
Content validity
Twenty professionals participated in this stage, with five professionals from each of the following areas: psychology, medicine, nutrition, and physical education. The procedure to determine content validity was as follows: First, to improve the cultural adaptation of the translated terms, a qualitative evaluation was performed. Next, the Content Validity Index (CVI) was determined by evaluating the following characteristics of the translated scale: language clarity, practical relevance, theoretical relevance and theoretical dimension.16,17 The Portuguese version of the scale (supplementary material) was also evaluated concerning its content by means of a pilot qualitative study conducted in 10 families.
Construct validity
Construct validity was determined using exploratory factor and confirmatory factor analyses.
Confirmatory factor analysis (CFA) was used to confirm the initial four domains as determined in the original FHBS version.8 The authors complemented the CFA with an exploratory factor analyses to further examine the structure of the study's FHBS version.
CFA.16,18-23Exploratory factor analyses: The Promax rotation method and the Kaiser measure were used to assess the adequacy of the sample to a latent factorial structure.
Concurrent validity
Concurrent validity was assessed by comparing the FHBS scale with the following variables: percentile classification of the BMI, the percentage of body fat measured using bioimpedance, and the level of physical activity. Concurrent validity for the comparison between the means of the FHBS score and BMI, percentage of body fat, and physical activity classification were tested using ANOVA's with Tukey's post-hoc tests.8
Reliability
Reliability was assessed with Cronbach's α coefficient (α-C), the Spearman-Brown coefficient, the ceiling-floor effect, and test-retest reliability analysis. The Spearman-Brown coefficient was analyzed by the split-half method.24 The floor effect was determined by the percentage of the population that had the lowest score, and the ceiling effect would be the margin of the population that with the highest score. The retest evaluation was performed by a sample of 48 caregivers. Test-retest was assessed by the intraclass correlation (ICC) and the graphical approach of Bland–Altman to verify the agreement between the test-retest.25-28
Supplementary material complements the description of the methodology and results.
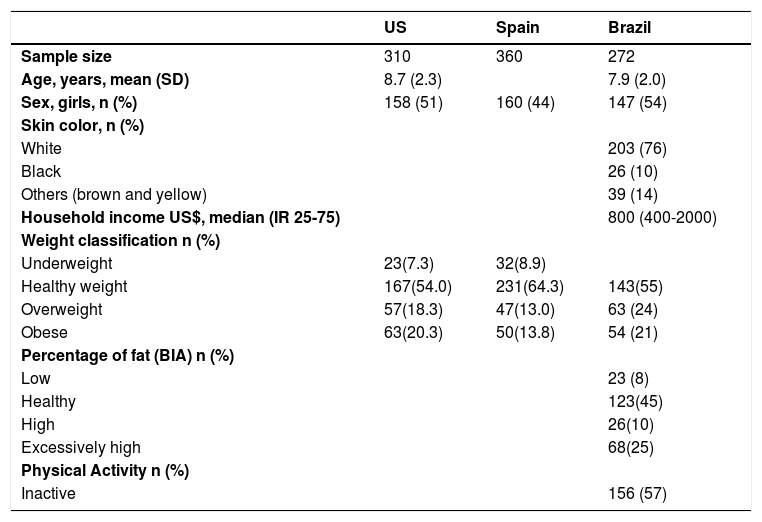
ResultsIn total, 295 children were eligible to participate in the study. However, 23 of the caregivers did not answer the questionnaire. Thus, the study's sample consisted of 272 children, with a mean age of 7.9 ± 2.0 years, with 147 (54%) girls. Regarding skin color, 203 individuals (76%) reported to be white, 26 individuals indicated to be (10%) black, and 39 (14%) indicated another skin color. The median monthly household income was US$800 (IQR25-75 400-2000). The total mean FHBS score was 72.3 (SD=12.6). According to BMI percentiles, most of the children were classified as having a healthy weight, 143 children (55%) were classified as having a healthy body fat percentage and 68 children (25%) had an excessively high percentage of body fat. Regarding physical activity, 156 children (57%) were considered inactive (Table 1). Table 1 also presents the characteristics of the participants included in the validation studies carried out in the United States and Spain.
Characteristics of the American, Spanish, and Brazilian sample.
IR25-75, Interquartile range; SD, standard deviation; BIA, Bioelectrical impedance analysis; US, United States.
Regarding content validity, the present study indicated that CVI values were adequate (0.98). Analyzing each item on the scale separately, the 20 professionals indicated that they totally agreed with the clarity of language, 15/20 (75%); the practical relevance, 16/20 (80%); the theoretical relevance, 19/20 (95%); and the theoretical dimension, 17/20 (85%).
The professionals chose the answers: “4 = partially agree or and 5 = totally agree”, for all questions. The 10 families that participated in the pilot study carried out the research without restrictions, all had no difficulty in answering the questions on the scale, where they declared good understanding and did not suggest changes to the questions in the questionnaire.
Construct validityFor the CFA, results for the verification of the theoretical factorial structure (four factors) were: Χ2: p < 0.0001, RMSEA = 0.084 (90% CI 0.077 to 0.091), SRMR = 0.101, GFI = 0.781, NFI = 0.591, CFI = 0.696, TLI = 0.664, and IFI = 0.702. According to the RMSEA (0.084, 95% CI 0.075 to 0.092) and SRMR (0.100) adjustment indexes, the factorial structure had a marginally acceptable fit in the present study.
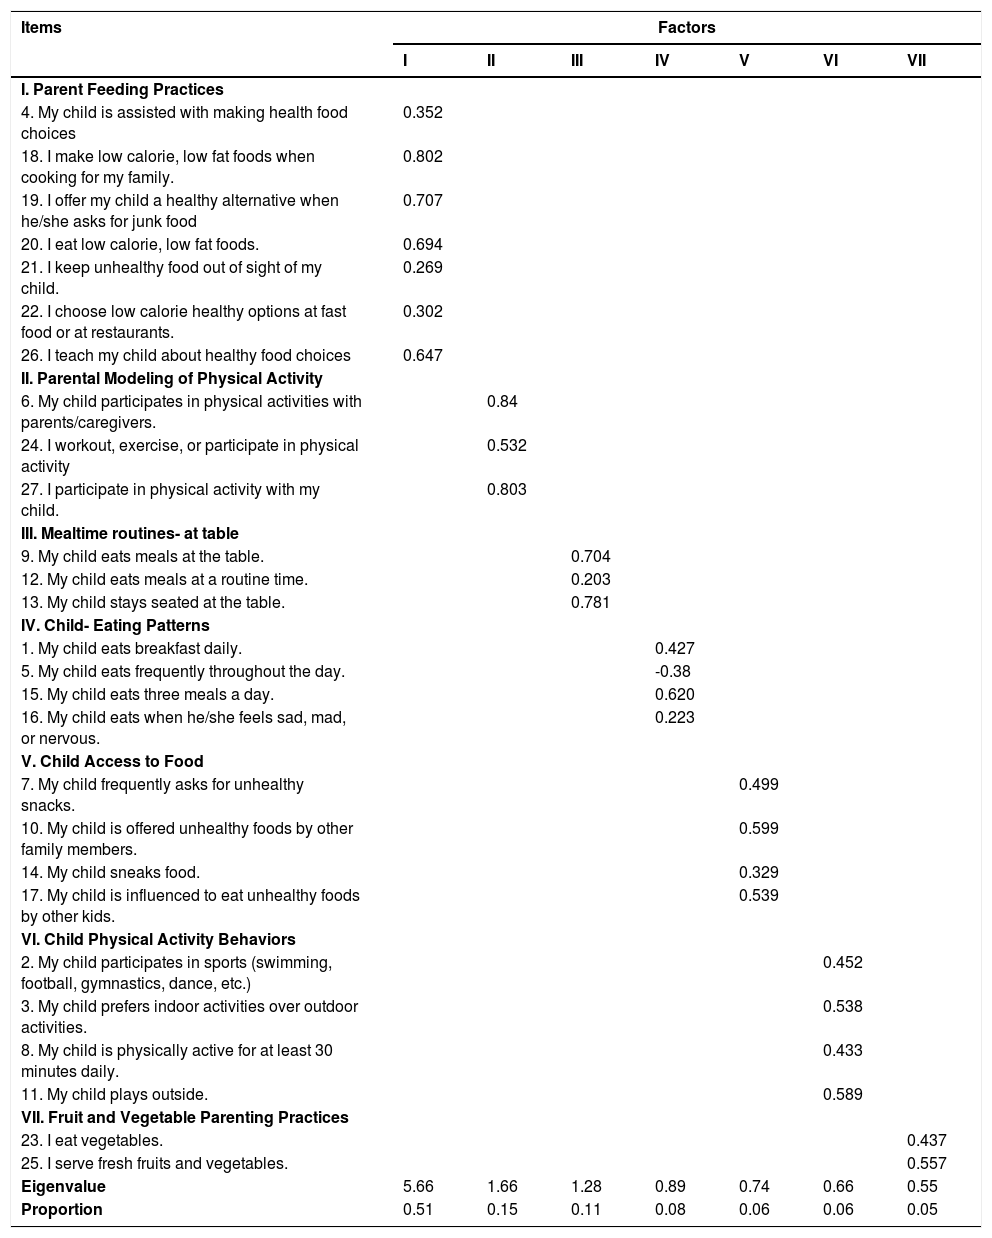
The exploratory factor analysis with seven items showed a good fit of the sample to a latent factorial structure according to the resulting value for the Kaiser measure (KMO = 0.788). The factorial loadings of the latent factor structure are shown in Table 2.
Exploratory Factor analysis with ProMax rotation factor loading for the FHBS.
The factor structure suggested in the exploratory factorial analysis was composed of a seven-factor model. In accordance with the new factor structure which resulted in more nuanced factors, the subscales were renamed to better represent the latent constructs. The final 7-factor structure yielded accounting for 100% of the explained variance (Table 2).
Concurrent validityThe comparison of means of the FHBS Total Score in relation to the BMI percentile categories revealed a significant difference for at least one of the three means (p = 0.01, F = 4.64, DF = 2, effect size (Partial Eta-Square) = 0.0417). The follow-up Tukey test identified that the mean Total Score of individuals that were classified as obese (67.0 ± 15.9 SD) had significantly lower FHBS scores than individuals who were in the healthy weight (73.6 ± 10.9 SD) and overweight categories (73.6 ± 12.4 SD).
The results of the comparison of the mean FHBS scores between fat percentage categories revealed a main effect of category (p = 0.038, F = 2.84, df = 3, effect size (Partial Eta-Square) = 0.0419). Follow-up Tukey tests revealed that children categorized as having a normal percentage of body fat group had higher FHBS scores than children who were in the excessively high body fat percentage group (74.18± 11.4 SD vs. 68.3 ± 14.1 SD).
The mean total FHBS score of the group classified as physically active (75.2 ± 11.04 SD) was significantly higher than the mean total score of the group classified as inactive (70.07 ± 13.7 SD) (p = 0.003, F = 8.57, df = 1, effect size (Partial Eta-Square) = 0.0388).
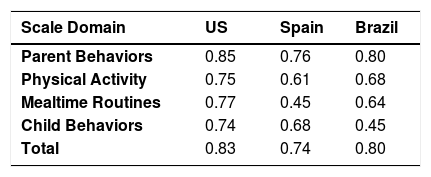
ReliabilityThe Cronbach's alpha coefficients showed adequate internal consistency for the FHBS total scale (α = 0.80) and values per domain range from 0.45 for the domain Child Behaviors to 0.80 for the domain parents Behaviors (Table 3). Table 3 also shows the comparison of FHBS Cronbach's alpha already validated in the US and Spain validation study.
However, the 7-factor structure, values per domain range from 0.008 for the domain child-eating patterns to 0.756 for the parent-feeding practices domain.
When the item “My child eats frequently throughout the day” was excluded, the value of the Cronbach's alpha coefficients increased to α = 0.820. None of the domains showed > 25% floor and ceiling effects.
The best estimate of the Spearman-Brown coefficient was 0.8105 (0.09 SD).
Forty-eight caregivers (19%) completed the questionnaire for a second time two weeks after initial administration. The test-retest reliability intraclass correlation coefficient was 0.626 (95% CI: 0.406 - 0.777), a value that could be interpreted as being just below the established cutoff point of 0.7.
Figure 1 showed the Bland-Altman graph of agreement with the mean difference and the 95% agreement limits of the test and retest. The average bias was -0.840, with the lower and upper limits of -22.76 to 21.07, respectively.
Discussion
The Family Health Behavior Scale, adapted for the Brazilian population, showed adequate psychometric properties when examining the factorial structure with seven factors.
The good psychometric performance of the study's version may stem from that the questions were easily understood. Also, the adjustments suggested by professionals working in areas related to family health behavior in the same way and by the following target audience could have contributed positively to the quality of the measure. The CVI analysis suggested that the professionals considered the final version of the scale adequate for the evaluation of family behavior and health.
The validation processes performed in the US (original scale)8 and Spain9 suggested that the scale was composed of the following factors: parental behavior, physical activity, meal routine, and childhood behaviors. However, in present study, the authors proposed seven factors: Parent Feeding Practices; Parental Modeling of Physical Activity; Mealtime routines at the table; Child- Eating Patterns; Child Access to Food; Child Physical Activity Behaviors; Fruit and Vegetable Parenting Practices. The original scale also initially considered the factorial inclusion of five and six factors, but according to the authors' report, the structure with only four was forced.8
Most items remained in the factors as in the original study. The items for which the analysis suggested different domains were as follows: Item "My child follows a feeding routine," which had to be replaced by another factor, perhaps due to a lack of understanding of what “routine” meant, i.e., if there was a routine in terms of the children's mealtimes. Likewise, Item "My son hides food,” for which a possible reason could be, as above, the lack of understanding of this question among the participants who answered the scale, and Item "My child eats when he/she feels bored, sad, angry or nervous,” suggesting that this issue may not be relevant or well understood in the study's population. In addition, it is worth noting that this validity is subjective and that it is up to each professional to evaluate the content of each item.29
With regard to concurrent validity, higher total scores on the questionnaire were associated having a BMI classified as healthy weight, having a healthy body fat percentage, and meeting physical activity guidelines for 60 minutes of physical activity per day. These results suggest that the scale score in the evaluation of family health behaviors was associated with factors related to nutritional status and expected physical activity. In the validation studies of the scale in the USA8 and Spain,9 the concurrent validity with regard to BMI was similar to those obtained in the present study. Additionally, the current study provided complementary evidence for good concurrent validity by showing additional associations between FHBS scores and body fat percentage and physical activity level.
Regarding reliability, Cronbach's alpha values of the total score of the present study were considered adequate,25 as they were in the original8 and Spanish9 versions. The domains of mealtime routines and child behaviors had insufficient internal consistency, as they did in the validation study in Spain, suggesting the need to evaluate some items in these domains. 9 Cronbach's alpha increased in the total score when the authors excluded the question "My child eats frequently throughout the day". The preceding may be due to parents having difficulty conceptualizing the frequency of meals. The domain child-eating patterns had low Cronbach's alpha suggesting that this subscale or some of its items could be excluded. The ceiling-floor effect was also adequate, showing that there was no such effect in the scales answered. In relation to the test-retest reliability, the present study's results showed reasonable performance, but test-retest reliability for some domains was lower than expected. Although a very short or very long time can interfere with the final test-retest result, there is no clear consensus in the literature determining how much time should be between one intervention and another.30 A correlation between the test and the retest progressively decreases as the interval between applications increases. On the other hand, if the interval between the test-retest is very short, the result may be influenced by a learning effect. Specifically, the participant's ratings on the scale two weeks after initial administration may be influenced by the participant's memory.30 Future studies are needed to test the re-test reliability over a longer time interval.
The present study is not without limitations. Due to the sample size, the authors did not evaluate the Item Response Theory. However, even if the scale demonstrated a good performance overall, after the evaluation of the psychometric properties was performed it was possible to identify the limitations of some items. Another limitation is that all participants were recruited in Rio Grande do Sul and the authors do not include participants from other regions of Brazil. However, the authors included individuals of different socioeconomic levels to obtain a greater representation of the Brazilian population. Another limitation of this study is that the assessment of physical activity was not performed objectively. However, the results were associated with the anticipated results with the questionnaire, expecting children who are having a higher score on the FHBS scale to report higher levels of physical activity.
A strength of the study is that the authors followed the suggestions of the study of Spanish validation 9 and employed previously trained health professionals to collect anthropometric data. In addition to measures of weight and height, and unlike previous validation studies, the present study used the bioimpedance test to evaluate body fat percentage.
The Family Health Behavior Scale adapted for the Brazilian population showed evidence of adequate psychometric performance. the FHBS seems to be a promising tool to evaluate family health behaviors related to the prevention of childhood obesity in Brazil. Replication in independent samples is needed to further test the generalizability of the seven factors.
FundingJPM receives institutional support from the US Department of Agriculture, Agricultural Research Service (Cooperative Agreement no. 58– 6250–0-008) and is funded by Eunice Kennedy Shriver National Institute of Child Health & Human Development of the National Institutes of Health under Award Number R00HD091396. The content is solely the responsibility of the authors and does not necessarily represent the official views of the National Institutes of Health or the US Department of Agriculture, Agricultural Research Service. LB was supported by a career award from the Fonds de Recherche de Santé Québec.RM was supported by a career from Conselho Nacional de Desenvolvimento Científico e Tecnológico.
Fundação de Amparo à Pesquisa do Rio Grande do Sul (FAPERGS), the National Research Council of Brazil (CNPq) and Coordenação de Aperfeiçoamento de Pessoal de Nível Superior CAPES Finance Code 001.
Study conducted at Pontifícia Universidade Católica do Rio Grande do Sul (PUCRS), Porto Alegre, RS, Brazil.


