
To describe and analyze the trends of occurrence of underweight, overweight, and obesity in schoolchildren.
MethodsThis was a longitudinal study of trends conducted in a voluntary sample of Brazilian children and adolescents. The sample was grouped by year of collection (period I: 2005 and 2006; period II: 2007 and 2008, and period III: 2009-2011), age category (children: 7 to 10 years, and adolescents: 11 to 14 years), and stratified by gender. The body mass index was used to classify the nutritional profile. Trend analysis was verified using multinomial logistic regression (p<0.05).
ResultsMean occurrences were 2.11% for underweight, 22.27% for overweight, and 6.8% for obesity. There was a decrease of underweight in male adolescents from period I to II, as well as an increase in female children from period II to III. Regarding overweight, there was an increase followed by a decrease in male children. Regarding obesity, there was an increase from period I to II in all age groups and for both genders.
ConclusionThe prevalence of underweight was less than 5% in all categories of age and gender. However, the categories of overweight and obesity showed higher values, and together comprised almost 30% of the young Brazilian population; moreover, a trend toward increase in prevalence of obesity was observed up to the year 2008, followed by the maintenance of these high prevalence rates.
Descrever e analisar a tendência da ocorrência do baixo peso, sobrepeso e obesidade de escolares.
MétodosEstudo longitudinal de tendência realizado em uma amostra voluntária de crianças e adolescentes brasileiros. A amostra foi agrupada em ano de coleta (Período I: 2005 e 2006; Período II: 2007 e 2008; e Período III: 2009 a 2011), categoria de idade (crianças: sete a 10 anos, e adolescentes: 11 a 14 anos), e estratificada por sexo. O índice de massa corporal foi utilizado para classificar o perfil nutricional. A análise da tendência foi verificada através da Regressão Logística Multinomial (p < 0,05).
ResultadosAs médias de ocorrências foram de 2,11% no baixo peso, 22,27% no sobrepeso e 6,8% na obesidade. Identificou-se chance do baixo peso diminuir do período I para o II nos adolescentes do sexo masculino, e de aumentar nas crianças do sexo feminino do período II para o III. No sobrepeso, encontramos chance de aumento seguida de diminuição nas crianças do sexo masculino. Na obesidade, em todas as categorias de idade e em ambos os sexos, houve chance de aumento do período I para o II.
ConclusãoA prevalência do baixo peso apresenta valores menores que 5% em todas as categorias de idade e sexo. No entanto, na categoria do sobrepeso e da obesidade, encontramos ocorrências mais elevadas, atingindo, juntas, quase 30% da população infanto-juvenil brasileira; além disso, evidenciamos uma chance de aumento na prevalência da obesidade até o ano de 2008 e, após, uma manutenção destas altas prevalências.
The study of the nutritional profile of children and young individuals has been justified by its usefulness in the context of public health, human development, and also due to its contribution to different areas of science.1 Studies that analyze representative population samples allow for the mapping and assessment of the magnitude of nutritional disorders and, additionally, when evaluated over systematic periods, the identification of trends of nutritional disorders.
The Brazilian population is undergoing a nutritional transition, characterized by a decrease in malnutrition and increase in childhood overweight and obesity.2–5 Malnutrition, considered a severe problem in the last century, has shown a decrease of over 60% from 1996 to 2007,4 differently from overweight and obesity, which have increased at an alarming rate among young individuals in recent decades.6,7 Studies have shown an increased risk of children and adolescents with overweight and obesity to become obese adults.8 Obesity is also a risk factor for the development of other diseases, such as metabolic syndrome9 and cardiovascular disease,10 which makes it extremely important to develop strategies to fight this nutritional disorder. Oliveira et al.11 suggested that interventions should be performed in children younger than ten years or in adolescence, rather then in adulthood, as it would further reduce the severity of diseases associated with obesity.
The understanding of the nutritional profile throughout time seems to be the main basis for the development of effective public health actions. In population studies, monitoring the body mass index (BMI) has been established as an important diagnostic method for nutritional profile assessment,12 whose use is justified by its simplicity. Its efficiency and importance have been recognized by the main global health organizations, such as the World Health Organization (WHO) and the Centers for Disease Control and Prevention (CDC).13,14
Thus, this study aimed to describe and analyze the trend of occurrence of underweight, overweight, and obesity in Brazilian children and adolescents during the period of 2005-2011.
MethodsPopulation and SampleThe data of the present study were obtained from the Brazil Sports Project database (Projeto Esporte Brasil - PROESP-Br),15 a permanent recording of indicators of growth, and body and motor development, as well as of the nutritional status of Brazilian children and adolescents aged 6 to 17 years. Assessments are carried out by schoolteachers who voluntarily contact the project through the website (www.proesp.ufrgs.br).16 There, teachers can seek information on the tests applied by the project, interpretation of results, and procedures used to send the collected data, which is performed at the teacher's discretion.
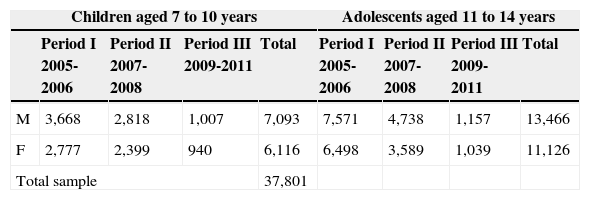
The sample consisted of all students from the different Brazilian regions enrolled in the PROESP-Br database from 2005 to 2011, aged 7 to 14 years, who had undergone the body mass and height tests, and who were mostly from the Southern region (50% from the South, 30% from the Southeast, 10% from the Midwest, and 10% from the North and Northeast). The voluntary sample was categorized into age groups (children - 7 to 10 years - and adolescents - 11 to 14 years), divided into three data collection periods (period I – data collected in 2005 and 2006, period II - data collected in 2007 and 2008, and period III - data collected in 2009, 2010 and 2011), and stratified by gender, as shown in Table 1.
Sample characteristics stratified by years of data collection.
| Children aged 7 to 10 years | Adolescents aged 11 to 14 years | |||||||
|---|---|---|---|---|---|---|---|---|
| Period I 2005-2006 | Period II 2007-2008 | Period III 2009-2011 | Total | Period I 2005-2006 | Period II 2007-2008 | Period III 2009-2011 | Total | |
| M | 3,668 | 2,818 | 1,007 | 7,093 | 7,571 | 4,738 | 1,157 | 13,466 |
| F | 2,777 | 2,399 | 940 | 6,116 | 6,498 | 3,589 | 1,039 | 11,126 |
| Total sample | 37,801 | |||||||
F, females; M, males.
Body mass and height were assessed by teachers at schools, according to the instructions described in the PROESP-Br manual.15 Height was measured in centimeters (cm) using a stadiometer, a measuring tape, or a measuring tape fixed to the wall. The subjects were positioned along the wall, barefoot, with heels touching the wall, and the value was recorded in centimeters to one decimal place. Body mass was measured in kilograms (kg) using a portable scale with a resolution of up to 500 grams. The students were wearing light clothes and were barefoot. The value was recorded in kg to one decimal place, and the BMI (weight/(height)2) was subsequently calculated. The subject was classified as underweight, normal weight, overweight, or obese, according to the categories proposed by Conde and Monteiro.17
All ethical guidelines were followed. The PROESP-Br was approved by the Research Ethics Committee (CEP-PROPESQ) under protocol No. 2008010.
Statistical analysisDescriptive statistics (mean±standard deviation) were used to characterize the sample in different time periods. The association between the categories of the nutritional profile and the time periods was analyzed using Pearson's chi-squared test. The identification of the trend of occurrence of underweight, overweight, and obesity among the time periods (2005-2006, 2007-2008, 2009-2011) was performed using multinomial logistic regression, with BMI as the dependent variable; the different time periods were included in the model as the predictor variable. The significance level was set at α=5% for all procedures, and the Statistical Package for Social Sciences (SPSS), release 18.0 for Windows, was used in all statistical analyses.
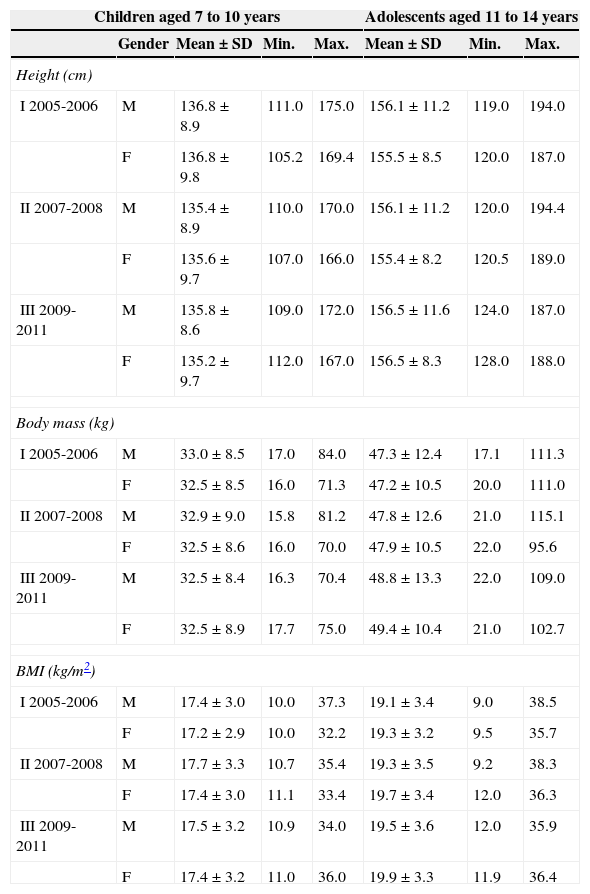
ResultsThe anthropometric characteristics of the sample, such as mean and minimum and maximum values, are shown in Table 2. The number of subjects included in the analysis was 37,801, of which 20,559 were males and 17,242 were females. There was an interdependence association between time periods and nutritional profile in all age groups and in both genders (male children: χ2 (6)=29.08, p<0.001; male adolescents: χ2 (6)=27.671, p<0.001; female children: χ2 (6)=21.216, p=0.002, and females adolescent: χ2 (6)=22.853, p=0.001).
Sample anthropometric characteristics.
| Children aged 7 to 10 years | Adolescents aged 11 to 14 years | ||||||
|---|---|---|---|---|---|---|---|
| Gender | Mean±SD | Min. | Max. | Mean±SD | Min. | Max. | |
| Height (cm) | |||||||
| I 2005-2006 | M | 136.8±8.9 | 111.0 | 175.0 | 156.1±11.2 | 119.0 | 194.0 |
| F | 136.8±9.8 | 105.2 | 169.4 | 155.5±8.5 | 120.0 | 187.0 | |
| II 2007-2008 | M | 135.4±8.9 | 110.0 | 170.0 | 156.1±11.2 | 120.0 | 194.4 |
| F | 135.6±9.7 | 107.0 | 166.0 | 155.4±8.2 | 120.5 | 189.0 | |
| III 2009-2011 | M | 135.8±8.6 | 109.0 | 172.0 | 156.5±11.6 | 124.0 | 187.0 |
| F | 135.2±9.7 | 112.0 | 167.0 | 156.5±8.3 | 128.0 | 188.0 | |
| Body mass (kg) | |||||||
| I 2005-2006 | M | 33.0±8.5 | 17.0 | 84.0 | 47.3±12.4 | 17.1 | 111.3 |
| F | 32.5±8.5 | 16.0 | 71.3 | 47.2±10.5 | 20.0 | 111.0 | |
| II 2007-2008 | M | 32.9±9.0 | 15.8 | 81.2 | 47.8±12.6 | 21.0 | 115.1 |
| F | 32.5±8.6 | 16.0 | 70.0 | 47.9±10.5 | 22.0 | 95.6 | |
| III 2009-2011 | M | 32.5±8.4 | 16.3 | 70.4 | 48.8±13.3 | 22.0 | 109.0 |
| F | 32.5±8.9 | 17.7 | 75.0 | 49.4±10.4 | 21.0 | 102.7 | |
| BMI (kg/m2) | |||||||
| I 2005-2006 | M | 17.4±3.0 | 10.0 | 37.3 | 19.1±3.4 | 9.0 | 38.5 |
| F | 17.2±2.9 | 10.0 | 32.2 | 19.3±3.2 | 9.5 | 35.7 | |
| II 2007-2008 | M | 17.7±3.3 | 10.7 | 35.4 | 19.3±3.5 | 9.2 | 38.3 |
| F | 17.4±3.0 | 11.1 | 33.4 | 19.7±3.4 | 12.0 | 36.3 | |
| III 2009-2011 | M | 17.5±3.2 | 10.9 | 34.0 | 19.5±3.6 | 12.0 | 35.9 |
| F | 17.4±3.2 | 11.0 | 36.0 | 19.9±3.3 | 11.9 | 36.4 | |
BMI, body mass index; F, female sex; M, male sex; Max., maximum values; Min., minimum values; SD, standard deviation.
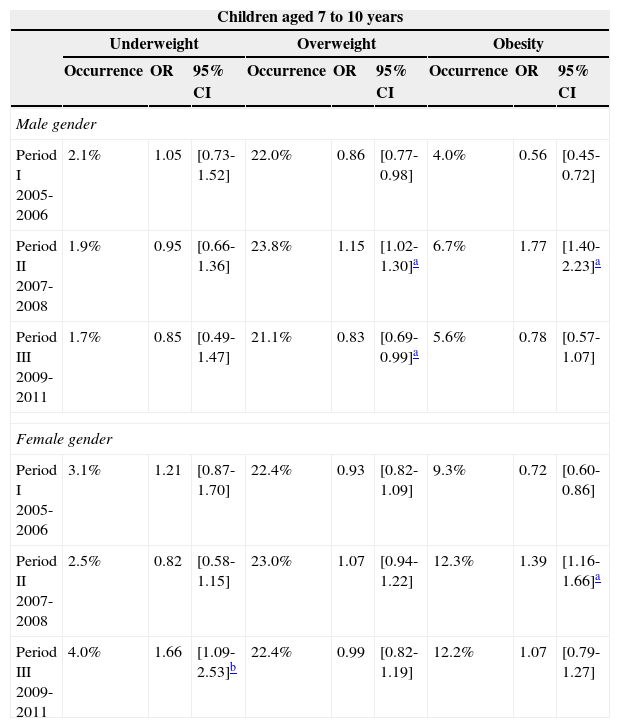
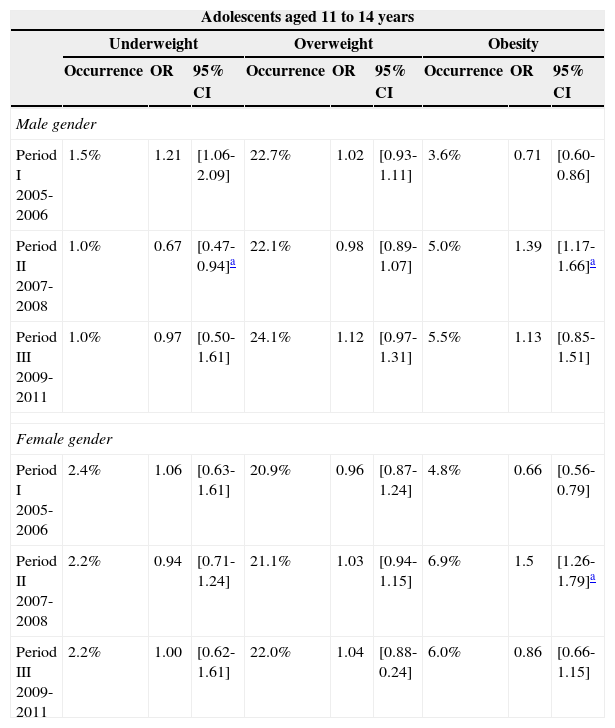
Tables 3 and 4 show the trends of underweight, overweight, and obesity for each age category and study period, stratified by gender. In the analysis of underweight, a significant increase in occurrence, from 2.5% to 4.0%, was observed in female children from period II to period III (Table 3). A significant decrease in underweight, from 1.5% to 1.0%, was observed in male adolescents from period I to period II (Table 4).
Prevalence of underweight, overweight, and obesity in the children.
| Children aged 7 to 10 years | |||||||||
|---|---|---|---|---|---|---|---|---|---|
| Underweight | Overweight | Obesity | |||||||
| Occurrence | OR | 95% CI | Occurrence | OR | 95% CI | Occurrence | OR | 95% CI | |
| Male gender | |||||||||
| Period I 2005-2006 | 2.1% | 1.05 | [0.73-1.52] | 22.0% | 0.86 | [0.77-0.98] | 4.0% | 0.56 | [0.45-0.72] |
| Period II 2007-2008 | 1.9% | 0.95 | [0.66-1.36] | 23.8% | 1.15 | [1.02-1.30]a | 6.7% | 1.77 | [1.40-2.23]a |
| Period III 2009-2011 | 1.7% | 0.85 | [0.49-1.47] | 21.1% | 0.83 | [0.69-0.99]a | 5.6% | 0.78 | [0.57-1.07] |
| Female gender | |||||||||
| Period I 2005-2006 | 3.1% | 1.21 | [0.87-1.70] | 22.4% | 0.93 | [0.82-1.09] | 9.3% | 0.72 | [0.60-0.86] |
| Period II 2007-2008 | 2.5% | 0.82 | [0.58-1.15] | 23.0% | 1.07 | [0.94-1.22] | 12.3% | 1.39 | [1.16-1.66]a |
| Period III 2009-2011 | 4.0% | 1.66 | [1.09-2.53]b | 22.4% | 0.99 | [0.82-1.19] | 12.2% | 1.07 | [0.79-1.27] |
Prevalence of underweight, overweight, and obesity in the adolescents.
| Adolescents aged 11 to 14 years | |||||||||
|---|---|---|---|---|---|---|---|---|---|
| Underweight | Overweight | Obesity | |||||||
| Occurrence | OR | 95% CI | Occurrence | OR | 95% CI | Occurrence | OR | 95% CI | |
| Male gender | |||||||||
| Period I 2005-2006 | 1.5% | 1.21 | [1.06-2.09] | 22.7% | 1.02 | [0.93-1.11] | 3.6% | 0.71 | [0.60-0.86] |
| Period II 2007-2008 | 1.0% | 0.67 | [0.47-0.94]a | 22.1% | 0.98 | [0.89-1.07] | 5.0% | 1.39 | [1.17-1.66]a |
| Period III 2009-2011 | 1.0% | 0.97 | [0.50-1.61] | 24.1% | 1.12 | [0.97-1.31] | 5.5% | 1.13 | [0.85-1.51] |
| Female gender | |||||||||
| Period I 2005-2006 | 2.4% | 1.06 | [0.63-1.61] | 20.9% | 0.96 | [0.87-1.24] | 4.8% | 0.66 | [0.56-0.79] |
| Period II 2007-2008 | 2.2% | 0.94 | [0.71-1.24] | 21.1% | 1.03 | [0.94-1.15] | 6.9% | 1.5 | [1.26-1.79]a |
| Period III 2009-2011 | 2.2% | 1.00 | [0.62-1.61] | 22.0% | 1.04 | [0.88-0.24] | 6.0% | 0.86 | [0.66-1.15] |
Regarding overweight, a significant increase in occurrence, from 22.0% to 23.8% from period I to II was observed in male children, followed by a significant decrease, from 23.8% to 21.1% from period II to III (Table 3).
Regarding obesity, a significant increase from period I to II in all age groups and in both genders was observed, from 4.0% to 6.7% in male children and from 9.3% to 12.3% in female children (Table 3); among adolescents, the increase was from 3.6% to 5.0% for males and from 4.8% to 6.9% in females (Table 4).
DiscussionThe longitudinal analysis of underweight, overweight, and obesity allowed for the description of the nutritional profile trend throughout a six-year period in a sample of Brazilian schoolchildren participating in PROESP-Br.
The prevalence of underweight was low, considered acceptable by the WHO,14 with a mean of 2.5% for children (7 to 10 years) and 1.65% for adolescents (11 to 14 years). These findings are consistent with the studies by Marinho18 and by Anjos et al.19 A significant decrease in occurrence was observed from period I to II in male adolescents, which supports the latest survey conducted in the country, the Household Budget Survey (HBS),7 indicating that in this age category, underweight has declined, ceasing to be the main nutritional problem. In female children, an increase in occurrence was observed from period II to III, although the rate remained below 5%, which is considered acceptable by the WHO.14 The study by Frota et al.20 presented higher occurrences than those from the present study (6.3%), indicating that in this period (2007-2008) a higher occurrence of underweight among female children may indeed have happened.
Regarding the analysis of excess weight (overweight and obesity), worrisome data were observed: approximately 20% of subjects presented overweight, and the occurrence of obesity ranged from 5.5% to 12.2% in the last evaluated period (2009-2011), representing a mean prevalence of excess weight of 27.6% in males and of 33.8% in females. These results are consistent with data observed in studies of Brazilian regions, such as by Fagundes et al.,21 by Oliveira et al.,22 and by Rech et al.,23 as well as those verified in countries where obesity has already been defined as a prevalent disease, such as the studies by Davis et al.24 and by Ogden et al.25 The results of Brazilian schoolchildren thus characterize a new public health problem.
When analyzing the trend, small variations were observed in the occurrence of overweight for male children, with a significant increase in occurrence from 22% to 23.8% from period I to II, and a decrease to 21.1% in the last evaluated period (2009 to 2011), indicating the absence of a plateau for this profile, as demonstrated by Kunesová et al.26 This is different from the results regarding obesity, in which a significant increase in occurrence was observed from period I to II (2005-2006 to 2007-2008) in both age categories (children and adolescents) and in both genders, suggesting a maintenance of this prevalence in the last evaluated period (2009-2011). Studies using Brazilian data (HBS 2008-2009)7 indicate an approximate 10% increase in obesity in the child and adolescent population, when compared with data from 1974-75, but there is no analysis indicating an increase in the last evaluated periods.
However, the study by Ogden et al.27 showed results similar to those of the present study, demonstrating that during the 12 years of analysis, there was a significant trend of increase in the prevalence of obesity in children and adolescents and, again similar to the present findings, there was no significant increase between the years 2007-2008 and from 2009 to 2010.
The explanations for the phenomenon of increase in prevalence of overweight and obesity appear to be based on the literature, as shown by Coelho et al.28 and Malta et al.,29 where these authors state that this phenomenon was the result of new life habits, such as the increase in the consumption of unhealthy foods and decreased daily energy expenditure. However, the existence of a possible plateau in the prevalence of obesity still deserves further studies; the authors believe that this fact can be considered primary prevention, characterized by decreased incidence, which directly affects prevalence.
Nevertheless, the high occurrence of overweight and obesity in children and adolescents are still a matter of concern, particularly due to their rapid increase in the Brazilian population, justifying the study of these profiles, mainly because this population is at high risk of remaining obese as adults, as shown by Conde and Borges30 and by The et al.31 The present findings are difficult to compare; no other studies that included representative samples of Brazilian schoolchildren could be retrieved, as well as the fact that the studies conducted to date differ regarding the methodology used, especially in relation to the adopted profile criteria, i.e., the use of a single category for overweight and obesity (termed excess weight), and the lack of the study of trends.
Finally, this study contributes with the following conclusions: the prevalence of underweight is declining and remains within acceptable WHO standards14 (below 5%), in contrast to the high values found for overweight and obesity, which together include almost 30% of the population of children and adolescents. Regarding the study of the trend of obesity, a significant increase in the occurrence was observed in all age groups and in both genders during the period comprising the years 2005-2006 to 2007-2008; the prevalence remained high during the subsequent period (2009-2011).
FundingCoordenação de Pessoal de Nível Superior (Capes) and Conselho Nacional de Desenvolvimento Científico e Tecnológico (CNPq).
Conflict of interestThe authors declare no conflict of interest.
The authors would like to thank the teachers of the institutions participating in the PROESP-Br for applying the test and creating the database. They would also like to thank the members of the PROESP-Br study group, and CAPES and CNPq for the scholarships and scientific productivity grants.
Please cite this article as: Flores LS, Gaya AR, Petersen RD, Gaya AC. Trends of underweight, overweight, and obesity in Brazilian children and adolescents. J Pediatr (Rio J). 2013;89:456–61.


