


This longitudinal study aimed to verify possible changes in the time spent in sedentary activities occurring as screen-time, educational, cultural, social, and transportation domains in a sample of Brazilian adolescents between 2015 and 2017.
MethodsIt is a longitudinal prospective study with 586 adolescents from 12 to 15 years old at the Baseline (2015) enrolled in 14 public schools from Curitiba, Brazil. The Adolescent Sedentary Activity Questionnaire assessed the time spent in sedentary activities in five domains (recreational screen-time, educational, cultural, social, and transportation). A series of linear random effects regressions analyzed changes in the sedentary time between 2015 and 2017, with p < .05.
ResultsOverall, 323 adolescents dropped out of the study resulting in a retention rate of 44.9%. The overall sedentary time remained stable from 2015 to 2017 (-3.98 min/day, 95%CI: -15.39; 7.42). The screen-time decreased (-22.22 min/day, 95%CI: -30.30; -14.15), and educational (8.29 min/day, 95% CI: 3.52; 13.06), cultural (3.41 min/day, 95% CI: 0.66; 6.15) and social sedentary activities (8.20 min/day, 95% CI: 2.06; 14.34) increased from 2015 to 2017.
ConclusionSignificant reductions in screen-time were evidenced along with increases in time spent on other sedentary activities of educational, cultural, and social nature. KeywordsSedentary behavior, Adolescent health, Longitudinal studies
A high level of sedentary behavior (SB) is a significant health risk factor for adolescents.1,2 SB is associated with excess body fat, insulin resistance, dyslipidemia, inflammatory markers, blood pressure changes, and low physical fitness.3 Additionally, SB, particularly screen-time, is a predictor of other health risk behaviors in adolescents, such as low consumption of fruits and vegetables and alcohol and cigarette use.4,5
SB includes many activities that usually happen in the sitting, reclined, or lying position.6 Recreational screen-time is a commonly measured SB. In addition, SB may occur in educational (sitting in the classroom, doing homework, and taking private lessons), cultural (reading, doing crafts, and playing musical instruments), social (talking to friends, and participating in religious events), and transportation settings (commuting by car, bus, or motorcycle).6
Opportunities for engaging in SB have grown considerably in recent decades. Youth are more sedentary than the previous generations.7 Adolescents spend 5 to 10 h a day in SB, and 2 to 4 h are usually dedicated to screen-time (television, computers, video games, and smartphones).8
Age is associated with increased SB through adolescence.9,10 A 2.5-year longitudinal study9 showed that Australian girls increased screen-time from 45% to 63% of their daily leisure time at the end of the study. Similarly, Vietnamese and English adolescents increased time spent in SB with age by 21.2% and 54% respectively.10,11 Finally, screen-time also increased for Brazilian adolescents (10.8% for boys and 26.5% for girls);12 however, most studies evaluating SB in Brazilian adolescents have used cross-sectional designs and restricted SB to screen-time.13,14
Longitudinal studies can identify and relate events to a particular exposure, establish the sequence of these events and evaluate changes over time.15 Longitudinal designs may greatly assist in the identification of changes in sedentary habits during adolescence. Moreover, evaluating different SB domains (e.g. cultural, transportation) provides a broader view of SB choices in this period of life. Therefore, this study aimed to examine changes in the time spent in SB in Brazilian adolescents between 2015 and 2017.
MethodStudy designThis study is a longitudinal prospective study that monitored adolescents enrolled in public schools from Curitiba, Brazil, for two years.
ParticipantsAdolescent males and females between the ages of 12 and 16, who were currently enrolled in the state public school system in Curitiba, were eligible to participate in the current study. Eligible schools had at least 4 classrooms in each grade level from grades six to ten. A stratified random sampling method selected 16 schools out of the nine school districts available. From the 16 public schools contacted, 14 agreed to participate. Each school contributed with 4 to 6 classrooms within grades 6th to 10th. The authors invited all students from these classrooms to participate in the study.
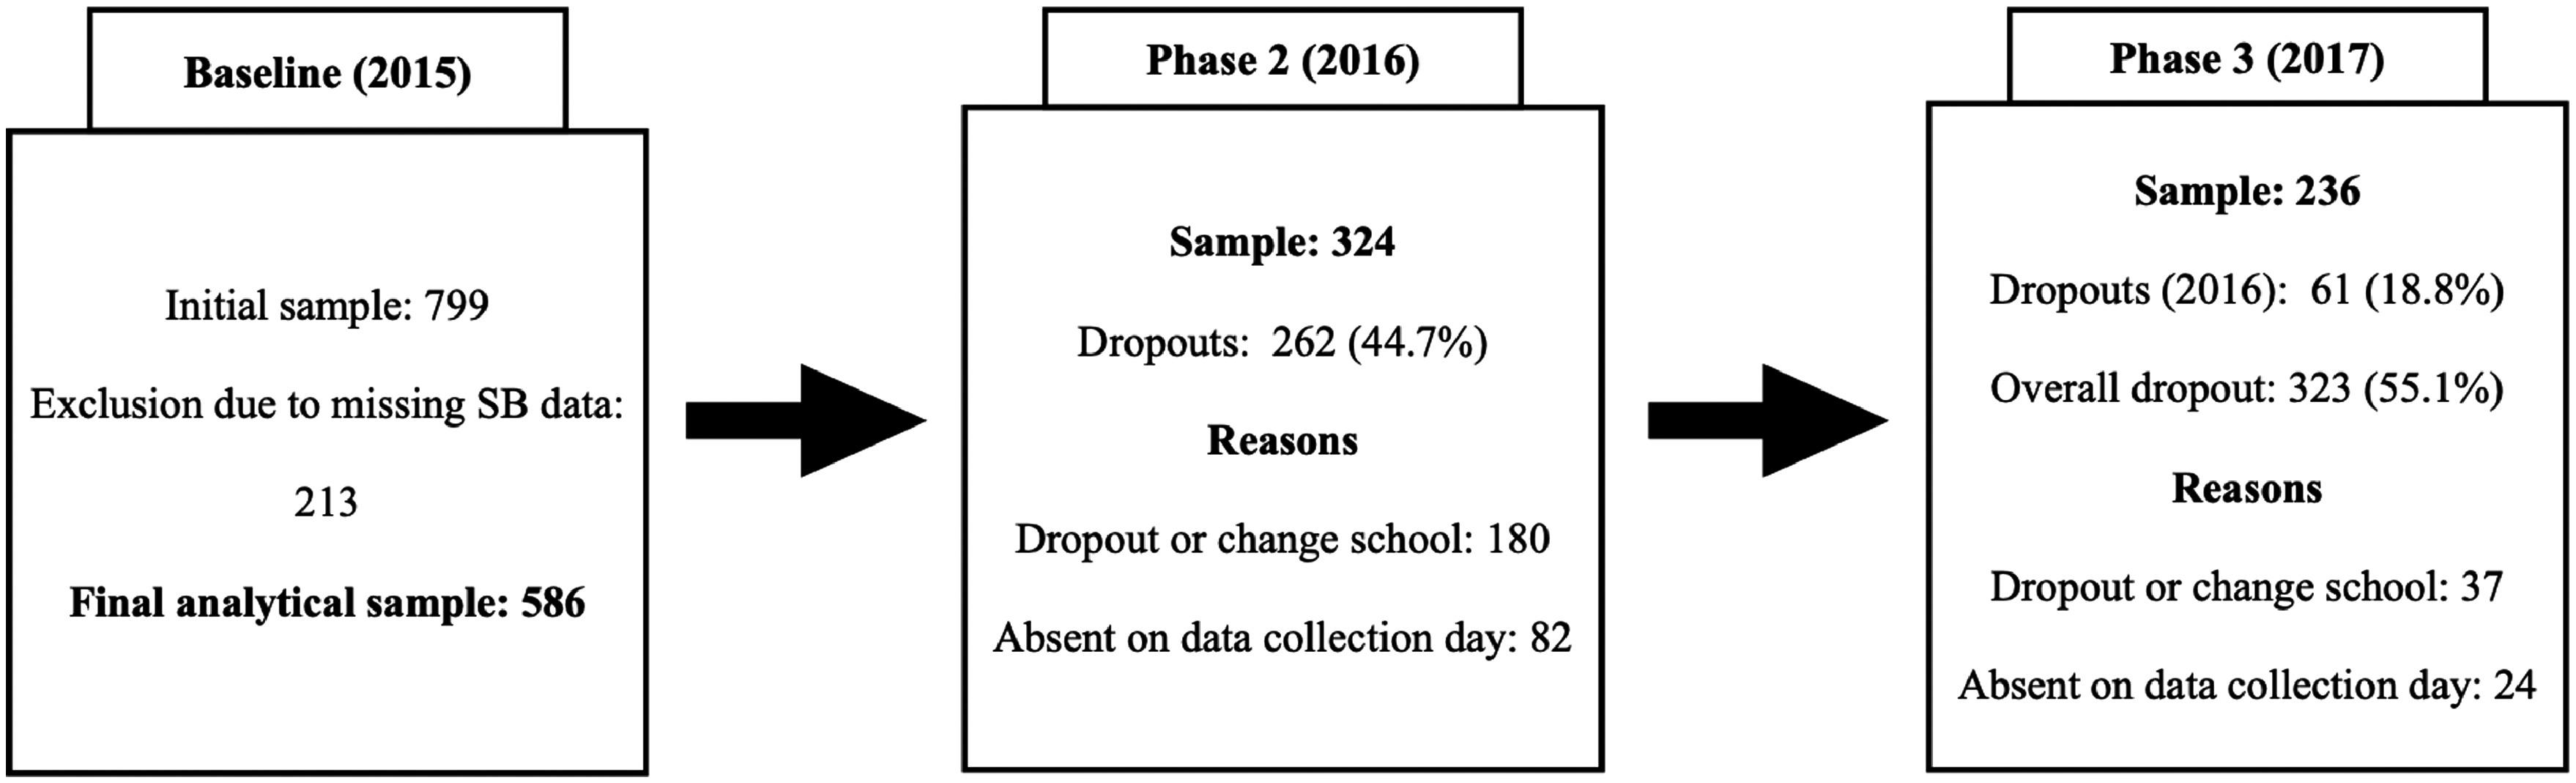
The authors applied sample weights to proportionally select schools in each district, and classrooms and students within each selected school. The authors of the present study collected data from 799 adolescents, but they excluded 213 adolescents from the analysis due to missing data on the sedentary behavior questionnaire resulting in a final sample of 586 adolescents (Supplementary File 1).
Instrument and proceduresData collectionData collection occurred from August to November for each year of the study (2015–2017). A trained team from the Research Center on Physical Activity and Health (UFPR) carried out the data collection. Adolescents completed questionnaires on sociodemographic information, SB, physical activity, weight measurements, and height. They provided the informed consent signed by their parents/guardians and signed an assent form before the data collection. The time to perform all procedures was approximately 70 min. The Human Research Ethics Committee of the Federal University of Paraná (CAAE protocol: 39206214.3.0000.0102) approved the study.
Sedentary behaviorThe Adolescent Sedentary Activity Questionnaire (ASAQ) assessed the time spent in sedentary activities.16 The ASAQ provides information about the time spent on different sedentary activities on weekdays and the weekend of a typical week. ASAQ assessed SB using 13 items divided into five domains: screen-time recreation, educational, cultural, social, and transportation. Screen-time recreation included watching television, videos/DVDs, computer use for leisure (internet, social media), and video games. The educational activities included sitting in the classroom, doing homework with or without using the computer, and taking courses or private lessons. The cultural activities included reading for leisure, making crafts or other manual hobbies, and playing musical instruments without physical effort. The social activities included meetings with friends, conversations with friends via phone and classes, or participation in religious events on weekends. Sedentary transportation activities include traveling or commuting by car, bus, subway, or motorcycle.16
The participants reported the time spent in SB in hours or minutes during a typical weekday and weekend day. The authors used the overall sedentary time and time spent in each domain (minutes per day) to verify changes in this behavior between 2015 and 2017. Substantial evidence supports the validity and reliability of ASAQ for the assessment of sedentary time in Brazilian adolescents (ICC: 0.88, 95%CI:.82–0.91; Rho: 0.79, p < .01).16,17
Income status and parent educational levelThe Brazilian Association of Research Companies' Questionnaire.18 assessed the participants' parental educational level and income status. It evaluates the income status of a family based on goods available at home. Income is divided into seven income statuses: A, B1, B2, C1, C2, D, and E. The authors further classified income status as High (A, B1, and B2) and Low (C1, C2, D, and E). A single additional question asked about the parent educational level and the authors of this study were stratified as Low (Less than complete high school education), Medium (High school or incomplete college education), and High (at least a college degree).
Body mass index statusThe authors measured weight using a digital scale, and height using a portable stadiometer (W721, Wiso, Brazil). The authors calculated Body Mass Index (BMI) as weight (kg)/height2 (m2), and weight status was determined based on World Health Organization standards.19 For the statistical analysis, the authors grouped adolescents into underweight/normal weight and overweight/obesity .
Participation in physical activity

The Youth Activity Profile (YAP).20 questionnaire assessed participation levels of physical activity (PA). YAP consists of 10 multiple choice items asking about PA performed in different contexts (inside the school, outside the school, and during weekends). Based on the average score over ten items, the authors created tertiles of participation in PA (low, medium, and high). The YAP was adapted and cross-validated to be used in Brazilian adolescents (rho: 0.44; p < .001).21
Statistical analysisThe authors of the present study used central tendency, dispersion, and relative frequency to describe the characteristics of the sample. The authors tested data normality using the Shapiro-Wilk test, skewness, and kurtosis. Independent t-tests and chi-square tests examined differences between participants who dropped out after baseline compared to participants who completed the study. A series of linear regressions with random effects tested the changes in the overall SB and each SB domain (screen-time recreation, educational, cultural, social, and transportation) between 2015 and 2017. The maximum likelihood method was used to estimate missing data. This method is recommended to deal with missing data in longitudinal designs, even with significant dropouts (over 50%) and systematic losses.22 For each sedentary behavior analyzed, the variable "time" was an independent variable along with the explanatory variables gender, age, BMI status, income status, parent educational level, and PA participation. The variables present in each prediction model were forced in the initial models and removed if they did not reach p ≤ 0.20. The authors used Stata 14.1 MP to run all statistical analyses. Significance was based on p < .05.
ResultsOverall, 323 adolescents dropped out of the study resulting in a retention rate of 44.9%. The main reasons for dropping out were: a) moving to another school, b) dropping out of school, and c) missing the day of data collection. A higher proportion of boys dropped out of the study (51.5% vs. 44.1%, χ²: 4.30, p: .04). There were no differences in SB between dropouts compared to those with complete scores.
Most of the participants at baseline were girls (53.4%), <14 years old (52.9%), normal weight (59.4%), with parents of low educational level (52.0%), and with moderate participation in PA (39.4%). The proportion of adolescents with low- and high-income status were similar at baseline (50.2% vs. 49.8%, respectively) (Supplementary File 2).
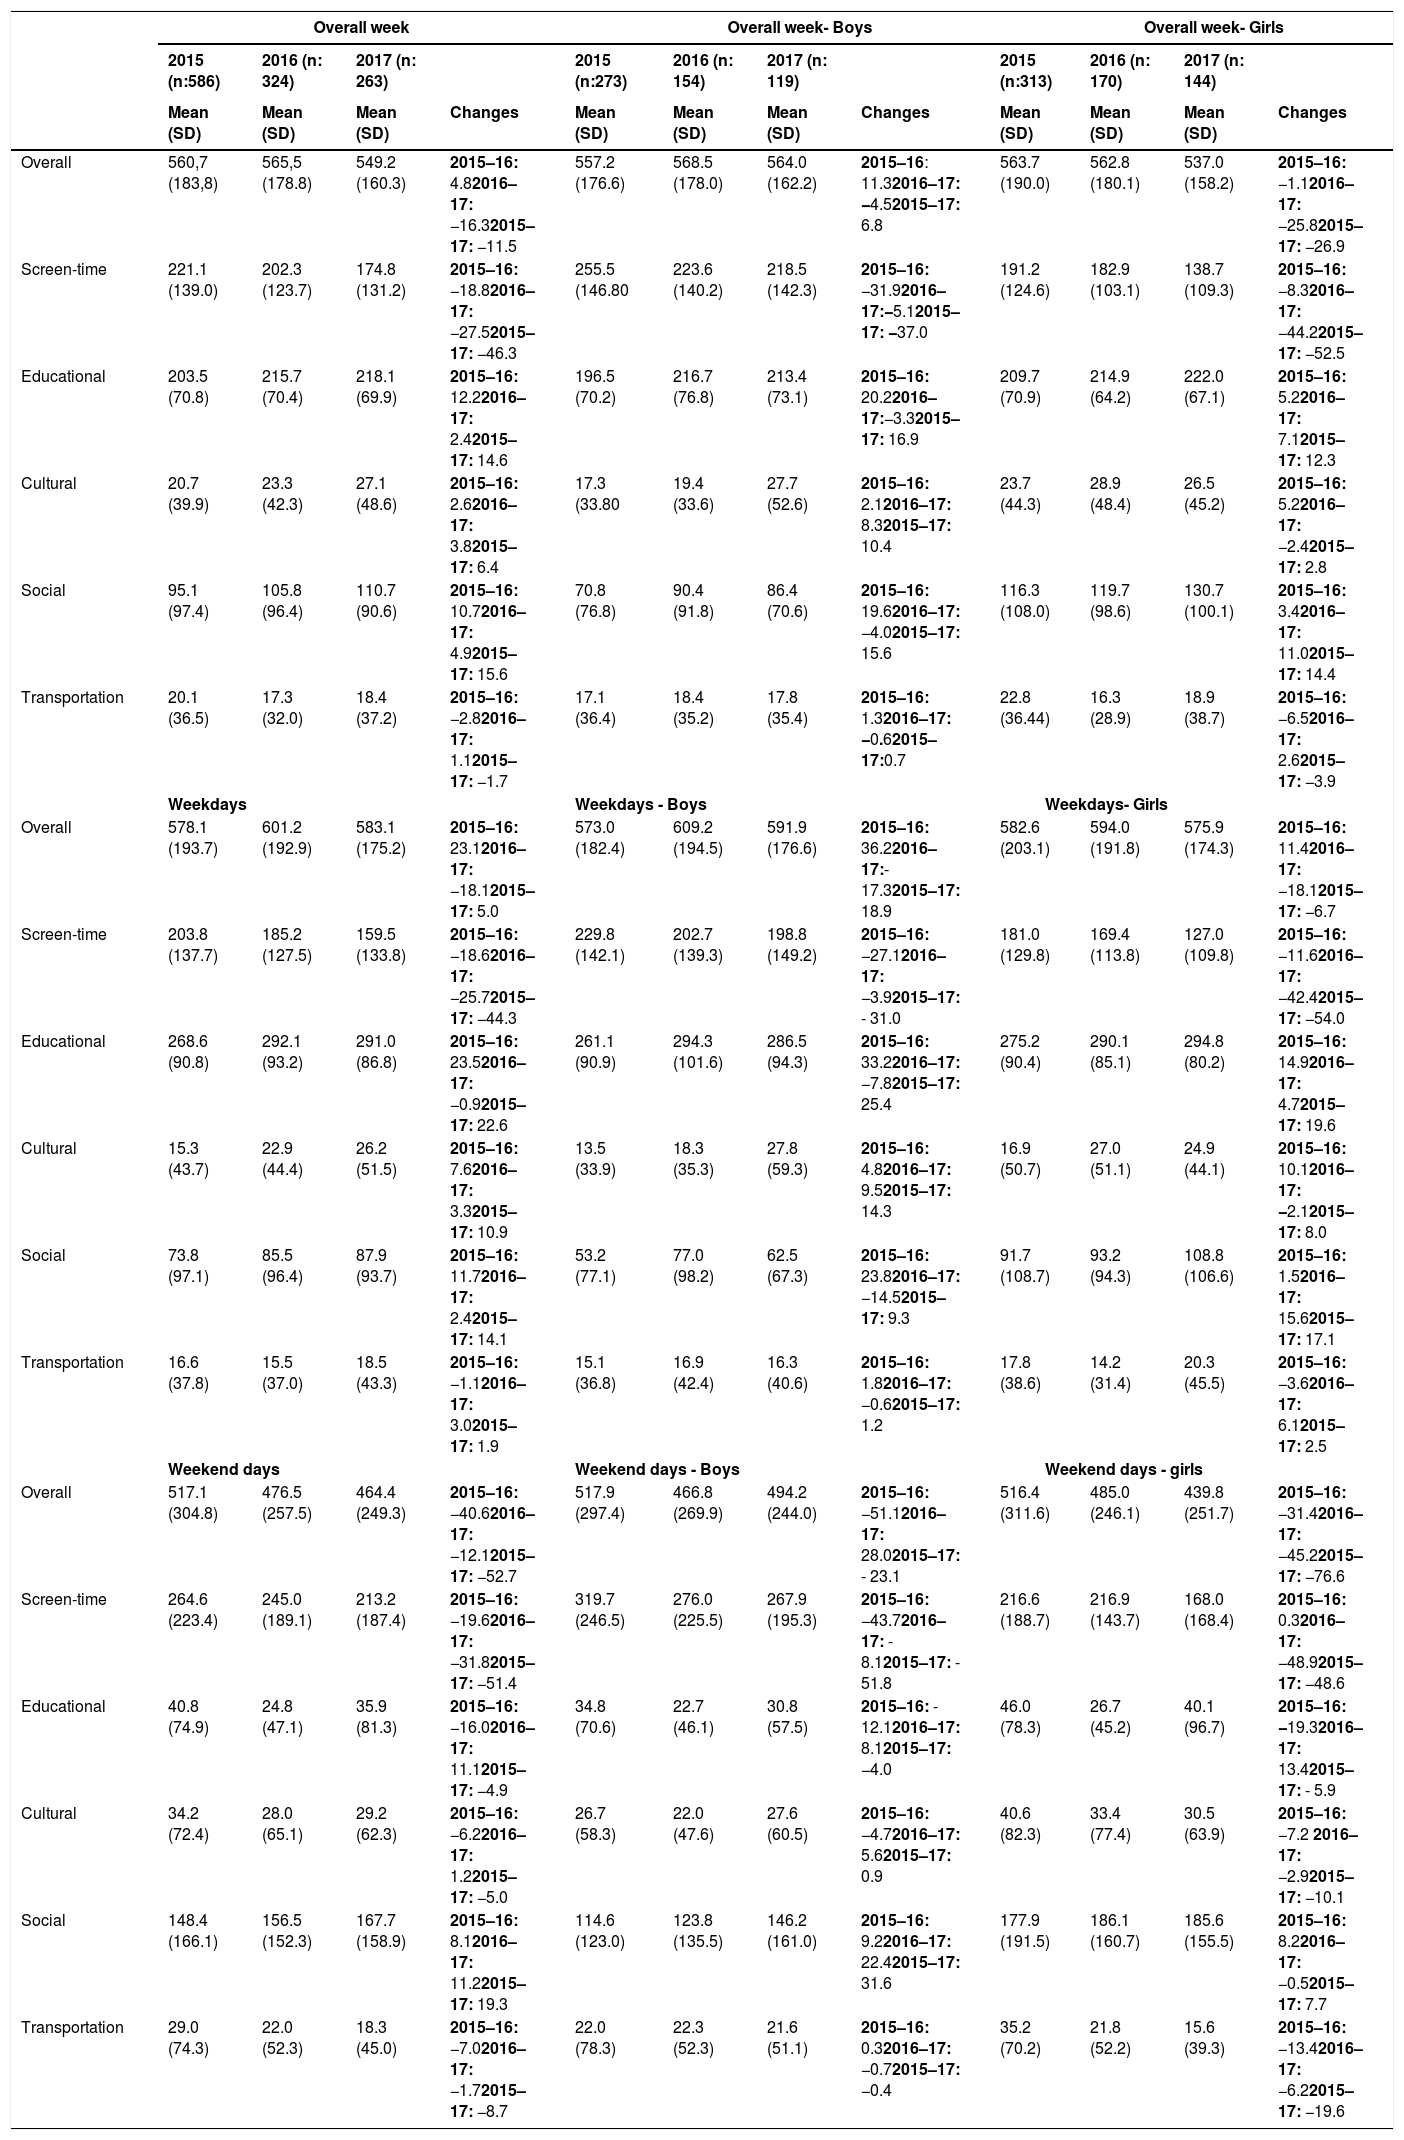
Table 1 shows the time spent on SB over time. At baseline, adolescents reported spending approximately 9 hrs/day in total sedentary activities (boys: 9.3 hrs/day; girls: 9.4 hrs/day). Adolescents spent about 3.7 hrs a day in screen-time activities (boys: 4.2 hrs/day; girls: 3.2 hrs/day), followed by educational (overall: 3.4 hrs/day; boys: 3.3 hrs/day; girls: 3.5 hrs/day) and social SB (overall: 1.6 hrs/day; boys: 1.2 hrs/day; girls: 1.9 hrs/day).
Daily time (minutes/day) spent in different domains of sedentary activities in 2015, 2016, and 2017.
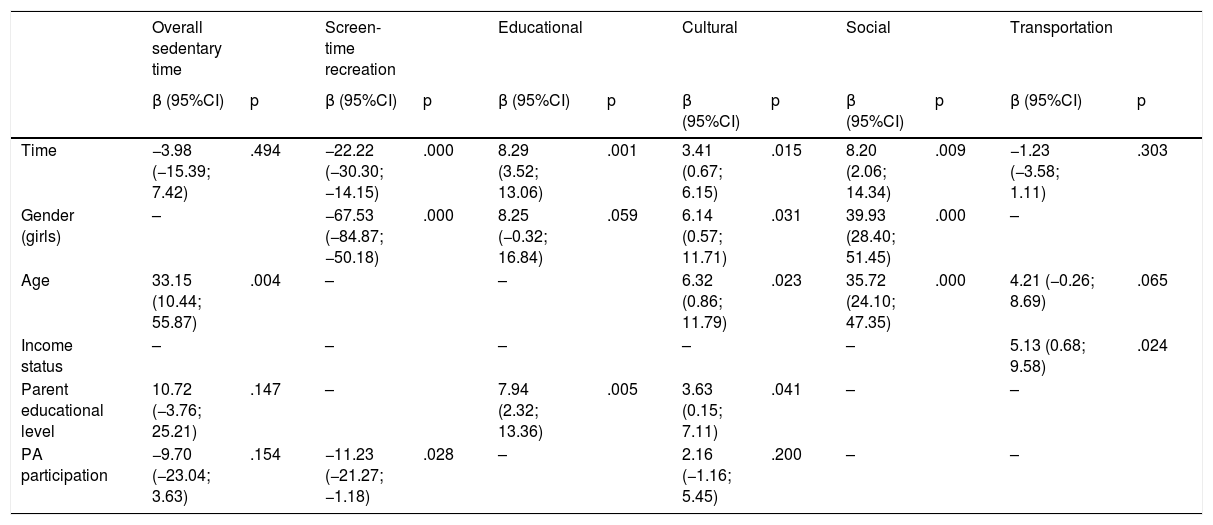
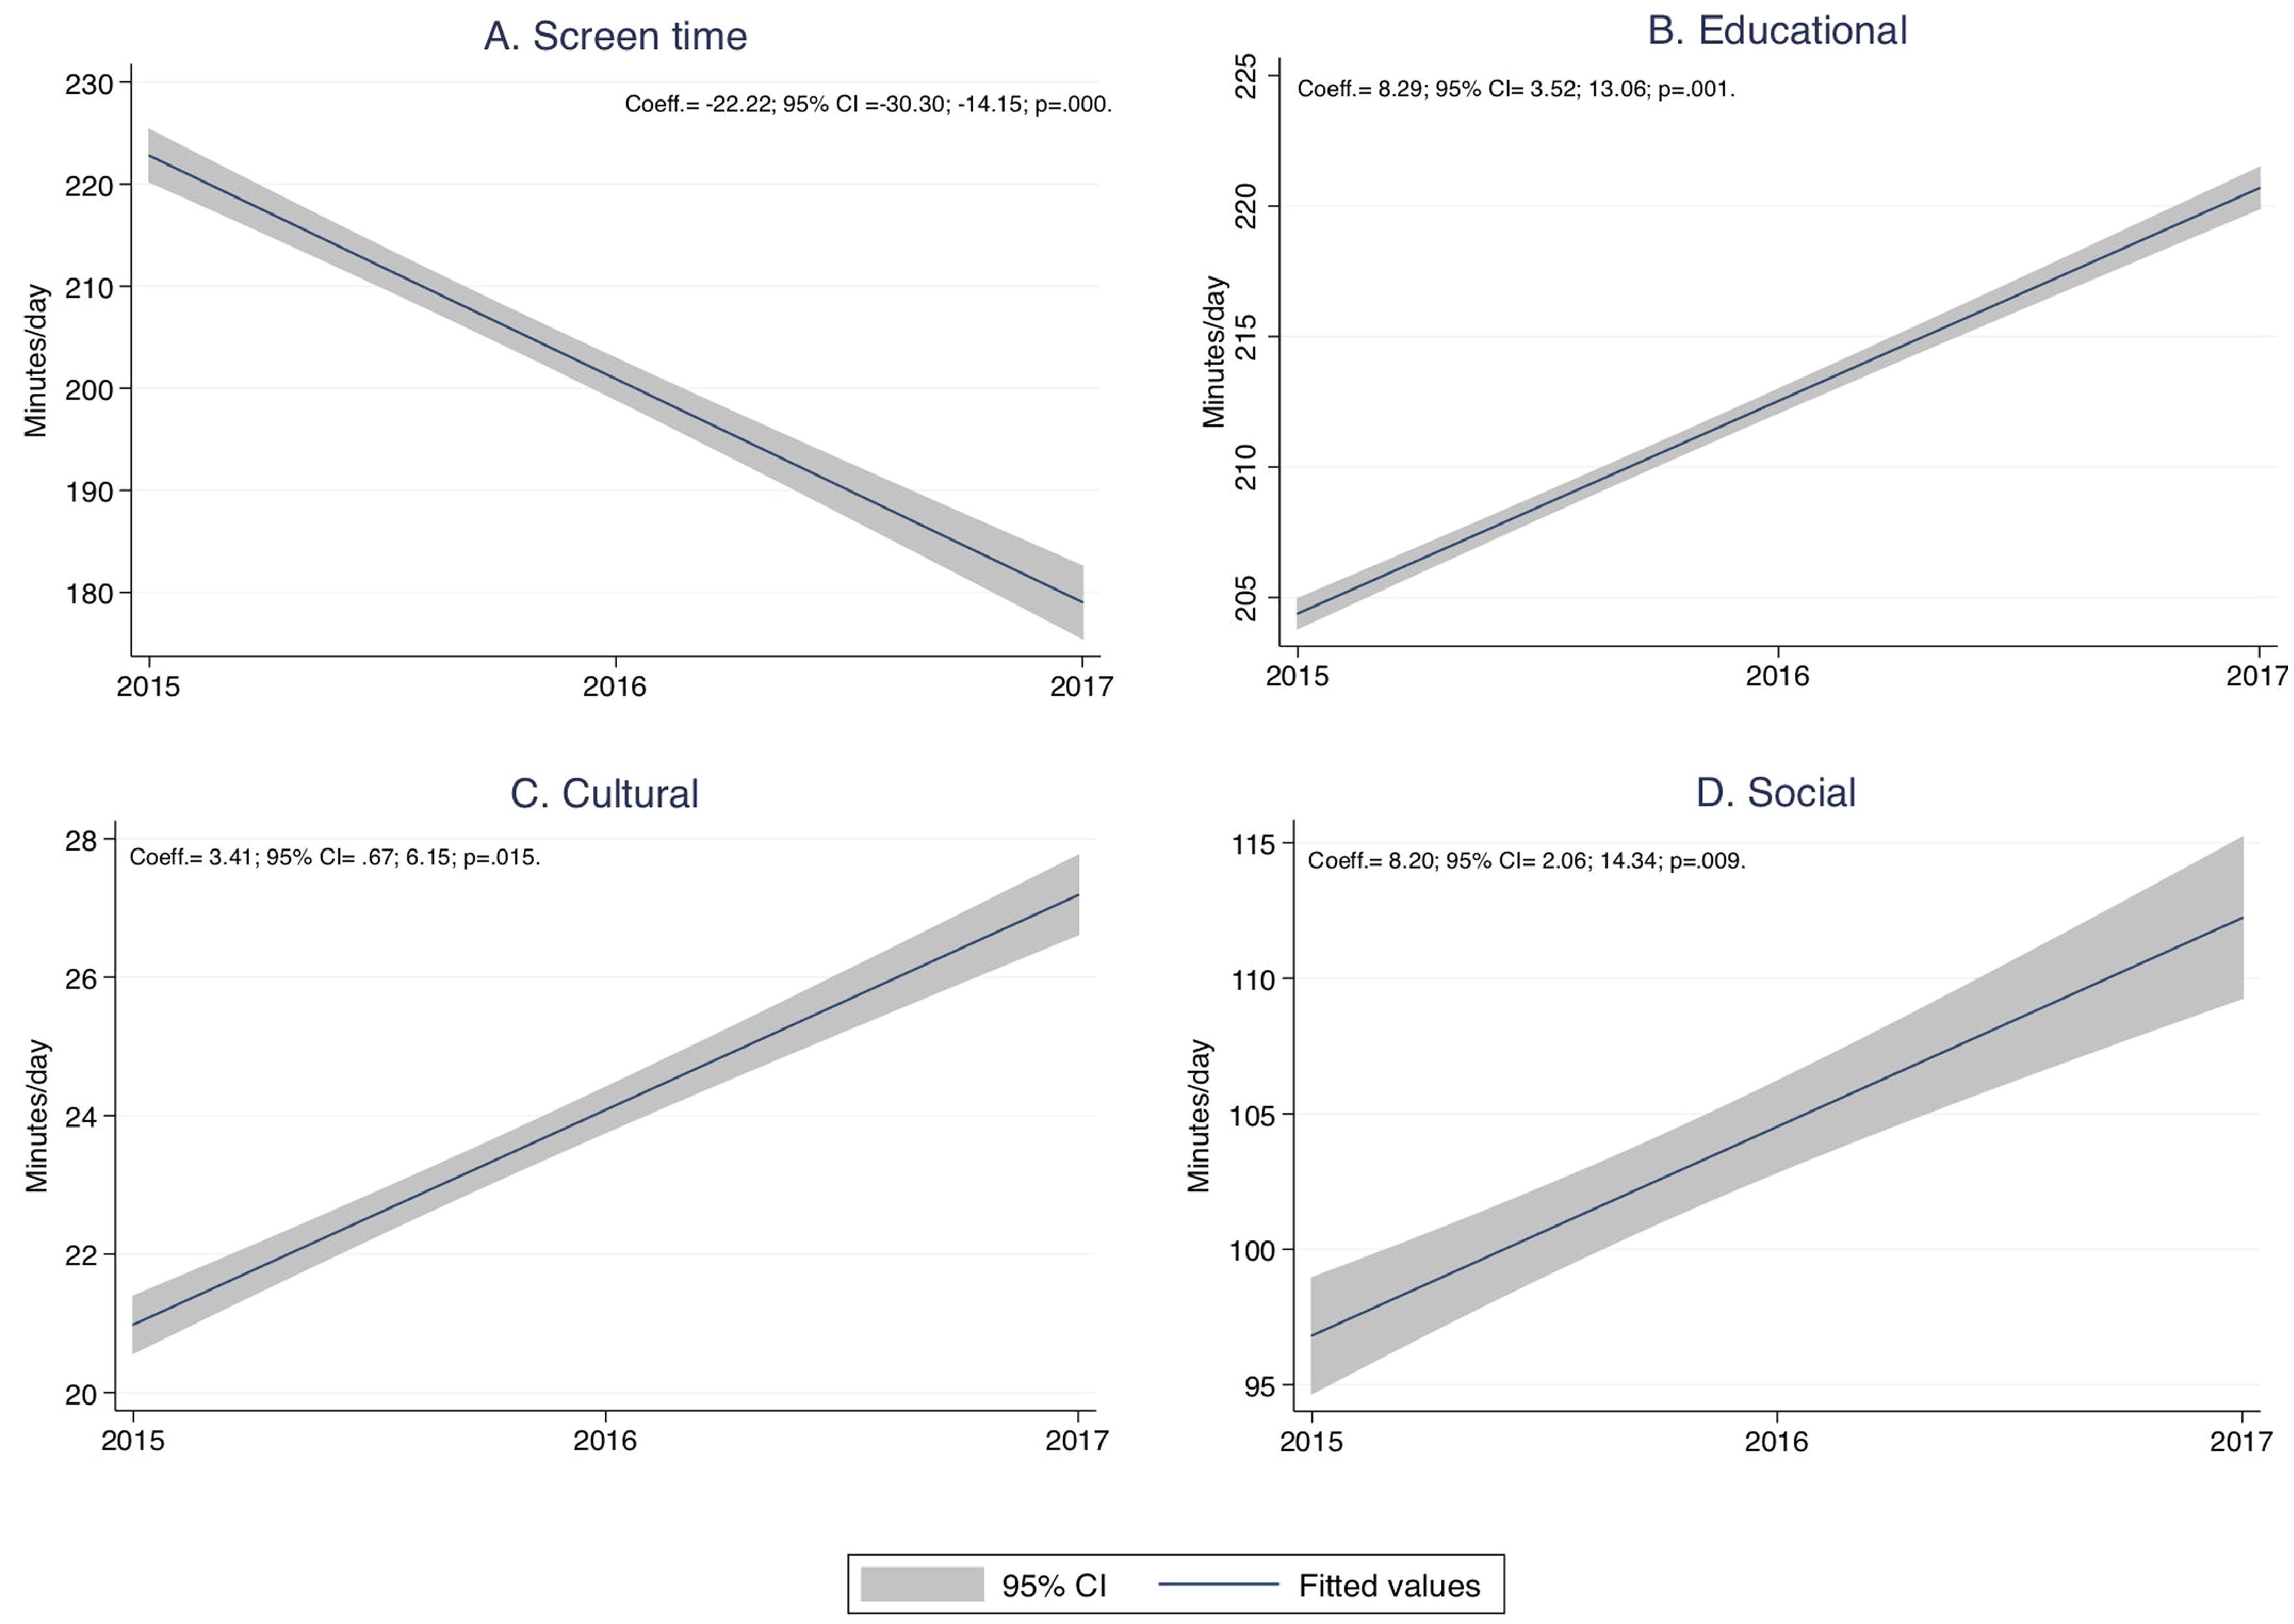
Table 2 shows the regression coefficients for changes and factors associated with sedentary activities for the whole week. The overall sedentary time was stable during follow-up (β: −3.98, 95%CI: −15.39; 7.42). The screen-time decreased (β: 22.22; 95%CI: −33.30; −14.15 – Supplementary File 3A), and the educational (β: 8.29; 95%CI: 3.52; 13.06 - Supplementary File 3B), cultural (β: 3.41; 95%CI: 0.67; 6.15 - Supplementary File 3C), and social (β: 8.20; 95%CI: 2.06; 14.34 - Supplementary file 3D) SB increased over the follow-up period.
Regression coefficients for changes in the week sedentary time (minutes/day) in adolescents from 2015 to 2017.
β, regression coefficients; 95%CI, 95% confidence intervals; PA, Physical activity; -, variables not included in the regression models (p>.20). Reference category: (Gender: boys; Age: < 14 years old; Income status: Low; Parent educational level: Low; PA participation: Low). BMI status did not reach p ≤ 0.20 for any of the analyzed sedentary activities.
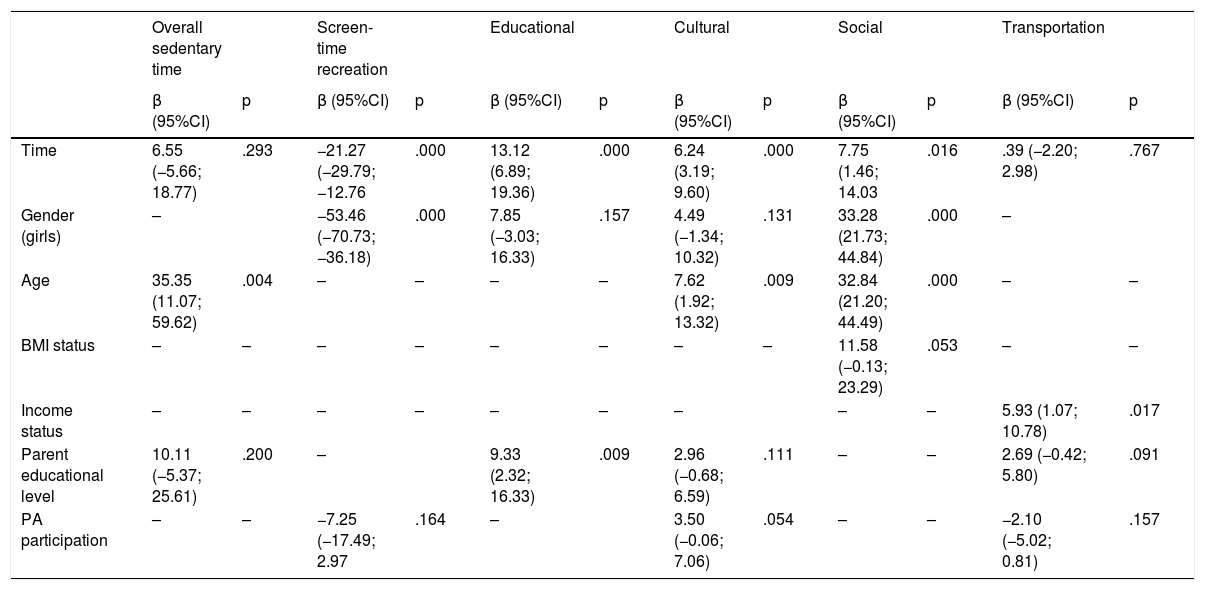
Tables 3 and 4 showed the regression coefficients for changes and factors associated with overall and time spent in different domains of SB for weekdays and weekend days, respectively. The overall sedentary time remained stable, screen-time decreased (β: −21.27; 95%CI: −29.79; −12.76) and educational (β: 13.12; 95%CI: 6.89; 19.36), cultural (β: 6.24; 95%CI: 3.19; 9.60), and social (β: 7.75; 95%CI: 1.46; 14.03) SB on weekdays increased from 2015 to 2017.
Regression coefficients for changes in weekdays sedentary time (minutes/day) in adolescents from 2015 to 2017.
β, regression coefficients; 95%CI, 95% confidence intervals; PA, Physical activity; -, variables not included in the regression models (p > .20). Refference category: (Gender: boys; Age: < 14 years old; BMI status: Underweight/Normal; Income status: Low; Parent educational level: Low; PA participation: Low).
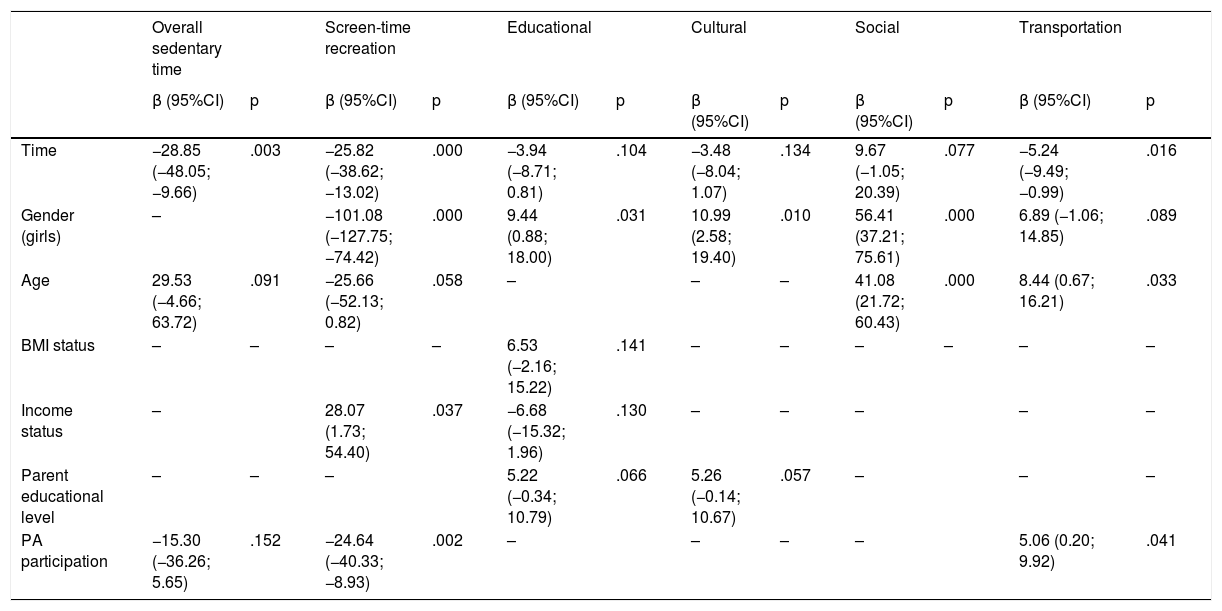
Regression coefficients for changes in weekend sedentary time (minutes/day) in adolescents from 2015 to 2017.
β, regression coefficients; 95%CI, 95% confidence intervals; PA, Physical activity; -, variables not included in the regression models (p > .20). Refference category: (Gender: boys; Age: < 14 years old; BMI status: Underweight/Normal; Income status: Low; Parent educational level: Low; PA participation: Low).
The overall sedentary time (β: −28.85; 95%CI: −48.05; −9.66), screen-time (β: −25.82; 95%CI: −38.62; −13.02), and transportation (β: −5.24; 95%CI: −9.49; 0.99) SB on weekend decreased from 2015 to 2017.
Factors associated with sedentary behaviorsGirls showed less screen-time than boys in the whole week (β: −67.53; 95%CI: −84.87; −50.18), weekdays (β: −53.46; 95%CI: −70.73; −36.18) and weekend analysis (β: −101.08; 95%CI: −127.75; −74.42). Girls spent more time in educational (Whole week; β: 8.29; 95%CI: 3.52; 13.06; Weekend: β: 9.44; 95%CI: 0.88; 18.00), cultural (Whole week: β: 3.41; 95%CI: 0.67; 6.15; Weekend: β:10.99; 95%CI:2.58; 19.40), and social (Whole week: β: 8.20; 95%CI: 2.06; 14.34; Weekend: β:56.41; 95%CI: 37.21; 75.61) SB than boys in the whole week and weekend days. For weekdays, this association was seen only for social sedentary activities (β: 33.28; 95%CI: 21.73; 44.84).
Adolescents aged ≥14 years at baseline were more sedentary than their younger peers (Overall: β: 33.15, 95%CI: 10.44; 55.87; Cultural: β: 6.32, 95%CI: 0.57; 11.71, and Social: β: 35.72; 95%CI: 24.10; 47.35). Similar results were seen in weekdays analysis, however, for weekend days, significant associations of age were seen for social sedentary activities (β: 33.28; 95%CI: 21.73; 44.84) only.
Adolescents with higher income status spent approximately 5 more minutes per day in transportation SB than adolescents classified as low-income. The income status was also associated with higher screen-time on the weekend (β: 28.07; 95%CI: 1.73; 54.40).
Adolescents with parents with higher education level spent more time in educational (β: 7.94; 95%CI: 2.32; 13.36) and cultural (β: 3.63; 95%CI:.15; 7.11) SB for the whole week analysis. The stratified analysis indicated that adolescents with parents from higher education levels spent more time in sedentary educational activities during the weekdays (β: 9.33; 95%CI: 2.32; 13.22).
Adolescents with greater engagement in PA spent less screen time than those with low participation in PA for the whole week (β: −11.23; 95%CI: −21.27; −1.18) and weekend days analysis (β: −24.64; 95%CI: −40.33; −8.93). Additionally, more active adolescents spent more time in transportation SB on the weekend (β: 5.06; 95%CI: 0.20; 9.92).
DiscussionThe present study found stability in the overall time spent in sedentary behaviors across adolescence; however, there were changes in specific domains of SB over time. Screen-time decreased, and the time spent on educational, cultural, and social activities increased over time. The decreased screen-time and increased time spent on other SB may explain the stability in overall sedentary time. This result denotes possible changes in preferences for sedentary activities by adolescents where they migrate from activities in front of the screen to other SB that included educational, cultural, and social activities.
The decreases shown for screen-time indicated that adolescents spent 22.22 min/day less time in this behavior for each year of the study, corresponding to a total decrease of approximately 20% between 2015 and 2017. Longitudinal studies showing changes in this type of sedentary behavior show contradictory results. Elinder, Heineman, Zeebary, & Patterson.23 found increases in time watching TV for boys and girls between 2009 and 2011. Likewise, Trang et al..10 showed a 28% increase in adolescents' screen-time between 2004 and 2009. Although the authors’ result indicates a decline in screen-time, the questionnaire used in this study did not include smartphones as a screen-time behavior. A high proportion of Brazilian adolescents have access to this device (90%).24 Some screen-time activities such as watching videos or playing video games are more likely to occur using a smartphone.25
Sedentary behaviors in the educational, cultural, and social domains increased yearly by 3.41 min/day for cultural, 8.20 min/day for social, and 8.29 min/day for educational SB. Changes in the time spent in educational SB may be due to activities outside of school since the school curriculum remained stable between 2015 and 2017, not increasing the daily class load. Also, it is expected that the educational requirements increase due to the greater complexity of the disciplines and university entrance exams. The changes in the time spent in the cultural and social sedentary activities might reflect the adolescents' involvement with activities that favor their personal and cognitive development and preparation for adult life.
Educational, cultural, and social sedentary activities are necessary for adolescents' daily lives and may not be a risk behavior. Moreover, higher engagement in educational and cultural activities are associated with better academic performance,26 and social interactions are related to better mental health in adolescents.27 Besides, the daily time spent on these activities may be balanced with engagement in PA.
Girls were less engaged in screen-time and more engaged in educational, cultural, and social sedentary activities than boys. The present study's results corroborate with previous evidence that show that girls spend less time watching TV and playing video games than boys[28] and usually spend more time in other activities such as homework and extracurricular cultural activities.10
Adolescents with higher income status spent more time on transportation than those from lower-income status. Income status plays an important role in adolescents' mode of transport.29 Adolescents with high-income status have more access to cars/motorcycles and can afford to pay for public transportation.29
Parental educational level was associated with time spent on educational and social SB. Adolescents with parents from a higher educational level spent more time on educational (7.94 min/day) and cultural (3.63 min/day) SB than adolescents with parents from a low educational level. Parents from a higher educational level may encourage their offspring to engage in this type of activity. However, the present study did not collect information that could help in understanding these associations.
The authors’ findings indicated that greater engagement in physical activities was inversely related to screen-time, especially for weekend days. Specifically, adolescents with higher participation in PA spent 11.23 min/day less screen-time during the whole week and 24.64 min/day less screen-time during the weekend. There is no consensus that participation in physical activity is antagonistic to sedentary behavior, especially screen-time. It is possible that active adolescents also spend several hours in screen-time.28 However, our results indicate that promoting a higher engagement on PA might help reduce screen-time in adolescents. The promotion of a more active lifestyle and the reduction of screen time is a target of efforts to improve adolescents' health conditions and is positively related to metabolic factors and other health behaviors.3
LimitationsThis study is not without limitations. The participant retention rate was 44.9% in this longitudinal study. High dropout rates are common in longitudinal studies. however, sedentary behaviors were not different between dropouts and adolescents who completed the study.
Public schools were randomly selected, but sample representativeness was compromised by the intentional selection of classrooms. Regardless of these limitations, this study included adolescents from different social classes and different neighborhoods in Curitiba-PR. Finally, ASAQ, used to assess SB, has limitations. It did not measure time spent using cellphones and smartphones. The use of these devices by adolescents has grown considerably in recent years, and it is a significant contributor to SB.25 However, ASAQ has adequate validity and provided information on the type and context of the activities performed. Information on changes in different SB domains was a strength of this study
Practical implicationsThe decrease in screen time and increased time spent on other sedentary activities suggests significant behavioral changes throughout adolescence; however, this study did not evaluate time spent using smartphones. It is essential for future investigations to include a measure of smartphone users to better understand the interplay between screen-time during adolescence.
The increased time in educational and cultural SB is not necessarily a negative outcome since such activities have an essential contribution to development. However, prolonged and uninterrupted periods in this type of SB might still be a health risk behavior, and interventions should focus on creating opportunities for adolescents to break up prolonged time in this SB. Evidence indicates that the school is an important environment to promote educational practices and create interventions to reduce prolonged time in SB.30
This study showed decreases in screen-time, together with increases in time spent on educational, cultural, and social sedentary activities from 2015 to 2017. The female gender was associated with less screen time and more time spent in social and cultural sedentary activities. Older adolescents had a higher overall sedentary time and spent more time in educational and cultural sedentary activities. Adolescents with more educated parents spent more time in educational and cultural sedentary activities. Finally, more active adolescents spent less time on screen-time.
FundingThis study was financed in part by the Coordenação de Aperfeiçoamento de Pessoal de Nível Superior - Brasil (CAPES) - Finance Code 001.
The authors acknowledge the Federal University of Paraná and CAPES- Brazil for supporting this study.


