
To investigate the factors associated with insulin resistance in children aged 4–7 years, and to identify the cutoff point of the triglyceride-glucose index for the prediction of insulin resistance in this population.
MethodsA cross-sectional study was conducted with 403 children from a retrospective cohort. Insulin resistance was also evaluated in a sub-sample using the HOMA index. Four indicators of body adiposity were assessed: body mass index, waist-to-height ratio, and the percentages of total and central body fat. Food habits were evaluated by the identification of dietary patterns, using principal component analysis. Information was also collected on lifestyle, socioeconomic status, and breastfeeding time.
ResultsThe median index observed in the sample was 7.77, which did not differ between the genders. The shorter the time spent in active activities, the higher the triglyceride-glucose value; and increase in the values of body adiposity indicators was positively associated with triglyceride-glucose. The cutoff point with the best balance between sensitivity and specificity values was 7.88 (AUC=0.63, 95% CI: 0.51–0.74).
ConclusionThe present study identified that total and central body adiposity and shorter time spent in lively activities was positively associated with insulin resistance, evaluated through the triglyceride-glucose index. The cutoff point of 7.88 may be used in this population for insulin resistance risk screening, but caution is required when using it in other populations.
Investigar os fatores associados à resistência à insulina em crianças de 4 a 7 anos, e identificar o ponto de corte do índice triglicerídeos-glicemia (TyG) para predição da RI nessa população.
MétodosEstudo transversal, com 403 crianças pertencentes a uma coorte retrospectiva. A resistência à insulina foi avaliada pelo índice triglicerídeos-glicemia e também pelo índice HOMA, este em uma subamostra. Avaliou-se quatro indicadores de adiposidade corporal: o índice de massa corporal, a relação cintura-estatura e os percentuais de gordura corporal total e central. O hábito alimentar foi avaliado pela identificação dos padrões alimentares, utilizando-se a análise de componentes principais. Foram coletadas também informações sobre estilo de vida, condição socioeconômica e tempo de aleitamento materno.
ResultadosA mediana observada do índice triglicerídeos-glicemia na amostra foi de 7,77 e não diferiu entre os sexos. Quanto menor o tempo diário em atividades ativas, maior o valor de triglicerídeos-glicemia; e o aumento nos valores dos indicadores de adiposidade corporal associou-se positivamente com o triglicerídeos-glicemia. O ponto de corte com melhor equilíbrio entre os valores de sensibilidade e especificidade foi o de 7,88 (AUC = 0,63; IC 95% 0,51 - 0,74).
ConclusãoO presente estudo identificou que a adiposidade corporal total e central e o menor tempo diário em atividades ativas associou-se positivamente com a resistência à insulina, avaliada pelo índice triglicerídeos-glicemia. O ponto de corte de 7,88 pode ser utilizado nessa população para triagem do risco de resistência à insulina, mas é necessário cautela na sua utilização em outras populações.
Metabolic syndrome (MS), characterized by the concomitant presence of insulin resistance (IR) and other metabolic alterations, such as obesity, dyslipidemias and arterial hypertension, has been shown to be highly prevalent in children, especially in those with excess body fat.1,2 This syndrome is known to be associated with a higher risk of developing cardiovascular diseases and tends to persist into adulthood, but its definition in children remains controversial.2,3
IR, the main indicator used in the diagnosis of MS, is characterized by reduced glucose uptake by the cells for a given insulin concentration. This syndrome has been identified as a public health problem, including in childhood.2,4 Studies have shown a strong association between IR and excess body adiposity, mainly in the central region, since the accumulation of intramuscular lipids from the entry of long-chain fatty acid into the cells inhibits the translocation of the glucose transporter (GLUT-4), reducing glucose uptake by the cells, which favors peripheral resistance to insulin action.4,5
There are several methods for the diagnosis of IR, but biomolecular evaluations of insulin receptors and post-receptors and the euglycemic-hyperinsulinemic clamp test, considered the “gold standard,” are expensive and not easily accessible for most of the population.6,7 The Homeostasis Model Assessment (HOMA) method has been widely used in studies for the diagnosis of IR and has been validated for children.8 However, to calculate the HOMA index, it is necessary to measure serum insulin levels, which in most cases is not part of the routine assessment in the health services, especially in the pediatric population, which makes it difficult to use this index for identification of IR in this population.
Recently, the TyG index (the product of the serum triglyceride concentration and fasting glycemia) has been used in studies to evaluate IR in adults7,9,10 and adolescents,2,11 demonstrating good discriminatory power for the diagnosis of IR.
No studies were identified that tested the TyG index in preschoolers and schoolchildren. Moreover, there was a scarcity of studies evaluating factors other than adiposity that may be associated with IR in children, such as dietary patterns and lifestyle. With the identification of the factors associated with IR in childhood, early intervention can be undertaken, aimed to reduce the risk of cardiovascular diseases throughout life and, consequently, reducing public health expenditures.
Considering these facts, the aim of this study was to investigate the factors associated with IR in children aged 3–7 years and to identify the TyG index cutoff point used for IR prediction in this population.
MethodsDesign and sampleThis was a cross-sectional study, conducted with children from a retrospective birth cohort at the only maternity hospital in the municipality of Viçosa, state of Minas Gerais, Brazil. The children were followed by the Lactation Support Program (Programa de Apoio à Lactação [PROLAC]) during the first year of life and were reassessed at age of 4–7 years. PROLAC is a program of Universidade Federal de Viçosa in partnership with the Human Milk Bank of the municipality. Its main activities are providing guidance to mothers in the postpartum period with the aim to promote breastfeeding, as well as nutritional care for children in their first year of life and for their mothers.
Based on information collected from the PROLAC care records and considering two inclusion criteria (presence of identification data that allowed locating the children and date of birth compatible with age between 4 and 7 years at the time of the study), 669 children were considered eligible for the study. Among those considered eligible to participate, 176 were not located (change of address) after at least three attempts to locate the children through home visits, 75 were not authorized by parents/guardians to participate or did not complete all stages of the study, and eight had problems that prevented their participation. Moreover, eight children were excluded as they had incomplete food consumption data and/or biochemical tests. Thus, the present study sample consisted of 402 children.
The study was approved by the Human Research Ethics Committee of Universidade Federal de Viçosa (Ref. No. 892476/2014) and the norms regulating research involving human beings were adopted, according to the National Health Council (resolution No. 466/2012). The parents or guardians of all children included in the study signed the Informed Consent.
Body adiposityThe adiposity indicators evaluated were body mass index (BMI) and total body fat, which estimate total adiposity; and the waist-to-height ratio (WHtR) and central fat, which estimate the risk associated with abdominal adiposity.
Weight was measured on an electronic digital scale with a capacity of 150kg and accuracy of 10g, whereas height was measured with a vertical stadiometer fixed to the wall, with a 2-m extension, divided in centimeters and subdivided in millimeters. BMI for age (BMI/A) was calculated as Z-score according to gender, using the World Health Organization reference.12
Waist circumference was measured at the level of the umbilicus, using a 2-m flexible and inelastic measuring tape, divided into centimeters and subdivided into millimeters. The measurements were performed in triplicate, with the two closest ones being used to calculate the mean. The waist-to-height ratio (WHtR) was calculated based on the ratio of the waist circumference (cm) and the height (cm), considering risk values those >0.5.13
Body composition assessment was performed using dual energy X-ray absorptiometry (DXA), and the results of the percentage of total and central fat were used for the analyses. All evaluations were performed at the UFV Health Department.
Insulin resistance (IR)Blood collection was performed at the clinical analysis laboratory of the Health Department of the UFV, after a 12-h fast. Serum triglyceride and fasting blood glucose levels were measured. Additionally, fasting insulin was evaluated in a subsample of study children (35%, n=141).
To evaluate insulin resistance (IR), the TyG index was calculated as: ln[fasting triglycerides (mg/dL)×fasting glucose (mg/dL)/2].9,11 The IR estimate was also obtained in a subsample of 141 children through the Homeostasis Model Assessment for Insulin Resistance (HOMA-IR), which is the product of fasting insulin (μU/mL) and fasting glycemia (mmol/L), divided by 22.5.14 Insulin resistance was defined when the HOMA-IR value was higher than the 90th percentile of the sample.1,4 This method was adopted as the reference to determine the TyG index cutoff point.
Dietary patternsTo evaluate study children's food intake, parents or guardians were asked to complete three food records on non-consecutive days, one of which was during the weekend. All records were checked and reviewed by the investigators, along with parents/guardians, to reduce reporting biases. The data were entered and processed using a software (Dietpro® software, version 5i, MG, Brazil).
In the identification of food patterns, an a posteriori statistical method was applied through principal component analysis (PCA). Before PCA was performed, sample size adequacy and analysis applicability were evaluated, estimating the Kaiser–Meyer–Olkin coefficient (KMO=0.561) and the Bartlett sphericity test (p<0.001). For a better interpretation of the factors, varimax orthogonal rotation was applied, and the number of factors/components to be retained was determined based on the plot of Cattell's scree test.
Foods/groups with factorial loads±≥0.25 were considered strongly associated with the component, providing better information for the identification of a food pattern. For pattern denomination, the characteristics of the foods/groups that contributed the most to each component were considered, as well as the nomenclatures used in other studies.15,16
After the identification of the dietary patterns, the factor scores were calculated for each child in the study; thus, each one had a factorial score in all identified patterns.
Socio-demographic, lifestyle, and breastfeeding variablesA semi-structured questionnaire was applied to the child's parent/guardian to obtain sociodemographic information, such as age and per capita income. The information on life habits was obtained by applying a questionnaire adapted from Andaki.17 The assessed variables were: daily screen time (television, computer, games) and daily time spent in active activities (running, cycling, playing ball). Data on exclusive breastfeeding time (EBF) were obtained from the PROLAC records.
Data analysisDescriptive analysis of the data was performed through measures of frequency distribution, central tendency, and dispersion. The distribution of variables was assessed using the Shapiro–Wilks normality test.
Linear regression was used to investigate the factors associated with IR in the study children, estimating the regression coefficient and the confidence interval. In the bivariate analysis, variables with a value of p<0.20 were considered for inclusion in the multiple model. The analyses were performed using a software (Stata Statistical Software: Release 13. College Station, TX, USA) and the statistical significance considered was α=5%.
To identify the TyG index cutoff point for IR prediction in the study children, the receiver operating characteristic (ROC) curve was analyzed, considering the cutoff point with the best balance between sensitivity and specificity values. HOMA-IR was the reference method used for identification of the TyG index cutoff point. The analysis of the ROC curve was performed using a software (MedCalc® software, Belgium).
ResultsMost study children were males (55%), with a median age of 73 months. There was no difference in TyG index between genders (p=0.355). The prevalence of excess weight (overweight or obesity) and alterations in the WHtR index was 25.6% and 26.8%, respectively (data not shown).
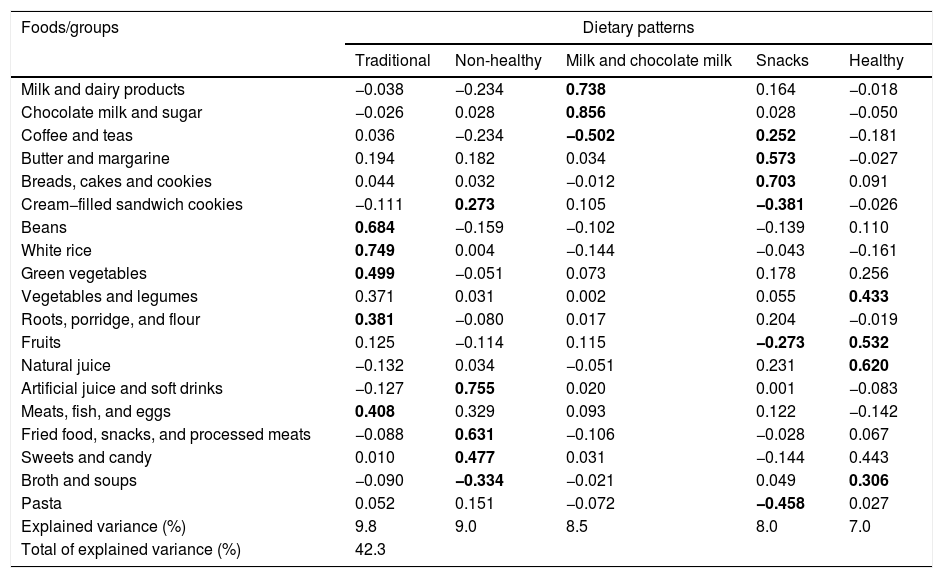
As for food consumption, five food patterns were identified among the study children through the PCA, which explained 42.3% of the data variance (Table 1). The food patterns were called “Traditional” (consisting of foods/preparations typical of Brazilian food, such as: white rice, beans, vegetables, roots, porridge and flour, and meats, fish, and eggs); “Unhealthy” (represented mainly by foods/groups with high sugar and fat content: artificial juice and soft drinks, fried foods, snacks, processed meats, sweets and cream-filled cookies); “Milk and chocolate milk” (mainly represented by milk and dairy products and chocolate powder); “Snacks” (consisting mainly of typical bakery foods: breads, cakes and cookies, butter and margarine, coffee and teas); “Healthy” (natural juice, fruits, vegetables, and broth/soups).
Dietary patterns and factorial loads of food groups consumed by children aged 4–7 years.
| Foods/groups | Dietary patterns | ||||
|---|---|---|---|---|---|
| Traditional | Non-healthy | Milk and chocolate milk | Snacks | Healthy | |
| Milk and dairy products | −0.038 | −0.234 | 0.738 | 0.164 | −0.018 |
| Chocolate milk and sugar | −0.026 | 0.028 | 0.856 | 0.028 | −0.050 |
| Coffee and teas | 0.036 | −0.234 | −0.502 | 0.252 | −0.181 |
| Butter and margarine | 0.194 | 0.182 | 0.034 | 0.573 | −0.027 |
| Breads, cakes and cookies | 0.044 | 0.032 | −0.012 | 0.703 | 0.091 |
| Cream−filled sandwich cookies | −0.111 | 0.273 | 0.105 | −0.381 | −0.026 |
| Beans | 0.684 | −0.159 | −0.102 | −0.139 | 0.110 |
| White rice | 0.749 | 0.004 | −0.144 | −0.043 | −0.161 |
| Green vegetables | 0.499 | −0.051 | 0.073 | 0.178 | 0.256 |
| Vegetables and legumes | 0.371 | 0.031 | 0.002 | 0.055 | 0.433 |
| Roots, porridge, and flour | 0.381 | −0.080 | 0.017 | 0.204 | −0.019 |
| Fruits | 0.125 | −0.114 | 0.115 | −0.273 | 0.532 |
| Natural juice | −0.132 | 0.034 | −0.051 | 0.231 | 0.620 |
| Artificial juice and soft drinks | −0.127 | 0.755 | 0.020 | 0.001 | −0.083 |
| Meats, fish, and eggs | 0.408 | 0.329 | 0.093 | 0.122 | −0.142 |
| Fried food, snacks, and processed meats | −0.088 | 0.631 | −0.106 | −0.028 | 0.067 |
| Sweets and candy | 0.010 | 0.477 | 0.031 | −0.144 | 0.443 |
| Broth and soups | −0.090 | −0.334 | −0.021 | 0.049 | 0.306 |
| Pasta | 0.052 | 0.151 | −0.072 | −0.458 | 0.027 |
| Explained variance (%) | 9.8 | 9.0 | 8.5 | 8.0 | 7.0 |
| Total of explained variance (%) | 42.3 | ||||
Extraction method: principal component analysis. Varimax rotation with Kaiser normalization.
Values in bold indicate factorial loads±≥0.25.
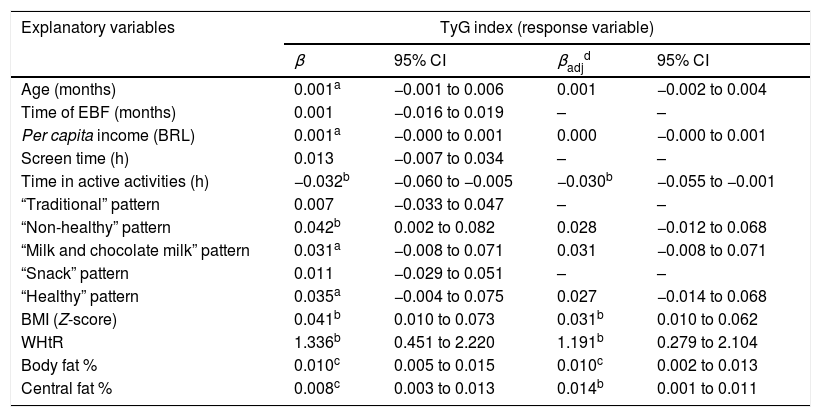
In the simple linear regression analysis, it was observed that the higher adherence to the “Unhealthy” food pattern was positively associated with the TyG index; as for the daily time spent in active activities, it was negatively associated with the index; that is, the less active the child, the higher the TyG value. Moreover, with each increase of one unit in the four indicators of body adiposity assessed, the higher the TyG values observed in the study children (Table 2).
Bivariate and multiple linear regression used to investigate factors associated with variation in the TyG index in children aged 4–7 years (n=402).
| Explanatory variables | TyG index (response variable) | |||
|---|---|---|---|---|
| β | 95% CI | βadjd | 95% CI | |
| Age (months) | 0.001a | −0.001 to 0.006 | 0.001 | −0.002 to 0.004 |
| Time of EBF (months) | 0.001 | −0.016 to 0.019 | – | – |
| Per capita income (BRL) | 0.001a | −0.000 to 0.001 | 0.000 | −0.000 to 0.001 |
| Screen time (h) | 0.013 | −0.007 to 0.034 | – | – |
| Time in active activities (h) | −0.032b | −0.060 to −0.005 | −0.030b | −0.055 to −0.001 |
| “Traditional” pattern | 0.007 | −0.033 to 0.047 | – | – |
| “Non-healthy” pattern | 0.042b | 0.002 to 0.082 | 0.028 | −0.012 to 0.068 |
| “Milk and chocolate milk” pattern | 0.031a | −0.008 to 0.071 | 0.031 | −0.008 to 0.071 |
| “Snack” pattern | 0.011 | −0.029 to 0.051 | – | – |
| “Healthy” pattern | 0.035a | −0.004 to 0.075 | 0.027 | −0.014 to 0.068 |
| BMI (Z-score) | 0.041b | 0.010 to 0.073 | 0.031b | 0.010 to 0.062 |
| WHtR | 1.336b | 0.451 to 2.220 | 1.191b | 0.279 to 2.104 |
| Body fat % | 0.010c | 0.005 to 0.015 | 0.010c | 0.002 to 0.013 |
| Central fat % | 0.008c | 0.003 to 0.013 | 0.014b | 0.001 to 0.011 |
TyG, triglyceride-glucose index; BRL, Brazilian reals; BMI, body mass index; WHtR, waist-to-height ratio; EBF, exclusive breastfeeding.
In the multiple model, the variables that remained independently associated with the TyG index were variables of daily time spent in active activities and body adiposity. The lower the daily time spent in active activities, the higher the TyG value; and increase in BMI, WHtR, percentage of total, and central fat was positively associated with TyG (Table 2).
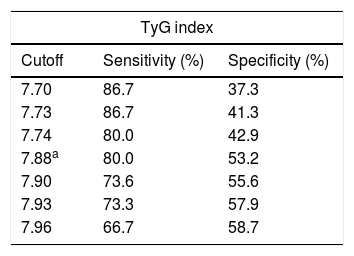
Of the TyG index cutoff points tested to predict IR in the study children, the best balance between the sensitivity (S) and specificity (Sp) values was 7.88 (Table 3). Considering this cutoff point, the prevalence of IR in the study children was 42.3% (n=170).
Cutoff points, sensitivity, and specificity of the Tyg index for insulin resistance prediction in children aged 4–7 years.
| TyG index | ||
|---|---|---|
| Cutoff | Sensitivity (%) | Specificity (%) |
| 7.70 | 86.7 | 37.3 |
| 7.73 | 86.7 | 41.3 |
| 7.74 | 80.0 | 42.9 |
| 7.88a | 80.0 | 53.2 |
| 7.90 | 73.6 | 55.6 |
| 7.93 | 73.3 | 57.9 |
| 7.96 | 66.7 | 58.7 |
In this study, conducted with children aged 4–7 years from a retrospective cohort, it was observed that the increase in total and central body adiposity and a shorter daily time spent in active activities were positively associated with IR, evaluated by the TyG index. The association between adiposity and IR has been described in other studies with children3,18,19; however, methodological differences, mainly regarding the method used and the cutoff points for the diagnosis of IR, make it difficult to compare the results.
A recent study carried out with Japanese schoolchildren found that increased abdominal adiposity, as assessed by the WHtR, was associated with an increased prevalence of IR, detected by the HOMA index.20 Nightingale et al.18 performed a study of children from different regions of the world, and similar to the present study, evaluated body and central adiposity according to different indicators. The authors observed a positive association between all indicators of adiposity and IR, when evaluated by the HOMA index.
In Brazil, Ferreira et al.1 carried out a cross-sectional study with children and adolescents aged 7–11 years, and found that BMI was positively associated with IR, as assessed by the HOMA index. The present authors did not identify any national studies that evaluated IR only in children (younger than 10 years), without including adolescents; they understand the importance of studying metabolic alterations in prepubertal children, without including those already at puberty, in which the effects of steroid hormones can be already observed. Mainly in relation to IR and MS frequency, there is evidence that they increase with puberty.21
Peplies et al.,22 in a longitudinal study carried out with children aged 3–10 years living in eight European countries, found a positive association between body adiposity (assessed by BMI and waist circumference), sedentary behavior, and presence of IR. These findings corroborate those observed in the present study, when, after adjusting for other variables, the longer daily time spent in active activities was associated with lower TyG index values.
Sedentary behavior, which is increasingly observed among children, has been considered an important behavioral risk factor for the development of metabolic alterations, such as IR and dyslipidemia.22,23 Thus, it is crucial to encourage in regular physical activity practice and discourage sedentary behavior at this phase.
The prevalence of excess weight (as measured by BMI) and central adiposity (when using the WHtR) were high in the study children, around 25%, similar to that observed in other studies with a similar age group16,24 and also according to the Family Budget Survey carried out in Brazil, where the prevalence of excess weight in boys and girls aged 5–9 years was 34.8% and 32.0%, respectively.25 In children, obesity, especially abdominal obesity, seems to be an important trigger for insulin resistance,26 which makes obese children a risk group for metabolic alterations, reinforcing the need to define clinical and laboratory indicators for diagnosis in this group.27 Studies have shown that the combination of BMI and waist circumference improved the prediction of cardiometabolic risk factors in children.22,28 Thus, for an early and more reliable diagnosis of adiposity alterations in children, more than one indicator should be used whenever possible.
In the bivariate analysis, the “Unhealthy” dietary pattern was positively associated with the TyG index; that is, children with a higher intake of foods rich in simple sugars and fat had a higher risk of IR. However, after adjusting for lifestyle and adiposity variables, this association was not maintained, due to the strong association between body adiposity and IR. As in the present study, Peplies et al.22 also found no association between the consumption of sugar-rich foods and IR in children (assessed by the HOMA index) after adjustment for nutritional status. However, it is a consensus that the adoption of a healthy dietary pattern, characterized by the consumption of fruits, vegetables, lean meats, and low intake of sugars and fats, is a determining factor for a lower risk of chronic diseases such as obesity, metabolic syndrome, and cardiovascular diseases. This beneficial effect can be explained, at least in part, by the diet's modulating role on biomarkers of insulin sensitivity and atherogenesis, as well as inflammation and endothelial function.29,30
Another relevant result of the study is the cutoff point established for children aged 4–7 years. In the ROC curve analysis, the AUC of 63% indicated a moderate accuracy of the TyG index to identify IR among the study children. However, it is noteworthy that there is no consensus regarding the use of the HOMA index (reference method used) in the assessed age group, especially in relation to the best cutoff point to be used,18,27 which may have influenced the accuracy of the index test.
The cutoff point higher than 7.88 was the one that showed the best balance between sensitivity (80.0%) and specificity (53.2%). The cutoff point with a higher sensitivity value in relation to the specificity was chosen to use the TyG index for early identification of IR, so children with a TyG index higher than 7.88 should be considered as having a higher risk for IR development, when compared to those with lower TyG values, and not as already showing IR. If IR risk is identified by TyG, another more precise and more specific method can be used to confirm the diagnosis.
A study carried out with Korean adolescents aged 10–18 identified cutoff points for the TyG index to predict metabolic syndrome, using different diagnostic criteria for the syndrome. The cutoffs ranged from 8.41 to 8.66, with all sensitivity values higher than those of specificity, thus suggesting, as in the present study, the use of the index for the screening of metabolic risk.2
This study has limitations, especially the fact that the cutoff point of the TyG index is specific for the assessed sample, which impairs the extrapolation of results and its use in other populations. Thus, it is necessary to conduct multicenter studies with children to establish cutoff points for the TyG index, considering different ethnicities. However, this result is still of great scientific relevance, since it is the first aimed at a specific age group, which can be used as a starting point for future studies.
In conclusion, the present study identified that total and central body adiposity and a shorter daily time spent in active activities were positively associated with IR, assessed by the TyG index in children aged 4–7 years, indicating the importance of adopting healthy lifestyle habits, such as regular practice of physical activity and adequate nutrition since childhood, as well as the maintenance of an adequate nutritional status, since body adiposity and lifestyle are associated with cardiovascular risk throughout life. Additionally, the TyG cutoff point of 7.88 was identified, which can be analyzed for future use in screening for IR risk and the associated chronic diseases in this population.
FundingFundação de Amparo à Pesquisa do Estado de Minas Gerais – Fapemig. Process number: Fapemig 02055-13. Conselho Nacional de Desenvolvimento Científico e Tecnológico – CNPq. Process number: CNPQ 485124/2011-4.
Conflicts of interestThe authors declare no conflicts of interest.
The authors would like to thank the children who participated in the project and their parents/guardians. They also thank Capes for the Doctoral Grant. This project received financial support from FAPEMIG and CNPq.
Please cite this article as: Vieira-Ribeiro SA, Fonseca PC, Andreoli CS, Ribeiro AQ, Hermsdorff HH, Pereira PF, et al. The TyG index cutoff point and its association with body adiposity and lifestyle in children. J Pediatr (Rio J). 2019;95:217–23.
Study conducted at Universidade Federal de Viçosa (UFV), Viçosa, MG, Brazil.


