

Monitoring of healthy children should include precise assessment of their nutritional status to identify children and adolescents at risk of nutrition disorders. Therefore, the aim of this study was to assess the nutritional status of healthy children using different nutritional risk screening tools.
MethodThe study sample consisted of 550 participants within the age range of 7–15 years. Anthropometric characteristics (body mass, height, body mass index) were collected using standard procedures. In addition, the following parameters were analyzed: fat mass, fat-free mass, body cell mass, and total body water.
ResultsThe results revealed that variables such as children's age and sex significantly differentiated the values of selected components of the body composition.
ConclusionsThis observation suggests that it is necessary to use different methods to evaluate nutritional status among healthy children.
Regular monitoring of healthy children should include nutritional status to identify children at risk of nutrition disorders. The results revealed various disorders in nutritional status among healthy children.1,2 The above findings are compatible with the World Health Organization (WHO) long-term strategy for 2015–2020.3 The European Childhood Obesity Surveillance Initiative program indicates that every third child attending primary school is overweight (24–57% boys vs. 21–50% girls) or obese (9–31% boys vs. 6–21% girls).4 Numerous researchers point to a directly proportional relationship between body mass index (BMI) and child's age, and the incidence of nutritional disorders in adulthood.4,5
BMI is the simplest and fastest method used to assess nutritional status. Unfortunately, simple assessment indices can produce unreliable results. BMI is only a measure of weight relative to height and does not provide information about total body fat mass (FM). Bioelectrical impedance analysis (BIA) has been commonly used to assess body composition in adolescents and children in a few components (FM and fat-free mass (FFM), total body water (TBW) consist of intracellular and extracellular body water (ICW and ECW).6 BIA can be successfully used in healthy7 and sick children,8 as published by the authors’ research team in the last 3 years.9–11
It should be remembered that the dynamics of body composition changes vary at different periods of life. Lifestyle, age, gender, level of physical activity, the menstrual cycle, body composition and ethnicity, and type of analytical equipment may affect the level of fatness. In children, an initial intense increase in "dry body weight" is observed, which ends at 16–19 years in women and 20–25 years in men.12 The combination of both methods – screening (BMI) followed by in-depth assessment (BIA) – can be an effective compromise in monitoring a child's health.13
Therefore, the aim of this study was to perform an assessment of the nutritional status of healthy children and selected components of body composition using bioelectrical impedance analysis.
Materials and methodsEthicsThe study was approved by the Institutional Review Board at the University. The study was conducted in accordance with ethical standards laid down in the relevant version of the Declaration of Helsinki (64th WMA General Assembly, Fortaleza, Brazil, October 2013) and in legal regulations.
SubjectsThe study was conducted between March 2016 and April 2018 in southeast Poland. The cross-sectional study included 550 healthy children (262 girls and 288 boys) aged 7–15, divided into three groups.
The inclusion criteria were as follows: age 7–15 years, lack of acute or chronic disease that may affect the nutritional status, as well as the lack of contraindications specified by the manufacturer of the BIA device.
The study group was taken from five schools: primary, junior high, and high schools from urban and rural areas of the Podkarpacie, as a part of meetings with parents and children during social campaigns promoting a healthy lifestyle among children and adolescents. Participation in the study was voluntary and anonymous. The purpose and procedures of the study were explained. A flow-chart demonstrating the selection of the study group is presented in Fig. 1.
AssessmentsAnthropometric measurements and body mass index
In all children, body height and weight were measured, and BMI was calculated. Bodyweight and height were assessed with an accuracy of 0.1 kg/0.1 cm using a digital scale (Radwag 100/200 OW, Radom, Poland). BMI was calculated as weight in kg/height in meters, squared (kg/m2). For all participants, BMI fell into one of the WHO categories and was interpreted using percentile growth charts for height and weight developed as a part of the nationwide research projects OLAF and OLA published in 2011. Cut-off points for BMI using the nationwide OLAF percentile charts of Polish children (Caucasian) according to the cut-off: BMI ≤ 5 centile; BMI 6–84 centile; BMI 85–94 centile; BMI ≥ 95 centile.14,15
Bioelectrical impedance analysisThe parameters R (Ω, resistance) and Xc (Ω, reactance) were obtained using the bioelectrical impedance analyzer AKERN BIA - 101 (Akern SRL, Pontassieve, Florence, Italy). The results were analyzed using dedicated software (Bodygram1_31 from AKERN, Pontassieve, Florence, Italy). The following measures were analyzed: fat mass (FM), fat-free mass (FFM), body cell mass (BCM), and total body water (TBW). In order to obtain information on the nutritional status of the studied children and the possibility of relating body composition parameters to the BMI value, the study applied cut-off points in a 2-level model for FM and FFM. The original cut-off points of nutritional disorders analyzed in relation to FM and FFM, proposed by Wells16 that are cut-off for: ≤ 2nd percentile, 3–91 percentile; 92–97 percentile; ≥ 98 percentile. The equations used by the software to assess the specific parameters are restricted property of the company.
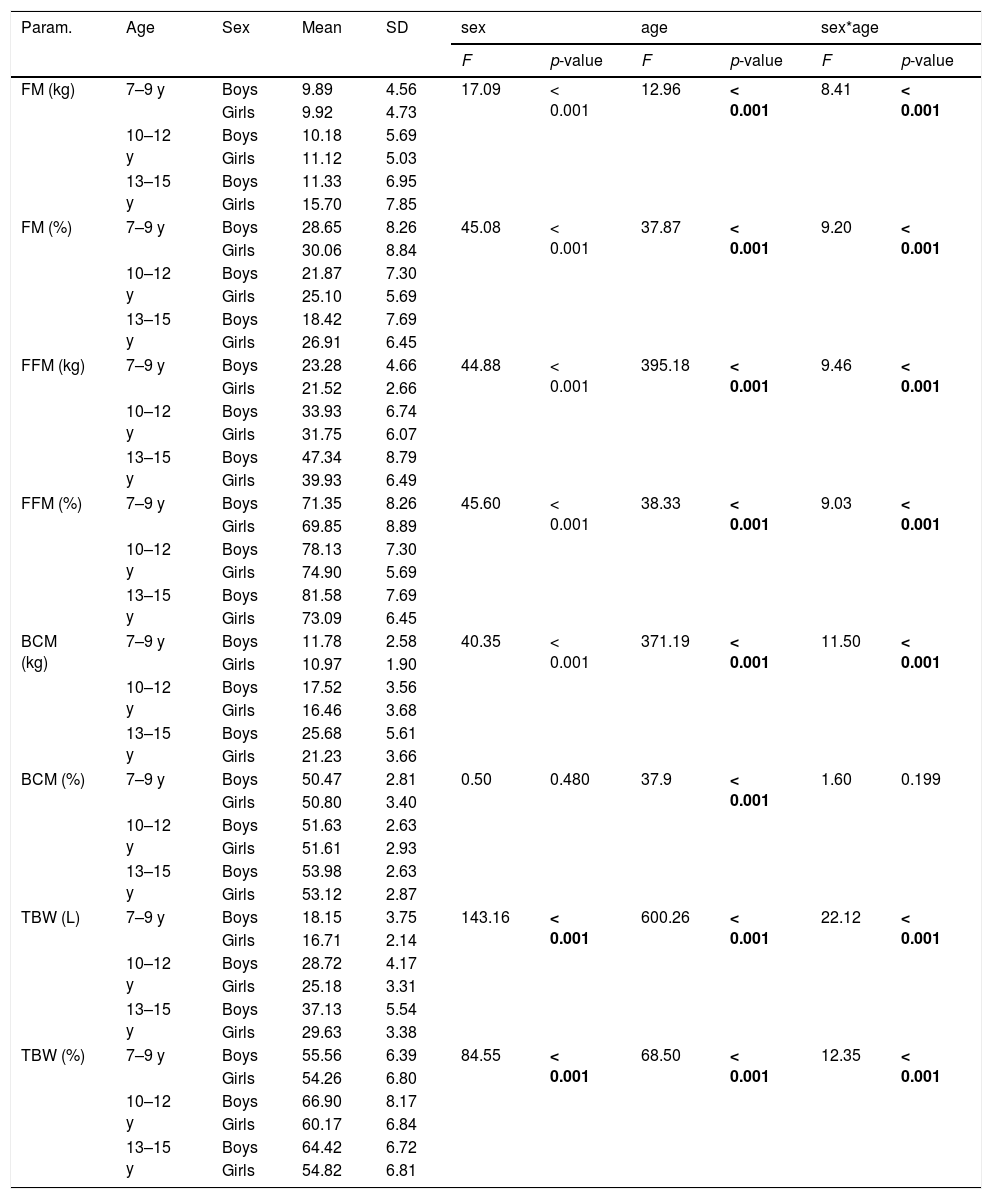
Statistical analysisStatistical analyses were performed using StatSoft software (Statistica package, version 13.1, SoftStat Corporation, Poland). Normality of distribution was assessed with the Shapiro-Wilk test. The continuous data are presented as mean ± standard deviation (SD). The Mann–Whitney U Test was used in cases of non-parametric distribution. Obtained values are presented as median and quartiles. Table 1 assesses the simultaneous effects of two variables using a two-way analysis of variance Anova. A p-value of < 0.05 was considered an indication of a statistically significant result.
BIA results in the study group of girls and boys.
FM, fat mass; FFM, fat free mass; BCM, body cell mass; TBW, total body water; SD, standard deviation.
Bold characters indicate significant values (p < 0.05).
F test - two-way analysis of variance Anova.
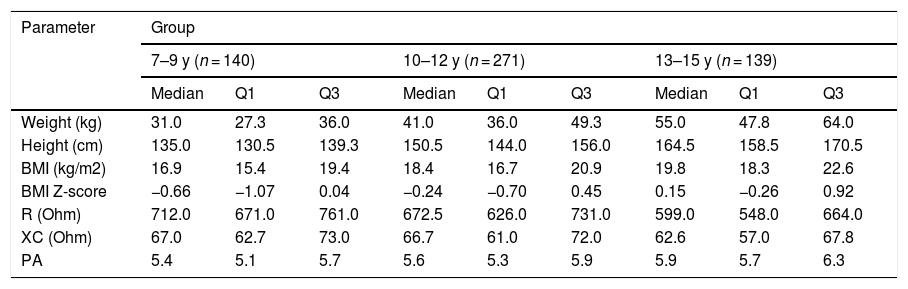
Table 2 presents the cross-sectional characteristics of basic anthropometric (body weight, height), impedance (resistance, reactance) and nutritional status (BMI, BMI Z-score) parameters in three age groups of children. A clear trend was noticeable in the decrease of resistance and reactance values with the age of the studied children, which had a significant impact on the results of obtained body composition components.
Anthropometric parameters of the study participants.
BMI, body mass index; BMI Z-score, body mass index Z-score; R, resistance; XC, reactance; PA, phase angle.
Values are presented as median and quartiles (Q1, quartile 1; Q3, quartile 3).
Table 1 presents the differences in the values of selected body composition components depending on the age and sex of the respondents.
Only the relationship with age was significant for this parameter (the higher the age range, the higher the BCM% values). In the case of the remaining parameters, both the age of the respondents and their sex, as well as the simultaneous effect of these two factors, had a statistically significant influence on its value. FM (kg) increased with age and was higher among girls than boys. With the simultaneous influence of these two factors, the highest values were found among girls in the highest age range. FM% decreased with age and was higher in girls than in boys. With the simultaneous influence of two variables, the highest values obtained girls in the lowest age range.
FFM kg / FFM% / BCM kg / TBW L increased with age. It was higher in boys than in girls, the highest in the oldest boys. In the case of TBW%, the highest values were found in boys, while the age range was 10–12 years.
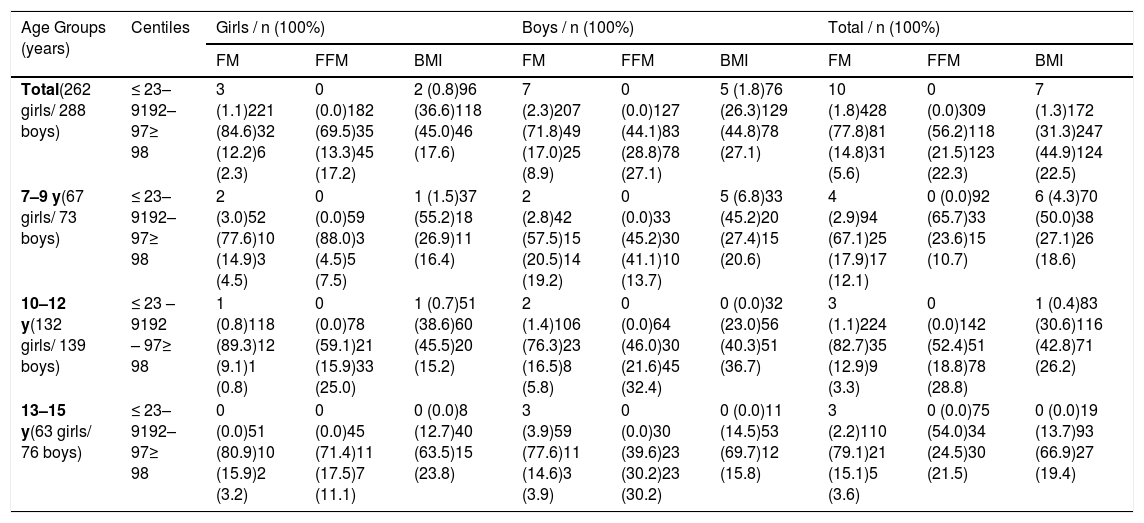
Table 3 evaluates the relationship between BMI values and body composition parameters FM and FFM. Among girls, BMI values above 91 percentiles were most common at the age of 10–12 and 13–15. FM values above normal (above 91 percentile) were evenly distributed across all age groups. Increased FFM values (above 91 centiles) were most pronounced in 10–12-year-olds and 13–15-year-olds. A similar trend was observed in the group of boys studied, both for BMI and FM. Increased FFM values above 91 centiles were evenly distributed in all age groups, slightly dominating in the 10–12 year age range.
Comparative analysis of FM, FFM and BMI in healthy children.
FM, fat mass; FFM, fat-free mass; BMI, body mass index.
The analysis of the characteristics of anthropometric parameters in the group of studied children revealed a physiological increase in body weight, height and BMI, which is consistent with current knowledge in the field of physiology and anatomy. The study by Wang et al.17 conducted in a group of 255 healthy children, showed that the mean BMI, weight and height values were higher in boys than in girls. Numerous researchers point to the general trend of a directly proportional relationship between the age of children and the BMI value, and the incidence of eating disorders in adulthood.4,5 Sandhu et al.18 observed that children with a higher BMI have higher anthropometric measurements in adult life. In addition, high BMI values may result in earlier puberty, growth retardation, and interruption of the process of acquiring a slim figure.
The presented study shows that every second examined child displays energy over-intake in relation to their necessities that cause overweight, while only every fifth child shows excessive fat value. The above difference may indicate the unreliable classification of children using BMI. The index does not capture constant changes in the child's development at the cellular level, muscle development, skeletal resorption, and increase in cell mass due to it relying solely on anthropometric measurements.
The present study showed a cyclical increase in body components with age. Boys demonstrated an increase in all body composition parameters analyzed. In the group of girls, all the components of the body composition also increased, however, the parameters of fat-free mass stabilized with age. The exception to the rule was the percentage of FM, which decreased with age and was higher in girls than in boys. The obtained results prove physiological weight gain with age, including individual components of body composition. An important finding is the percentage differentiation of body mass components depending on the period of growth of the child's body. Despite the proportional increase in FM, the inverse relationship of this parameter is visible in percentages. Despite the relatively low number of study participants, the authors’ findings are in line with the study by Marques-Vidal et al.19 analyzing FM in the group of children and adolescents (aged 10–18 years), which found a decrease in the percentage of this parameter with age for both sexes. In addition, girls in each age group had higher FM values compared to the boys surveyed.
During adolescence, the differences in distribution are related to gender. Girls gain a relatively large amount of FM during puberty, while boys gain relatively large amounts of FFM. Additionally, girls during adolescence generally show excess gynoid fat pattern and fat deposition on the hips and thighs, while boys may display android fat distribution and fat deposition on the abdomen.20 An important factor is a physical activity which influences body composition. Rinaldo et al. found in the group of boys (aged: 12.2 ± 0.4 years) that after 10 weeks of systematic training there was a significant increase in FFM and a significant decrease in FM.21 In the present study, a comparative analysis of nutritional disorders was used, represented by BMI, FM and FFM in selected age groups. Excessive body weight, estimated with BMI, was found in half of the studied children (67.4%), where overweight children (92–97 percentiles) were 45% (girls) and 44.8% (boys), respectively. The studied group of obese children (≥ 98 percentiles) included 17.6% (girls) and 27.1% (boys). These disorders were distributed proportionally in the studied age groups. The above results were higher than in previous observations nutritional status of Polish children and youth.22 Worldwide research indicates malnutrition to be at 8.4% (girls) and 12.4% (boys), with an overweight and obesity rate of 13.7–31.7%.23 As a result of the lack of reports on the direct reference of BMI values to body composition analyses in the Polish children population, the presented analysis directly compared the results of potential overnutrition/ malnutrition (BMI) with the values of the actual body composition (FM, FFM) in the examined children, using available percentile grids.
Despite these arrangements, the present study presents some new data and interesting findings which may indicate the directions of future long-term prospective research. The authors suggest, according to specialist recommendations and the authors’ findings, that body composition analysis should be treated as a complementary screening assessment method, especially as a support for the assessment of nutritional status expressed by BMI.
In the future, the authors are planning to conduct nutritional studies and body composition analysis among newborns, infants and young children. Meanwhile, a thorough assessment of the body composition in these age groups seems to be essential for research into the nutritional or developmental causes of obesity among the smallest pediatric patients.
LimitationsDespite the authors’ best efforts and inclusion in the present study of as many participants as possible, the relatively low number of study participants is the most important limitation. This study has some other limitations, with a slight difference in the cut-off point for the FM and FFM centile charts proposed by Wells16 with reference to the BMI cut-off point of OLAF centile charts.14 In addition, the studied group of children has not analyzed a nutritional status with regards to the pubertal status, stage of the menstrual cycle or physical activity level.
ConclusionsIndividual components of the body composition increase with the age of children. Gender differentiates these values, girls have higher values of fat mass, while boys have higher fat-free mass. As a result of differences in nutritional status assessment with BMI in relation to actual body composition values, screening and in-depth methods should be combined for precise screening of child development.
FundingThe project is supported under the program of the Minister of Science and Higher Education under the name "Regional Initiative of Excellence" in 2019–2022 project number: 024/RID/2018/19, financing amount: 11.999.000,00 PLN
The authors would like to express our sincere appreciation to Anna Nowak for the language assistance and Marzena Domino for the editorial works in this study.


