

To compare the results obtained with the sweat test using the conductivity method and coulometric measurement of sweat chloride in newborns (NBs) with suspected cystic fibrosis (CF) in the neonatal screening program.
MethodsThe sweat test was performed simultaneously by both methods in children with and without CF. The cutoff values to confirm CF were >50mmol/L in the conductivity and >60mmol/L in the coulometric test.
ResultsThere were 444 infants without CF (185 males, 234 females, and 24 unreported) submitted to the sweat test through conductivity and coulometric measurement simultaneously, obtaining median results of 32mmol/L and 12mmol/L, respectively. For 90 infants with CF, the median values of conductivity and coulometric measurement were 108mmol/L and 97mmol/L, respectively. The false positive rate for conductivity was 16.7%, and was higher than 50mmol/L in all patients with CF, which gives this method a sensitivity of 100% (95% CI: 93.8–97.8), specificity of 96.2% (95% CI: 93.8–97.8), positive predictive value of 83.3% (95% CI: 74.4–91.1), negative predictive value of 100% (95% CI: 90.5–109.4), and 9.8% accuracy. The correlation between the methods was r=0.97 (p>0.001). The best suggested cutoff value was 69.0mmol/L, with a kappa coefficient=0.89.
ConclusionThe conductivity test showed excellent correlation with the quantitative coulometric test, high sensitivity and specificity, and can be used in the diagnosis of CF in children detected through newborn screening.
Comparar os resultados obtidos no teste do suor pelo método da condutividade e a dosagem coulométrica de cloreto no suor em recém nascidos (RN) suspeitos da triagem neonatal para fibrose cística (FC).
MétodosO teste do suor foi realizado simultaneamente pelos dois métodos em crianças com e sem FC. Os valores de corte para confirmar FC foram na condutividade >50mmol/L e no teste coulométrico >60mmol/L.
ResultadosQuatrocentos e quarenta e quatro RN sem FC (185 do sexo masculino, 234 femininos e 24 não informado) realizaram o teste do suor por condutividade e dosagem coulométrica simultaneamente e obtiveram resultado mediano de 32mmol/L e 12mmol/L respectivamente. Para os noventa RN com FC os valores medianos de condutividade e dosagem coulométrica foram 108mmol/L e 97mmol/L respectivamente. O índice de falso positivo para condutividade foi de 16,7% e em todos os pacientes FC foi superior a 50mmol/L conferindo ao método 100% de sensibilidade (IC 95%=93,8 a 97,8), especificidade de 96,2% (IC 95%=93,8 a 97,8), valor preditivo positivo 83,3 (IC 95%=74,4 a 91,1), valor preditivo negativo 100% (IC 95%=90,5 a 109,4) e acurácia 9,8%. A correlação entre os métodos foi de r=0,97 (p>0,001).O melhor valor de corte sugerido foi de 69,0mmol/L, coeficiente de kappa=0,89.
ConclusãoO teste da condutividade apresentou excelente correlação com o quantitativo coulométrico, alta sensibilidade e especificidade, podendo ser utilizado no diagnóstico da FC em crianças detectadas pela triagem neonatal.
Cystic fibrosis (CF) is an autosomal recessive disease, resulting from mutations in the gene located in the long arm of chromosome 7, cystic fibrosis transmembrane conductance regulator (CFTR), with an incidence of about 1:10,000 in Brazil.1,2 It is a multisystemic disease and pulmonary involvement accounts for the majority of patient morbimortality. The clinical signs and symptoms include chronic pulmonary disease, pancreatic failure, and abnormalities in the gastrointestinal tract and sweat gland secreting channels, with an increase of chloride concentration in the sweat.3–5 Survival depends on early diagnosis confirmation and treatment initiation at the early stages of the disease. Identification is attained by the presence of signs or symptoms; family history; altered immunoreactive trypsin (IRT) in neonatal screening and confirmed by positive sweat test in two separate measurements, presence of two CF mutations, or altered nasal potential difference test. The latter test requires considerable skill, and is rarely used in Brazil.6,7
In Brazil, CF screening was introduced in the National Neonatal Screening Program (PNTN) in 2001 with the immunoreactive trypsin test (IRT) performed in blood collected from newborns and the sweat test.2
The confirmatory test, the gold standard, is the quantitative analysis of electrolytes in sweat, with an accuracy >90%.8 Sweating is stimulated by pilocarpine, performed by iontophoresis; sweat is obtained using the Gibson and Cooke method. However, skill is necessary to prevent evaporation during collection and the subsequent determination of sweat weight on an analytical scale, followed by the accurate chemical composition of the sample. The sweat collection system with a capillary microtube Macroduct® (Wescor Inc., Logan, UT, USA) has been widely used due to its simplicity and efficiency. The microtube prevents evaporation, and the weighing and dilution steps are eliminated.
Sweat can have its ionic composition analyzed immediately or be submitted to a conductivity analyzer prior to chemical determination.9 The test is positive if the chloride concentration is >60mmol/L in at least two independent measurements.8,10 For infants younger than 6 months, values between 30mmol/L and 50mmol/L are considered suspect.9–11 The conductivity test also constitutes an alternative and valid method for the laboratory diagnosis of CF.7,8,10 The system measures the capacity of the sweat to conduct electrical current in milliamperes (mAs), which depends on the concentration of Na+ and Cl−.12
The Sweat Check 3120® (Wescor Inc., Logan, UT, USA) conductivity analyzer, specifically designed for use with the Macroduct® (Wescor Inc., Logan, UT, USA) sweat collector, measures conductivity in a 6–10μL sample. Values >80mmol/L and a compatible clinical setting justify the start of treatment, whereas values between 50mmol/L and 80mmol/L indicate the need to perform the quantitative test, because conductivity is considered a screening method, as it is not selective to the chloride ion.8–10 The aim of this study was to compare chloride levels in sweat by the quantitative coulometric test with conductivity values in newborns with and without CF, from the neonatal screening program of the state of Paraná.
MethodsThis study was approved by the Ethics Committee of HC-UFPR, registered under No. 271EXT025/2008-06, CAAE 0117.0.208.000-08. This was a prospective, cross-sectional, cohort study that evaluated the neonatal screening program for CF in the state of Paraná. From January 2002 to December 2008, 1,218,642 newborns were evaluated. Initial screening was performed through IRT measurement in blood samples obtained from dermal puncture of the heel, impregnated on filter paper and then analyzed by immunofluorometric assay in a AutoDELFIA system (Perkin Elmer®, MA, USA), conducted in three stages.
Children with altered values ≥70mg/L in two different samples obtained during the first 30 days of life were contacted by a team of social workers through active search to be submitted to a free sweat test (conductivity followed by coulometric quantitative test for chloride measurement) in order to rule out suspicion for CF.
An informative questionnaire on the tests was applied to parents or guardians, who after being recalled, volunteered and consented to its performance. A total of 2309 infants were submitted to the test using both methods; a repeated test was required in 99 infants (4.3%) due to insufficient quantity of sweat. Of the 2309 children, 90 cases of CF were confirmed. For the study, a group consisting of 444 infants was selected by convenience from the 2219 children with normal sweat test, as well as the 90 cases with positive sweat test and confirmed CF.
Sweat collectionSweating was induced by the iontophoresis technique with pilocarpine. Gelatinous discs impregnated with 0.5% PILOGEL® (Pilocarpine hydrochloride, Alcon Laboratories, UK) were affixed using standard WESCOR® electrodes (Wescor Inc., Logan, UT, USA), positive and negative fitting the child's arm perfectly after rigorous asepsis and cleaning with deionized water. The device promotes the stimulation through an iontophoretic current of 1.5mA for 5min. Pilocarpine is ionized and guided to an area of skin that has sweat glands, preferably in the anterior forearm.8,9 If this site was not adequate for the collection, then the anterior thigh area was used.
After stimulation, the area was cleaned with deionized water and the sweat collected directly in a disposable Macroduct® (Wescor Inc., Logan, UT, USA) firmly affixed to the site, according to the manufacturer's recommendation. Collection time did not exceed 30min, nor was it inferior to 20min.9 The mean rate during the collection was not less than 1g/m2/min or 10μL of sweat using the Macroduct® (Wescor Inc., Logan, UT, USA) collection system, the minimum volume of sweat required for this device.9,13
Conductivity methodImmediately after collection, the sweat sample was submitted to the conductivity test by the Sweat Check 3120® device. The normal, borderline, and abnormal values were established according to the equation associating conductivity with chloride.11,13 After the conductivity was measured, the same sweat sample, placed in an Eppendorf tube, was immediately sent for the quantitative measurement of chloride.
To prevent the conductivity result from influencing the quantitative measurement of chloride, the two techniques were performed by different teams that were unaware of each other's results.
Quantitative measurement of chloride by coulometryFor this measurement, a digital Labconco® chloridometer (Labconco®, KS, USA) was utilized, which is a device that performs colorimetric titration of chloride ions. A quantity of 10μL of sweat is necessary for the reaction to occur within seconds of contact with the reagent solution and the pair of electrodes, providing a digital readout in mmol/L.14–16
The method monitoring for the initial screening was carried out according to the internal kit controls, TIRIQAS (France) and CDC (Centers for Disease Control and Prevention, GA, USA). For the quality control of sweat tests, NaCl commercial standard solutions at concentrations of 40mmol/L, 70mmol/L, and 130mmol/L were used in all experiments, in addition to previously prepared internal NaCl standards of 10mmol/L, 50mmol/L, and 100mmol/L. This study was conducted in an institution accredited by the Ministry of Health for neonatal screening for CF.
At hospital discharge, the service usually distributes the “information for parents” leaflet, which contains explanations on neonatal screening. When necessary, the sweat test was performed with prior notice and after active search by a specialized team, and the parents were informed by means of a questionnaire applied at the test site. As this is a routine test at the accredited service, an informed consent was not required.
Statistical analysisThe estimate of the difference between means was performed by Student's t-test and analysis of variance (ANOVA), whereas Pearson's chi-squared test was used for the difference between frequencies. Pearson's correlation coefficient was calculated between the quantitative coulometric method (gold standard) and the conductivity test, with the kappa coefficient used to estimate the correlation between the methods. A receiver operating characteristic (ROC) curve was constructed to estimate the cutoff point and sensitivity and specificity rates of the conductivity test, with the coulometric method employed as the gold standard. A minimum significance level of 5% was considered for all tests using the Statistica program – Statsoft® (StatSoft, Inc., DELL®, OK, USA).
ResultsThe study included 1,218,642 newborns from the neonatal screening program of the state of Paraná, of whom 13,235 (1.08%) had a first test result (IRT-1) >70g/L and were recalled for further testing (IRT-2). Of these, 10,926 (82.5%) normalized and 2309 (17.4%) persisted with altered values and, thus, were submitted to the sweat test, through both methods, which resulted in 2219 (96.1%) normal results and 90 (3.9%) CF cases. Of the 2309 infants submitted to the sweat test, two groups were separated for convenience, one with 444 individuals without CF and another with 90 individuals with CF.
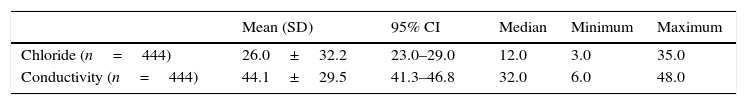
In the group without CF, 185 (41.6%) were males, 234 (52.7%) females, and for 25 cases (5.6%) this information was not available. As for ethnicity, 420 (94.6%) were white and in 24 cases (5.4%) ethnicity was unknown. The mean birth weight was 3228.8±2352.8g (95% CI: 3002.4–3455.4g). In the group with CF, the distribution between the genders and ethnicity was 46 (51.1%) males, 44 (48.8%) females, 85 (94.5%) whites and 5 (5.5%) non-whites. The mean birth weight was 3091.2±477.9g (95% CI: 2000.0–3997.0g). The sweat volume collected from all children was greater than 15μL, allowing both methods to be used. In the non-CF group, median sweat test results by coulometry and conductivity were 12mmol/L and 32mmol/L, respectively (Table 1). In the group with CF, median values were 97.0mmol/L and 108mmol/L, respectively, showing good correlation between the tests, considering that conductivity measures all ions present in sweat (Table 2).
Quantitative measurement of chloride and conductivity in patients without CF.
| Mean (SD) | 95% CI | Median | Minimum | Maximum | |
|---|---|---|---|---|---|
| Chloride (n=444) | 26.0±32.2 | 23.0–29.0 | 12.0 | 3.0 | 35.0 |
| Conductivity (n=444) | 44.1±29.5 | 41.3–46.8 | 32.0 | 6.0 | 48.0 |
CF, cystic fibrosis; SD, standard deviation; 95% CI, 95% confidence interval.
Chloride and conductivity values are expressed in mmol/L.
Quantitative measurement of chloride and of conductivity in CF patients.
| Mean (SD) | 95% CI | Median | Minimum | Maximum | |
|---|---|---|---|---|---|
| Chloride 1 (n=90) | 91.9±19.0 | 87.5–96.3 | 97.0 | 60.0 | 110.0 |
| Conductivity 1 (n=90) | 102.4±18.8 | 98.5–106.3 | 108.0 | 53.0 | 133.0 |
| Chloride 2 (n=90) | 91.7±19.0 | 86.4–96.9 | 97.5 | 60.0 | 115.0 |
| Conductivity 2 (n=90) | 106.4±18.9 | 102.6–110.2 | 110.0 | 57.0 | 129.0 |
SD, standard deviation; 95% CI, 95% confidence interval; CF, cystic fibrosis.
Chloride and conductivity 1 and 2 correspond to the first and second examinations, respectively.
Chloride and conductivity values are expressed in mmol/L.
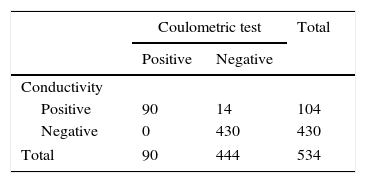
In the group with CF, 14 (3.15%) showed high conductivity (>50.0mmol/L), but normal chloride measurements (<60.0mmolCl−/L), which were considered false positive results. The results showed excellent correlation between the methods and properties obtained when comparing them, considering the quantitative measurement of chloride as the gold standard (Table 3).
Concordance between the conductivity and the coulometric quantitative test for chloride measurement.
| Coulometric test | Total | ||
|---|---|---|---|
| Positive | Negative | ||
| Conductivity | |||
| Positive | 90 | 14 | 104 |
| Negative | 0 | 430 | 430 |
| Total | 90 | 444 | 534 |
Kappa coefficient=0.89; (Fisher's exact test) p<0.001; sensitivity=100% (95.9–100); specificity=96.8% (94.8–98.1); PPV (positive predictive value)=86.5%; NPV (negative predictive value)=100%; accuracy=97.4%; false positive=13.5%; false negative=0; positive likelihood ratio=31.7 (18.9–53.1); negative likelihood ratio=0.
All CF patients showed conductivity values >80mmol/L, which gives the test a sensitivity of 100% (95% CI: 94.8–100), specificity of 96.2% (95% CI: 93.8–97.8), positive predictive value of 83.3% (95% CI: 74.4–91.1), negative predictive value of 100% (95% CI: 90.5–109.4), accuracy of 96.8%, false positive rate of 16.7%, zero false negative rate, positive likelihood ratio of 31.7 (18.9–53.1), and zero negative likelihood ratio. The correlation coefficient between the two methods was 0.97, with kappa factor of 0.89 (p<0.001). The ROC curve (Fig. 1) showed 100% overlap under the curve with the conductivity method and the suggested cutoff value was 69.0mmol/L.
Discussion and the conductivity method.")
The assessment carried out in this study shows the conductivity method can be used as a diagnostic tool, considering that all statistical tests used to compare it with the coulometric quantitative chloride measurement, which is the gold standard, indicated strong accuracy. The cutoff value suggested by the ROC curve analysis was 69mmol/L, with the conductivity values of 60–69mmol/L considered as equivocal range values (p=0.001). The results of this study suggest that the analytical method of conductivity can be a definitive and reliable diagnostic procedure for CF. The correlation coefficient (r=0.97) found in this study shows good convergence between these methods.
Although some studies have shown that the conductivity correlates well with the chloride concentrations,7,13,14,17–19 this fact is not accepted by the North American National Clinical and Laboratory Standards Institute (CLSI) as a method used for definitive diagnosis, relegating it to the status of “screening method”,13,14 and it recommends that individuals with sweat conductivity of 50mmol/L be submitted to quantitative chloride assessment.
Currently, the quantitative analysis of chloride or sodium is the most widely used and conclusive method for the diagnosis of CF, as more than 99% of individuals homozygous for the CF gene have chloride and sodium in sweat >60 and 70mmol/L, respectively.15,20 Some studies have suggested that the cutoff for neonates should be 30mmol/L, to prevent the possibility of false negative results.10,15 The electrolytes in sweat may be transiently elevated during the first 24h of life. For this reason it is suggested that the test be performed 48h after birth.15
The present study has shown that conductivity is capable of discriminating CF patients from normal subjects, with 16.7% false positive results (Table 3). As the conductivity results from the sum of electrolytes in sweat, the results are expected to be higher. The median conductivity in cases without CF were, respectively, 32mmol/L and 12mmol/L and, in cases with CF, 108mmol/L and 97mmol/L in the first test, and 110mmol/L and 97.5mmol/L in the second test, performed on different days (Tables 1 and 2). The conductivity results were always higher and there were no false negative cases.
The results suggest that this analytical method, according to the criteria of 100% sensitivity (95% CI: 94.8–100), 99.5% specificity (95% CI: 93.8–97.8), and conductivity value of 69.0mmol/L, should be considered confirmatory for the disease. No false-negative CF cases were reported in the screened population, which can occur, as there are some mutations in the CFTR gene that cause sweat electrolytes to remain within the normal range.7
Studies have shown an excellent correlation between the conductivity and the coulometric titration of chloride. Hammond et al. evaluated conductivity and the chloride concentration in sweat in 471 individuals without CF and found mean values of 33.4mmol/L (13–87mmol/L) and 16.4mmol/L (5–60mmol/L) for the two methods, respectively. In the 43 patients with CF, the mean conductivity value was 113.1mmol/L (90–136mmol/L), and for chloride, 98.8mmol/L (77–117mmol/L). There was a good correlation between the methods (r=0.97).13
Lezana et al. compared the two methods in 3834 patients with clinical suspicion, whose age ranged from 1.8 to 54 years; the median conductivity found in patients without and with CF was 36mmol/L and 111mmol/L, respectively. The correlation coefficient between the two methods was 0.60 (p<0.001). The ROC curve showed high concordance between them, ruling out CF for conductivity <75mmol/L and confirming CF for values ≥90mmol/L, with 99.7% sensitivity, 100% specificity, and PPV and NPV of 100% and 99.97%, respectively. The kappa coefficient was 0.99.14 The results obtained in this study, in a population consisting essentially of newborns, corroborate the results of these authors.
Mastella et al., evaluating 287 individuals, found mean values of chloride and conductivity of 16.3mmol/L (4–60mmol/L) and 39.8mmol/L (19–87mmol/L) in patients without CF, respectively; in CF patients, values were 95.7mmol/L (32–121mmol/L) and 112mmol/L (45–173mmol/L), respectively.21
Mattar et al., comparing the classical method of Gibson and Cooke and conductivity in 738 children, found median chlorine values and sweat conductivity of 11mmol/L and 25mmol/L, respectively, in 714 children. In the 24 patients with CF, the mean values found were 87mmol/L and 103mmol/L, respectively. These authors found a sensitivity of 83.3%, specificity of 99.7%, PPV of 90.9%, and NPV of 99.4%, respectively, for conductivity values >90mmol/L. The conductivity value used to rule out CF was <75mmol/L. Good agreement was observed between the methods (kappa coefficient=0.93).18
Riedi et al. found a strong correlation between sodium measurement and conductivity in sweat. Of the 175 patients without CF, the mean values of sodium and conductivity were 36.3mmol/L (12–75mmol/L) and 40.9mmol/L (16–75mmol/L); in the 31 patients with CF, they were 113.2mmol/L (80–146mmol/L) and 118.5mmol/L (84–155mmol/L). Although sodium measurement is not recommended in the diagnosis of CF, these authors found a good correlation between the methods (r=0.99) (p<0.0001).19
Khoa-Nguyen et al. demonstrated the linearity between the colorimetric titration and the coulometric and conductivity methods in the range of 10–120mmol/L. They established a correspondence rate of the coulometric measurement and the conductivity ratio of 30, 40, and 60mmolL to 57, 66, and 84mmol/L, respectively. These authors support that a sweat test for conductivity <50mmol/L rules out the CF diagnosis in the absence of clinical signs.17 In the present study, all 90 CF cases showed a conductivity result >50mmol/L, confirming these authors’ findings.
The apparent advantage of the Macroduct® system is the capacity to obtain direct readings of the results with small amounts of sweat.11 Two positive tests carried out on different dates are required to confirm the diagnosis.15 Inadequate sweating can distort the results and thus, a minimum acceptable sweat volume of 15μL collected in 30min is recommended.11,13,15 LeGrys et al. defined the following as sufficient and optimal sweat volume: at least 75mg using the Gibson–Cooke method22 or at least 10–15μL by the Macroduct®,23 recommendations that were followed in this study.
Some authors evaluated the repetition rate of the sweat test for inappropriate volume, and recommended a percentage limit of 5% of retest in patients aged >3 months.23,24 In this study, it was necessary to repeat the test in 99 children (4.3%) due to insufficient volume, thus within the recommended rate.
The preference for the conductivity method is justified, as it is easy to perform when compared to traditional quantitative measurements of chloride, especially those using filter paper or gauze to collect sweat, in which the sample quantity can be a limiting factor. The results of this study corroborate those previously published by other authors and reinforce the use of this test as a diagnostic method, as the operator has less influence on the quality of results.
This study suggests that the conductivity test is valid for the quantitative analysis of chloride in sweat to diagnose or exclude CF and can be considered as a diagnostic method.
Conflicts of interestThe authors declare no conflicts of interest.
Please cite this article as: Domingos MT, Magdalena NI, Cat MN, Watanabe AM, Rosário Filho NA. Sweat conductivity and coulometric quantitative test in neonatal cystic fibrosis screening. J Pediatr (Rio J). 2015;91:590–5.


