


Validate the accuracy of the Screening Tool for Risk on Nutritional status and Growth (STRONGkids) and estimate the prevalence of malnutrition and nutritional risk in hospitalized children.
MethodsCross-sectional study of a representative sample of children admitted to ten public pediatric emergency rooms. The sample was randomly estimated in stages, including children older than 30 days and younger than 10 years of age, of both sexes, excluding syndromic children and those in whom it was impossible to directly measure anthropometry. Weight, height, and arm circumference were measured, as well as the Z-scores of the anthropometric indices weight-for-age, height-for-age, weight-for-height, body mass index for age, and arm circumference for age, classified according to the reference curves of the World Health Organization. After the tool was applied, its accuracy tests were performed in comparison with the anthropometric data, with the evaluation of sensitivity, specificity, and positive and negative predictive values.
ResultsA total of 271 children were evaluated, 56.46% males and 41.70% younger than 2 years of age. The prevalence rates of malnutrition, nutritional risk assessed by anthropometric measurements, and nutritional risk assessed by the tool were 12.18%, 33.95%, and 78.60%, respectively. Accuracy showed sensitivity of 84.8%, specificity of 26.7%, positive predictive value of 49.8%, and negative predictive value of 67.2%, when the patients at nutritional risk were identified by anthropometry.
ConclusionValidation of the accuracy of STRONGkids was performed, showing high sensitivity, allowing the early identification of nutritional risk in similar populations.
Validar a acurácia do instrumento de triagem nutricional Screening Tool for Risk on Nutritional status and Growth (STRONGkids) e estimar as prevalências de desnutrição e risco nutricional em crianças hospitalizadas.
MétodosEstudo transversal, em amostra representativa de crianças admitidas em 10 prontos-socorros infantis públicos. A amostra foi estimada aleatoriamente, por etapas, foram incluídas crianças com idade superior a 30 dias e inferior a 10 anos, de ambos os sexos, e excluídas as sindrômicas e impossibilitadas de aferição direta da antropometria. Foram aferidos peso, estatura e circunferência do braço, calculados os Z-scores dos índices antropométricos peso para idade, estatura para idade, peso para estatura, índice de massa corporal para idade e circunferência do braço para idade, classificados de acordo com as curvas de referência da Organização Mundial da Saúde. Após a aplicação do instrumento foram realizados os testes de acurácia do instrumento em comparação a antropometria, foram avaliados sensibilidade, especificidade e valores preditivos positivo e negativo.
ResultadosForam avaliadas 271 crianças, 56,46% meninos e 41,70% menores de dois anos. As prevalências de desnutrição, risco nutricional pela antropometria e pelo instrumento foram de 12,18%, 33,95% e 78,60%, respectivamente. A acurácia mostrou 84,8% de sensibilidade, 26,7% de especificidade, 49,8% de valor preditivo positivo e 67,2%, negativo, quando identificados os pacientes em risco nutricional pela antropometria.
ConclusãoA validação da acurácia do STRONGkids foi feita com verificação de alta sensibilidade, permitiu a identificação precoce de risco nutricional em populações semelhantes.
Malnutrition in hospitalized pediatric patients, despite large variations in its prevalence, stands out for its clinical importance and needs to be identified as early as possible.1 Although anthropometry detects malnutrition, it does not diagnose nutritional risk, for which screening is recommended within the first 48h after hospital admission.2 When nutritional risk is assessed, it is possible to predict the probability of a better or worse clinical outcome due to nutritional factors, as well as to evaluate the influence of nutritional intervention on this outcome.3
The main protocols for nutritional screening in the pediatric age range include the following: the Simple Pediatric Nutritional Risk Score (SPNRS),4 the Subjective Global Nutrition Assessment (SGAN),5 the Screening Tool for Risk on Nutritional status and Growth (STRONGkids),6 the Pediatric Yorkhill Malnutrition Score (PYMS),7 the Screening Tool for the Assessment of Malnutrition in Pediatrics (STAMP),8 and the Pediatric Nutrition Screening Tool (PNST).9 Both STRONGkids6 and SGAN5 have been translated into Portuguese. In the Brazilian validation of the SGAN,10 the tool was characterized more as a structured nutritional evaluation process than as a screening tool.11,12
The STRONGkids6 tool is characterized, when compared to the others, as a practical, easy, and reproducible tool,13 having been validated in other countries.14–16 In Brazil, during 2013 Carvalho et al.17 submitted the tool to the translation steps of synthesis and back-translation, and in 2018 Gouveia et al.18 performed its predictive validation in a prospective study.
In this context, the aims of this study were to validate, in a representative sample of hospitalized children, the accuracy of the STRONGkids tool, and to estimate the prevalence of malnutrition and nutritional risk in this population.
MethodsThis was an observational, cross-sectional, and analytical study of a representative sample of hospitalized children in the emergency rooms of public hospital units of the Federal District (FD) of Brazil. Data were collected from children of both genders, aged >30 days and <10 years. Syndromic patients or those who needed specific curves for anthropometric classification different from those of the World Health Organization (WHO) of 200619 and 200720 were excluded, as well as patients in whom it was impossible to directly measure anthropometry.
To guarantee representativeness, the sampling plan was random and performed in stages, with the number of beds of the pediatric emergency room in the FD being the weighting measure. Sample calculation was based on the estimation of the proportion of treated children at high nutritional risk (0.1621), setting the confidence level of the estimate at 95%, with a margin of error of 5%. The minimum sample size corresponded to 207 patients, distributed among the hospitals according to the total number of beds. Data collection took place during three consecutive months, in blocks, by drawing lots for both the sequence of the hospitals and the days of collection.
Data were collected on the children's sex, age, cause of hospitalization, and associated diseases. Regarding the parent/guardian data, the degree of kinship with the child, age, and level of schooling were collected.
The children's weight, height, and arm circumference were measured, always by the same researcher. In children under 2 years of age, the weight was measured with the child lying in the supine position, without clothes, on a Multilaser® digital scale (Multilaser®, SP, Brazil) while the length was measured using an anthropometric Cardiomed® ruler (Cardiomed®, PR, Brazil). In those older than 2 years, a Techline® digital scale (Techline®, SP, Brazil) was used, with the child standing in the center of the scale with minimal clothing and barefoot; height was measured using a Cardiomed® (Cardiomed®, PR, Brazil) portable vertical pediatric anthropometer. The arm circumference was measured in all children, using an inextensible measuring tape, being classified only in those aged between 3 months and 5 years.20
The following anthropometric indexes were established: weight-for-age (W/A), height-for-age (H/A), weight-for-height (W/H), body mass index for age (BMI/A), and arm circumference for age (AC/A). According to guidelines for use of the WHO reference curves,19,20 all indexes were calculated for all children under 5 years, and for those aged 5–10 years, W/H and AC/A were not calculated. The cutoff point for malnutrition, considered according to the WHO19,20 was Z-score <−2. It is classified as acute for W/A, W/H, and/or BMI/A; chronic for H/A and malnutrition for AC/A. Anthropometric data were entered into the software WHO Anthro (WHO Anthro, World Health Organization, Switzerland) and WHO Anthro Plus (WHO Anthro Plus, World Health Organization, version 1.0.3, Switzerland), produced by the WHO22 to calculate body mass index (BMI) and perform classification of anthropometric indexes.
According to the Food and Nutrition Surveillance System (SISVAN),23 the interval between Z-scores of −1 and −2 for the W/A index is considered an important surveillance range for low weight and is no longer a nutritional risk classification. However, in this study, it was considered as such. The nutritional surveillance range for low weight (related to the W/A index of −2 ≤Z-score <−1, which characterizes the nutritional risk) was extended to all the anthropometric indexes considered.
The STRONGkids tool6,17 consists of four scored questions addressing underlying disease, subjective clinical assessment, weight alterations, food intake, and losses. At the end, the total sum of the points is calculated, with a minimum of 0 and a maximum of 5 points, and the nutritional risk is classified as “low” (0 points), “medium” (1–3 points), or “high” (4 or 5 points).
The study was approved by the Ethics and Research Committees of the Faculty of the Health Sciences of the University of Brasilia and the Foundation for Teaching and Research in Health Sciences of the Department of Health of the Federal District.
Statistical analysisThe quantitative variables considered were the child's age, weight, height, BMI, and AC, in addition to the Z-scores of the W/A, W/H, H/A, BMI/A, and AC/A indexes, the STRONGkids tool score,6,17 parent/guardian age, and gestational age. They were analyzed through measures of dispersion with analysis of their asymmetry and represented by mean with standard deviation and 95% confidence interval. They were also categorized into age groups, nutritional risk categories, schooling categories, and malnutrition classification according to each anthropometric index considered.
The qualitative variables of the child's parent/guardian included the degree of kinship and level of schooling. For each child, gender, clinical diagnosis, age, type of delivery, prematurity, nutritional status according to each anthropometric index, and nutritional risk categories of the STRONGkids tool were considered.6,17
The anthropometric indexes were categorized as “malnourished” or “adequate,” with Z-score cut-off points of <−2 and Z-score ≥−2, respectively. Subsequently, there was a second categorization with the inclusion of the variable “nutritional risk,” with an interval between −2 ≤Z-score <−1 and, consequently, adequate with Z-score ≥−1.
According to each categorization, the frequencies of the quantitative and qualitative variables were verified and the specific tests, chi-squared or ANOVA, were applied with a significance level of 5%. “Malnourished” were those subjects identified as such in any of the anthropometric indexes considered. The categories of the STRONGkids6,17 tool were dichotomized as “at risk,” those at high and medium nutritional risk, and “no risk,” those at low risk.
The associations between the tool and the anthropometric indexes were performed, using McNemar test, with a significance level of 5%. Subsequently, the correlations were verified through Pearson's correlation and kappa tests.
To validate the accuracy of the STRONGkids tool, it was compared with the anthropometry. Statistical procedures to evaluate their performance comprised estimates of sensitivity, specificity, positive predictive value (PPV), and negative predictive value (NPV). The evaluation was performed in two steps, i.e., with and without the nutritional risk category identified in the anthropometry. To compare the performance of the tool in relation to the previous categorization, the identified nutritional risk groups were recategorized as “at risk” (those with high risk) and “no risk” (those of medium and low risk), with subsequent evaluation of performance at each cut-off point of the tool. The analyses were performed using SPSS software for Windows (IBM SPSS Statistics for Windows, Version 22.0, NY, USA).
ResultsThe data collection took place in the ten public hospitals of the Federal District that have a pediatric emergency department, totaling 48 days of collection (Fig. 1).

The sociodemographic, clinical, parental, and anthropometric characteristics of the sample according to the categories of the STRONGkids tool are described in Table 1.
Sociodemographic, clinical, parental, and anthropometric profile of children admitted to emergency services according to the nutritional risk categories of the STRONGkids tool. Federal District – DF, 2017.
| Variable | Low (n=58) | Medium (n=204) | High (n=9) |
|---|---|---|---|
| Gender (%) | |||
| Male | 67.24 | 53.92 | 44.44 |
| Age range (%) | |||
| 0–24 months | 32.76 | 45.10 | 22.22 |
| 25–60 months | 39.66 | 34.80 | 33.33 |
| 60–120 months | 27.59 | 20.10 | 44.45 |
| Clinical diagnosis (%) | |||
| Respiratory diseases | 56.90 | 51.47 | 33.33 |
| Gastroenteropathies | 5.17 | 16.18 | 11.11 |
| Others | 37.93 | 32.35 | 55.56 |
| Parents/guardians’ level of schooling (%) | |||
| Illiterate | 1.72 | 0 | 0 |
| Elementary school | 31.03 | 28.92 | 33.33 |
| High school | 53.45 | 61.76 | 55.56 |
| Technical college/college/university | 13.79 | 9.31 | 11.11 |
| Anthropometric data (%) | |||
| Malnutritiona | 12.07 | 10.78 | 44.44 |
| Nutritional riskb | 20.69 | 37.25 | 44.44 |
| Adequate | 67.24 | 51.96 | 11.12 |
The Supplementary Material shows the prevalence of malnutrition according to anthropometry and the prevalence of nutritional risk, which corresponded to 12.18% and 33.95% of the total, respectively.
All children were evaluated by STRONGkids (n=271), reaching a mean score of 1.51±1.18 points (95% CI: 1.37–1.65). The tool identified 78.60% of the children as having some degree of nutritional risk: 75.28% at “medium” and 3.32% at “high” risk.
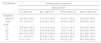
Each anthropometric index was compared separately between each STRONGkids classification category and the Z-scores means were significantly different for the W/H (p=0.028) and BMI/A (p=0.001) indexes. The first analysis considered the categorization of the anthropometric indexes as “malnourished” or “adequate” and, subsequently, as “at” or “no” nutritional risk. Comparing to the STRONGkids categories, at risk (medium and high risk) and no risk (low risk), there was a significant difference between all the anthropometric indexes and the considered categories (Table 2).
Association between the presence or absence of nutritional risk obtained with the STRONGkids tool and the nutritional status and risk assessed by anthropometric indexes in children admitted to the emergency services of the Federal District, 2017.
| Categories by STRONGkids | Categories by anthropometric indexes | |||
|---|---|---|---|---|
| Malnutrition, n (%) | Adequate, n (%) | At risk, n (%) | No risk, n (%) | |
| W/H | ||||
| At risk | 14 (8.33) | 154 (91.67)b | 44 (26.19) | 124 (73.81)b |
| No risk | 2 (4.76) | 40 (95.24) | 6 (14.29) | 36 (85.71) |
| H/A | ||||
| At risk | 6 (2.82) | 207 (97.18)b | 38 (17.84) | 175 (82.16)b |
| No risk | 5 (8.62) | 53 (91.38) | 13 (22.41) | 45 (77.59) |
| W/A | ||||
| At risk | 2 (0.94) | 211 (99.06)b | 49 (23.00) | 164 (77.00)b |
| No risk | 4 (6.90) | 54 (93.10) | 11 (18.97) | 47 (81.03) |
| BMI/A | ||||
| At risk | 19 (8.92) | 194 (91.08)b | 64 (30.05) | 149 (69.95)b |
| No risk | 3 (5.17) | 55 (94.83) | 8 (13.79) | 50 (86.21) |
| AC/A | ||||
| At risk | 2 (1.29) | 153 (98.71)b | 19 (12.42) | 134 (87.58)b |
| No risk | 1 (2.94) | 33 (97.06) | 2 (6.06) | 31 (93.94) |
| Totala | ||||
| At risk | 26 (12.21) | 187 (87.79)b | 106 (49.77) | 107 (50.23)b |
| No risk | 7 (12.07) | 51 (87.93) | 19 (32.76) | 39 (67.24) |
W/H, weight for height; H/A, height for age; W/A, weight for age; BMI/A, BMI for age; AC/A, arm circumference for age.
The correlations between the score obtained in the STRONGkids, categorized as “at risk” and “no risk,” and the anthropometric indexes (−0.19 for W/H; 0.03, for H/A; −0.16 for W/A; −0.27 for BMI/A; −0.20 for AC/A; and total of 1.00) were low, as well as when compared with the “malnourished” (0.00) and “with nutritional risk” (0.11) categories. This result reinforces the fact that the tool and indexes are different.
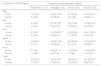
The performance of the test for the accuracy evaluation is shown in Table 3. It can be observed that it was sensitive but not very specific, albeit with a high NPV.
Performance of the STRONGkids tool accuracy tests in relation to the anthropometric indexes of malnourished children and those at nutritional risk admitted to the emergency room in the Federal District, 2017.
| STRONGkids | Anthropometric assessment | |||
|---|---|---|---|---|
| Malnourishedh | ||||
| S % (95% CI)j | Sp % (95% CI)k | PPV % (95% CI)l | NPV % (95% CI)m | |
| Categories | ||||
| Mediuma | 78.8 (64.3–93.3) | 21.4 (16.2–26.6) | 12.2 (7.8–16.6) | 87.9 (79.3–96.5) |
| Highb | 12.1 (0.5–23.7) | 97.9 (96.1–99.7) | 44.4 (6.2–82.6) | 88.9 (85.1–92.7) |
| Cutoff | ||||
| ≥1c | 78.8 (64.3–93.3) | 21.4 (16.2–26.6) | 12.2 (7.8–16.6) | 87.9 (79.3–96.5) |
| ≥2d | 51.5 (33.8–69.2) | 55.9 (49.6–62.2) | 13.9 (7.7–20.1) | 89.3 (84.3–94.3) |
| ≥3e | 36.4 (19.3–53.5) | 80.3 (75.2–85.4) | 20.3 (9.8–30.8) | 90.1 (86.1–94.1) |
| ≥4f | 12.1 (0.5–23.7) | 97.9 (96.1-99.7) | 44.4 (6.2–82.6) | 88.9 (85.1–92.7) |
| =5g | 9.1 (0–19.3) | 98.7 (97.3–100) | 50.0 (0–100) | 88.7 (84.9–92.5) |
| STRONGkids | Nutritional riski | |||
|---|---|---|---|---|
| S % (95% CI)j | Sp % (95% CI)k | VPP % (95% CI)l | VPN % (95% CI)m | |
| Categories | ||||
| Medium | 84.8 (78.4–91.2) | 26.7 (19.5–33.9) | 49.8 (43.0–56.6) | 67.2 (54.9–79.5) |
| Highb | 6.4 (2.1–10.7) | 99.3 (97.9–100) | 88.9 (64.8–100) | 55.3 (49.3–61.3) |
| Cutoff | ||||
| ≥1c | 84.8 (78.4–91.2) | 26.7 (19.5–33.9) | 49.8 (43.0–56.6) | 67.2 (54.9–79.5) |
| ≥2d | 50.4 (41.5–59.3) | 59.6 (51.6–67.9) | 51.6 (42.6–60.6) | 58.4 (50.4–66.4) |
| ≥3e | 29.6 (21.5–37.7) | 84.9 (79.0–90.8) | 62.7 (50.1–75.3) | 58.5 (51.8–65.2) |
| ≥4f | 6.4 (2.1–10.7) | 99.3 (97.9–100) | 88.9 (64.8–100) | 55.3 (49.3–61.3) |
| =5g | 4.0 (0.5–7.5) | 99.3 (97.9–100) | 83.3 (44.2–100) | 54.7 (48.7–60.7) |
Medium, when STRONGkids categories were grouped into at risk (medium and high risk) and no risk (low risk).
High, when STRONGkids categories were grouped as at risk (high risk) and no risk (low and medium risk).
Sensitivity, probability of identifying those at risk using the tool among the malnourished ones or at risk through anthropometry.
Among the malnourished children, the tool was able to identify 78.8% (95% CI: 64.3–93.3%) at nutritional risk and, among the adequate children, the tool detected 87.9% (95% CI: 79.3–96.5%) as no nutritional risk. Even though it did not detect all malnourished children at risk, those detected no risk are highly likely not to be malnourished. Although low, the PPV showed that the number of false positives was high, i.e., children identified as adequate by anthropometry could have nutritional risk according to the tool.
By including the nutritional risk category of the anthropometry, there was a gain in sensitivity and PPV, but a loss in NPV, increasing the probability of identifying patients at risk among those who were actually malnourished. However, there was a reduction in the ascertainment of identifying those no risk as being truly without it.
Considering the classification “at risk” according to the tool only in those classified as “high risk” (3.32%), i.e., with a score of 4 or 5 points, resulted in loss of sensitivity (12.1%, 95% CI: 0.5–23.7%) and increased specificity (97.9%, 95% CI: 96.1–99.7%). The high NPV was maintained, being higher than 85%, which leads to a higher probability of ruling out the uncertainty of the adequate patient being no risk. The same was not observed with the inclusion of the nutritional risk category according to the anthropometric index, in which sensitivity was reduced but high specificity was maintained, with loss in the NPV, and reduction of the probability of adequate patients being classified as no risk by the tool.
When analyzing the performance point-by-point (1–5 points), it was verified that, with each increase in the cutoff point, the tool became less sensitive and more specific, with cutoff point “1” showing greater sensitivity for both analyzed categories of anthropometry. Thus, if the child was not malnourished, he/she would have a high probability of the evaluation by the tool identifying him/her as no nutritional risk. The inclusion of the nutritional risk range according to anthropometry identified an even greater reduction in sensitivity, but the probability of ruling out nutritional risk among the adequate patients remained, due to its continued high specificity.
DiscussionThis study was the first in Brazil to validate the accuracy of the STRONGkids tool in a representative sample of children in a hospital environment. The first predictive validation study of the STRONGkids in Latin America, carried out in Brazil,18 verified the tool's ability to predict weight loss and length of hospital stay. It was a prospective study with a convenience sample and, despite showing low sensitivity and high NPV, it was able to predict long-term hospitalizations, suggesting its use as a preliminary assessment at admission.
The weak correlation found between the results obtained by the nutritional screening tool and anthropometry in the present study was also seen in other studies.14,24,25 In 2013, Spagnuolo et al.14 identified 70% of the children evaluated with nutritional risk by the tool and 20% by anthropometry. The presence of a significant correlation only at high risk generated discussion about a nutritional screening tool being compared to a procedure to diagnose nutritional status, i.e., anthropometry. In 2013 multicenter study, Huysentrut et al.24 found a good correlation with W/H and a weak one with H/A. They emphasized the greater importance given to nutritional diagnosis than to the screening identification, which should prevail, since specificity is less important in malnutrition screening, and false-negative results allow for cases of unidentified malnutrition. In 2013, Moenni et al.25 found an inverse association between the tool and the anthropometric indexes W/H and BMI/A Z-score and, when comparing STRONGkids with other nutritional screening tools, they concluded it was the most reliable.
There was no significant association in two cross-sectional studies, one Brazilian26 and another in Turkey.15 Both found data that seem to be consistent with the fact that the tool provides more data on future risk than on current nutritional status, as expected from a tool for nutritional risk screening.
In a 2014 validation study of STRONGkids, Mărginean et al.16 found a good correlation with anthropometry and suggested the inclusion of biochemical data to optimize nutritional risk identification.
The test's sensitivity performance (78.8%) was similar to that found in other validation studies. When comparing with malnourished patients, chronic or acute, in 2013 Spagnuolo et al.14 verified 71% sensitivity, 53% specificity, 21% PPV, and 85% NPV. According to this result, they suggested that STRONGkids should be considered together with anthropometry as an easy preliminary assessment, with a focus on the risk factors. In 2013, Huysentrut et al.24 evaluated two indexes, W/H and H/A separately, and found good sensitivity, with an NPV of 94.8% and a PPV of 11.9%, respectively. In 2018, Beser et al.1 found a sensitivity of 72.2% and specificity of 93% in patients aged 1 to 5 months by W/H analysis; between 5 and 18 years of age by BMI/A, 72.3% and 94.8%, respectively; and between 1 month and 10 years of age by W/A, 70.3% and 90.3%, respectively. These studies highlight the complementarity between the tool and anthropometry, aiming to minimize the risk of neglect in the identification of patients at nutritional risk, especially among those with underlying chronic diseases.
The cut-off point of the tool with the highest sensitivity was “1” and, thus, the most adequate within the specifications required for screening, which should be fast, easy to apply and, sensitive,13 although it did not replace anthropometry. The inclusion of the classification of nutritional risk, with a Z-score between −2 and −1 of the reference curves,19,20,23 allowed the verification that the tool sensitivity increases. Thus, it is easier to identify patients who are malnourished, and the tool follows by confirming the nutritional risk, with a consequent increase in PPV, favoring more satisfactory results in the hospital environment.
A high prevalence of nutritional risk, medium or high, was also found in studies that were similar to the present,25–28 but low risk was verified by Durakbasa et al.15 in 2014 and by Mărginean et al.16 in 2014. Lower prevalence rates of nutritional risk were attributed to the sample selection criteria, in which children in situations of higher nutritional risk, such as active malignant disease16 or some surgical cases,15 were excluded. Costa and Pastore,21 in 2013 in the state of Rio Grande do Sul, Brazil, identified 16% high nutritional risk in children who stayed for more than 24h in the service, which may have evaluated the most clinically severe individuals and probably those with a higher nutritional risk. A multicenter European study found that nutritional risk varied between 5% and 30%,29 attributing this broad variation to the great diversity between the countries and characteristics of the respective health services.
The present study found a prevalence of malnourishment of 12.18%, which does not differ much from other studies, showing the wide variation of these values, mainly due to methodological aspects. The cross-sectional study by Oliveira et al.,26 carried out in Goiânia, Brazil, identified a malnutrition prevalence below 10% for all indexes (9.6% W/A, 9.7% W/H, 7% BMI/A), except for H/A, (16.9%) and AC/A (32.4%). Similar prevalence rates were verified by Huysentrut et al.24 in 2013 for Belgian children and adolescents. In a prospective multi-center cohort of children and adolescents, clinical and surgical cases from 12 European countries, the prevalence of malnutrition was 7% for BMI (acute) and 7.9% according to H/A (chronic).29 The same was not observed in the 2014 study by Cao et al.,28 except for H/A (7.2%), while the other indexes showed prevalence >10%. Andrade et al.,27 in a 2016 study carried out in the state of Bahia, Brazil, in a referral hospital, even with the inclusion of adolescents in the sample, found 13.9% malnutrition, with at least one index below the Z-score, a value similar to that found by Durakbasa et al.15 in 2014, with 13.4%. Costa and Pastore,21 in a 2015 longitudinal study carried out in southern Brazil, identified a high prevalence of malnutrition, with 20.8% malnourishment according to the W/H index in children under 1 year of age and 22.1% according to H/A.
It is emphasized that predictive values depend on the prevalence of its outcome, i.e., the PPV increases with the prevalence and the NPV decreases. Low malnutrition prevalence was observed, resulting in a low PPV. This is due to the fact that most of the positive results belong to children that were not malnourished, representing false-positive cases. In contrast, the NPV is high in these cases, favoring a good identification of those children who are not malnourished.
The implementation of STRONGkids6 in the pediatric hospitalization routine in the country would standardize the nutritional screenings, favoring temporal comparisons and between studies in this field. The fact that it is a simple, easy-to-perform, non-invasive protocol allows its application even under precarious structural conditions.
In Brazil, the Ministry of Health, as of 2006, no longer recommends the Z-score range between −1 and −2 as an indicator of nutritional risk.23 The results of the present study point to the fact that the use of this range increases the PPV of STRONGkids,6 favoring the early identification of nutritional risk in hospitalized children, complementing the use of the screening tool.
The strengths identified in the study were associated with the representative sample, allowing its use in other Brazilian regions, the logistics of data collection, with the possibility of replacement and always performed by the same researcher, as well as the inclusion of the nutritional risk category according to anthropometric criteria. However, new studies are needed to investigate associations of this tool with different clinical-nutritional outcomes. One weakness of the study was the impossibility of collecting all anthropometric data from all children, mainly due to the refusal of parents/guardians.
This study provided new data on the prevalence of malnutrition and nutritional risk in children admitted to the Brazilian FD emergency services. The accuracy validation was performed, showing high sensitivity of the tool, allowing the early identification of nutritional risk in similar populations. Therefore, the authors suggest its implementation in pediatric screening, in the context of hospital routines. However, although it is a simple and fast procedure, it does not replace anthropometric assessment, but rather complements it, particularly because the inclusion of nutritional risk classification by anthropometry emphasizes the importance of these data within the hospital environment.
Conflicts of interestThe authors declare no conflicts of interest.
The following are the supplementary data to this article:

Please cite this article as: Maciel JR, Nakano EY, Carvalho KM, Dutra ES. STRONGkids validation: tool accuracy. J Pediatr (Rio J). 2020;96:371–8.
Study conducted at Universidade de Brasília, Departamento de Nutrição, Programa de Pós-Graduação em Nutrição Humana, Brasília, DF, Brazil.


