

To evaluate socio-economic and demographic determinants of anemia among Indian children aged 6–59 months.
MethodsStatistical analysis was performed on the cross-sectional weighted sample of 40,885 children from 2005 to 2006 National Family Health Survey by using multinomial logistic regression to assess the significance of some risk factors in different degrees of child anemia. Anemia was diagnosed by World Health Organization (WHO) cut-off points on hemoglobin level. Pearson's chi-squared test was applied to justify the associations of anemia with different categories of the study population.
ResultsThe prevalence of anemia was 69.5%; 26.2% mild, 40.4% moderate, and 2.9% severe anemia. Overall prevalence rate, along with mild and moderate cases, showed an increasing trend up to 2 years of age and then decreased. Rural children had a higher prevalence rate. Of 28 Indian states in the study, 10 states showed very high prevalence, the highest being Bihar (77.9%). Higher birth order, high index of poverty, low level of maternal education, mother's anemia, non-intake of iron supplements during pregnancy, and vegetarian mother increased the risks of all types of anemia among children (p<0.05). Christian population was at lower risk; and Scheduled Caste, Scheduled Tribe, and Other Backward Class categories were at higher risk of anemia.
ConclusionThe results suggest a need for proper planning and implementation of preventive measures to combat child anemia. Economically under-privileged groups, maternal nutrition and education, and birth control measures should be priorities in the programs.
Avaliar os fatores socioeconômicos e demográficos determinantes de anemia em crianças indianas com idade de 6 a 59 meses.
MétodosA análise estatística foi realizada na amostra transversal ponderada de 40885 crianças da Pesquisa Nacional de Saúde da Família de 2005–2006, Governo da Índia, utilizando a técnica de regressão logística multimodal para avaliar a relevância de alguns fatores de risco em diferentes graus de anemia infantil. A anemia foi diagnosticada pelos pontos de corte de nível de hemoglobinas da OMS. O teste Qui-quadrado de Pearson foi utilizado para justificar as associações da anemia com diferentes categorias de população estudada.
ResultadosA prevalência de anemia foi de 69,5%, sendo 26,2% de anemia leve, 40,4% de anemia moderada e 2,9% de anemia grave. A taxa de prevalência geral, juntamente com a de anemia leve e moderada, mostrou uma tendência de aumento até os dois anos de idade e, depois disso, de queda. As crianças da zona rural têm maior taxa de prevalência. Dos 28 Estados indianos do estudo, 10 apresentaram prevalência muito alta, sendo Bihar o maior deles (77,9%). A ordem de nascimento elevada, alto índice de pobreza, baixo nível de escolaridade materna, anemia materna, não ingestão de suplementos de ferro durante a gravidez e vegetarianismo materno aumentaram os riscos de todos os tipos de anemia entre crianças (p<0,05). A população cristã tinha o menor risco; e as categorias Casta Reconhecida, Tribo Reconhecida e Outras Classes Atrasadas tinham o maior risco de anemia.
ConclusãoOs resultados sugerem a necessidade de planejamento e implementação adequados de medidas preventivas contra a anemia infantil. Grupos economicamente carentes, a nutrição e escolaridade maternas e o controle da natalidade devem ser prioridades nos programas.
Childhood anemia is one of the main deficiency diseases in the world and is associated with functional abnormalities of lymphocytes and neutrophils, including increased mortality.1,2 The condition leads to the lack of oxygen in organs and tissues, and people with anemia often feel tired, weak, cold, and short of breath. Worldwide, 47.4% of children under 5 years of age are anemic, with the burden being greatest in low- and middle-income countries.3,4
According to the United Nations Children's Fund, 90% of all types of anemia in the world are due to iron deficiency. Iron deficiency is a problem that contributes to low birth weight, lowered resistance to infection, and decreased work capacity. Young children are more vulnerable to this disease because of their rapid growth and high need for iron. Sickle cell anemia, associated with episodes of acute illness and progressive organ damage, is also becoming a common inherited disorder in the world.5 The risk factors of anemia most often cited in the literature are low family income and low maternal level of education, lack of access to healthcare services, inadequate sanitary conditions, and a diet with poor quantities of iron.6,7 The disease is also becoming common among the Scheduled Tribe (ST), Scheduled Caste (SC), and Other Backward Class (OBC) population in some parts of India.8,9
In view of magnitude and severe consequences of anemia, in order to better plan preventive measures, this study aims to identify the significant socio-economic and demographic risk factors of anemia in Indian children of 6–59 months by means of statistical modeling.
MethodsThe relevant data from children aged 6–59 months, who were tested for hemoglobin levels, from the 2005 to 2006 National Family Health Survey (NFHS), Ministry of Health and Family Welfare, Govt. of India,10 were analyzed using SPSS 15.0 software (SPSS Inc. Released 2007. SPSS for Windows, Version 15.0. Chicago, USA). The study was approved by the Ethics Committee of the Gauhati University in India. The reference number of the approval letter is GU/ACA/Ethics/2014/4044, dated November 25, 2014.
The NFHS are nationwide surveys conducted with a representative sample of households throughout the India. Samples from urban and rural areas within each State were drawn separately. The rural sample was selected in two stages, with the selection of villages, using probability proportional to population size (PPS) at the first stage, followed by the random selection of households within each village in the second stage. In urban areas, a three-stage procedure was followed. In the first stage, wards were selected with PPS sampling. In the next stage, one census enumeration block (CEB) was randomly selected from each sample ward. In the final stage, households were randomly selected within each selected CEB.
Women of age 15–49 years from the selected households were interviewed for information about their children. Hemoglobin concentration for mother and children was measured by finger-prick blood specimens using a portable Hemocue® Hb201+ analyzer (B-Hemoglobin Photometer Hemocue AB; Angelholm, Sweden). WHO classification criteria were used to diagnose child anemia as concentration level: 10.0–10.9g/dL – mild anemia; 7.0–9.9g/dL – moderate anemia; <7g/dL – severe anemia.11 Maternal anemia was diagnosed as follows: for non-pregnant women concentration <12.0g/dL, and for pregnant women <11.0g/dL. The data were weighted to account for the difference in sampling proportions among the states, and were normalized across the entire sample. Pearson's chi-squared test was used to assess the significance of association of anemia with different categories of study population. A multinomial logistic regression model12 was fitted to explore potential risk factors associated with different degrees of anemia. The response variable was designed as a polytomous ‘anemia level’ (non-anemic, mildly anemic, moderately anemic, and severely anemic); and the predictors as: age of child in years (less than 1, 1–2, 2–3, 3–4, and 4–5), birth order of child (numeric), place of residence (urban, rural), religion (Hindu, Muslim, Christian, and others), caste or tribe (SC, ST, OBC, and others), wealth index (poorest, poorer, middle, richer, and richest), mother's anemia level (non-anemic, anemic), mother's education (no education, primary, secondary, and higher), father's education (no education, primary, secondary, and higher), mother's age at first birth (numeric), iron supplements for mother during pregnancy (no, yes) and dietary habit of mother (vegetarian, non-vegetarian). Wealth index was used as an indicator of economic status of households and was developed in relation to inequalities in household income, use of health services, and health outcomes.13 Independence of the predictors was justified by variance inflation factors (VIF) under a multicolinearity test.
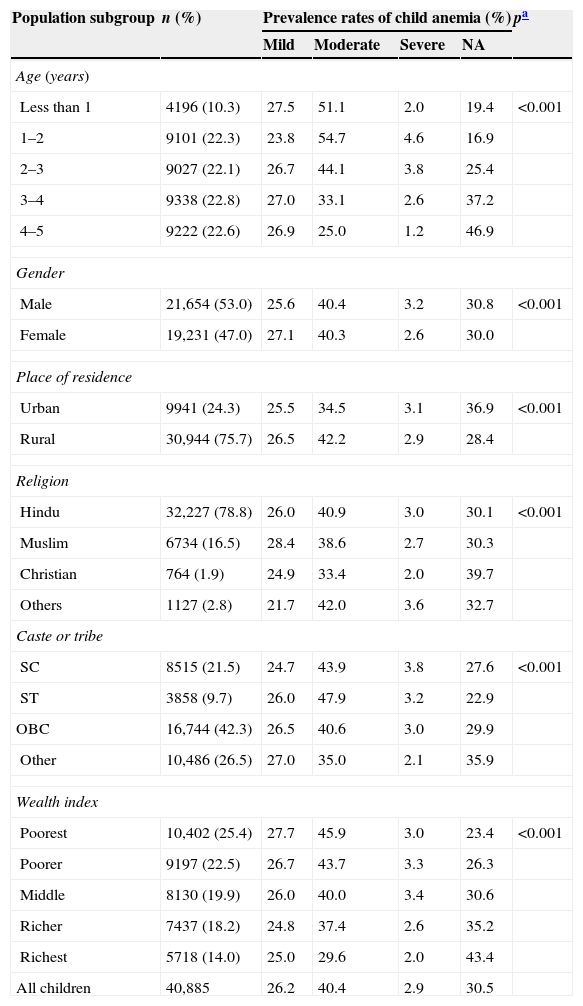
ResultsIn the studied population, 75.7% were rural and 24.3% were urban children (Table 1). The male:female sex ratio was almost 1.0:0.9. Overall, 69.5% of the children were anemic (26.2% mild, 40.4% moderate, and 2.9% severe) with mean hemoglobin concentration 10.097±1.565g/dL. Nationwide, 25.4% were from households of poorest wealth index, 22.5% poorer, 19.9% middle, 18.2% richer, and 14.0% from richest. Rural children were more anemic than urban children; males and females were almost equally anemic. The overall prevalence rate showed an increasing tendency up to 2 years of age (83.1% for 1–2 years) and then decreased linearly. Mild anemia was commonest among children of less than 1 year (27.5%); whereas moderate and severe anemia was most prevalent among 1–2 years (54.7% and 4.6%); and then followed a declining trend. Population of SC, ST, and OBC categories showed higher prevalence as compared to other categories. In the religious parameter, Christian children had a lower prevalence of moderate, severe, and overall anemia than Hindu and Muslim children. Further, all types of anemia were highly dominant among the poorest and poorer groups. The p-values showed the significant association of different levels of anemia with the various categories of study population.
Basic characteristics of the study population.
| Population subgroup | n (%) | Prevalence rates of child anemia (%) | pa | |||
|---|---|---|---|---|---|---|
| Mild | Moderate | Severe | NA | |||
| Age (years) | ||||||
| Less than 1 | 4196 (10.3) | 27.5 | 51.1 | 2.0 | 19.4 | <0.001 |
| 1–2 | 9101 (22.3) | 23.8 | 54.7 | 4.6 | 16.9 | |
| 2–3 | 9027 (22.1) | 26.7 | 44.1 | 3.8 | 25.4 | |
| 3–4 | 9338 (22.8) | 27.0 | 33.1 | 2.6 | 37.2 | |
| 4–5 | 9222 (22.6) | 26.9 | 25.0 | 1.2 | 46.9 | |
| Gender | ||||||
| Male | 21,654 (53.0) | 25.6 | 40.4 | 3.2 | 30.8 | <0.001 |
| Female | 19,231 (47.0) | 27.1 | 40.3 | 2.6 | 30.0 | |
| Place of residence | ||||||
| Urban | 9941 (24.3) | 25.5 | 34.5 | 3.1 | 36.9 | <0.001 |
| Rural | 30,944 (75.7) | 26.5 | 42.2 | 2.9 | 28.4 | |
| Religion | ||||||
| Hindu | 32,227 (78.8) | 26.0 | 40.9 | 3.0 | 30.1 | <0.001 |
| Muslim | 6734 (16.5) | 28.4 | 38.6 | 2.7 | 30.3 | |
| Christian | 764 (1.9) | 24.9 | 33.4 | 2.0 | 39.7 | |
| Others | 1127 (2.8) | 21.7 | 42.0 | 3.6 | 32.7 | |
| Caste or tribe | ||||||
| SC | 8515 (21.5) | 24.7 | 43.9 | 3.8 | 27.6 | <0.001 |
| ST | 3858 (9.7) | 26.0 | 47.9 | 3.2 | 22.9 | |
| OBC | 16,744 (42.3) | 26.5 | 40.6 | 3.0 | 29.9 | |
| Other | 10,486 (26.5) | 27.0 | 35.0 | 2.1 | 35.9 | |
| Wealth index | ||||||
| Poorest | 10,402 (25.4) | 27.7 | 45.9 | 3.0 | 23.4 | <0.001 |
| Poorer | 9197 (22.5) | 26.7 | 43.7 | 3.3 | 26.3 | |
| Middle | 8130 (19.9) | 26.0 | 40.0 | 3.4 | 30.6 | |
| Richer | 7437 (18.2) | 24.8 | 37.4 | 2.6 | 35.2 | |
| Richest | 5718 (14.0) | 25.0 | 29.6 | 2.0 | 43.4 | |
| All children | 40,885 | 26.2 | 40.4 | 2.9 | 30.5 | |
NA, non-anemic; SC, Scheduled Caste; ST, Scheduled Tribe; OBC, Other Backward Class.
It was observed that, as shown in Fig. 1, 10 states exceeded the national prevalence rate (69.5%); with the highest being Bihar (77.9%), followed by Madhya Pradesh and Uttar Pradesh, Haryana, Chhattisgarh, Andhra Pradesh and Karnataka, Rajasthan, Jharkhand, and Gujarat, respectively. Moreover, these states showed high prevalence of all types of anemia, viz. mild, moderate and severe.

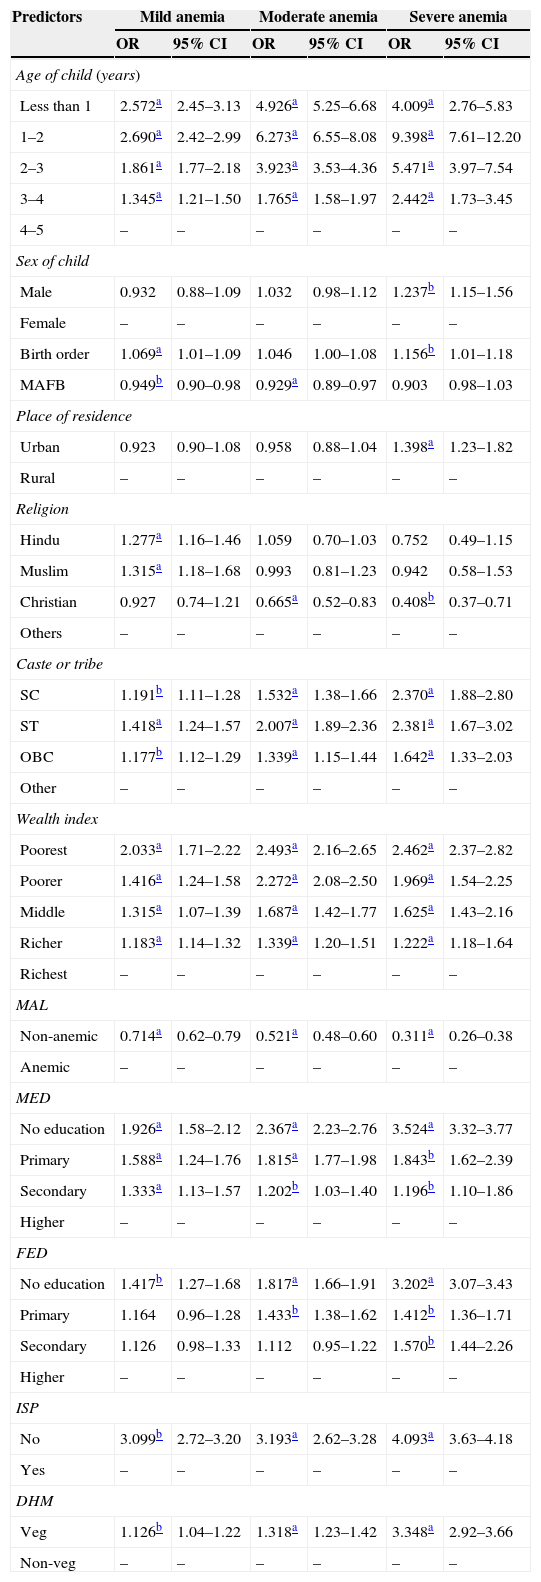
Table 2 presents the results of multinomial logistic risk factors of different categories of anemia. Children aged 1–2 years had 9.398-fold higher (95% CI 7.61–12.20) risk of severe anemia as compared to those of 4–5 years. As age increased, the risk decreased. Similar declining tendency was noticed for mild and moderate anemia. Male children were more likely to be severe anemic than females, though no significant odds were observed for mild and moderate anemia. Findings revealed that as birth order of child increased by one unit, the risk of severe anemia increased by a factor of 1.156. Further, as age of mother at first birth increased by 1 year, the risk of mild and moderate anemia decreased by t factors of 0.949 and 0.929, respectively. Urban children had 1.398-fold greater chance of severe anemia than rural children; Christian children had 0.665-fold and 0.408-fold lower chance of moderate and severe anemia respectively. Risks of all types of anemia were greater among the SC, ST, and OBC population as compared to other groups. As presented, the poorest children were more vulnerable toward all types of anemia as compared to the richest; as wealth index increased, the risks decreased. Children of non-anemic mothers had less likelihood of all types of anemia. Parents’ education had significant influence on child anemia; the risks decreased as education increased. Iron supplementation for the mother during pregnancy lowered the risks of all types of anemia for their children. The findings also showed that the risks of mild, moderate, and severe anemia were greater among the children of vegetarian mothers.
Risk factors of mild, moderate and severe anemia.
| Predictors | Mild anemia | Moderate anemia | Severe anemia | |||
|---|---|---|---|---|---|---|
| OR | 95% CI | OR | 95% CI | OR | 95% CI | |
| Age of child (years) | ||||||
| Less than 1 | 2.572a | 2.45–3.13 | 4.926a | 5.25–6.68 | 4.009a | 2.76–5.83 |
| 1–2 | 2.690a | 2.42–2.99 | 6.273a | 6.55–8.08 | 9.398a | 7.61–12.20 |
| 2–3 | 1.861a | 1.77–2.18 | 3.923a | 3.53–4.36 | 5.471a | 3.97–7.54 |
| 3–4 | 1.345a | 1.21–1.50 | 1.765a | 1.58–1.97 | 2.442a | 1.73–3.45 |
| 4–5 | – | – | – | – | – | – |
| Sex of child | ||||||
| Male | 0.932 | 0.88–1.09 | 1.032 | 0.98–1.12 | 1.237b | 1.15–1.56 |
| Female | – | – | – | – | – | – |
| Birth order | 1.069a | 1.01–1.09 | 1.046 | 1.00–1.08 | 1.156b | 1.01–1.18 |
| MAFB | 0.949b | 0.90–0.98 | 0.929a | 0.89–0.97 | 0.903 | 0.98–1.03 |
| Place of residence | ||||||
| Urban | 0.923 | 0.90–1.08 | 0.958 | 0.88–1.04 | 1.398a | 1.23–1.82 |
| Rural | – | – | – | – | – | – |
| Religion | ||||||
| Hindu | 1.277a | 1.16–1.46 | 1.059 | 0.70–1.03 | 0.752 | 0.49–1.15 |
| Muslim | 1.315a | 1.18–1.68 | 0.993 | 0.81–1.23 | 0.942 | 0.58–1.53 |
| Christian | 0.927 | 0.74–1.21 | 0.665a | 0.52–0.83 | 0.408b | 0.37–0.71 |
| Others | – | – | – | – | – | – |
| Caste or tribe | ||||||
| SC | 1.191b | 1.11–1.28 | 1.532a | 1.38–1.66 | 2.370a | 1.88–2.80 |
| ST | 1.418a | 1.24–1.57 | 2.007a | 1.89–2.36 | 2.381a | 1.67–3.02 |
| OBC | 1.177b | 1.12–1.29 | 1.339a | 1.15–1.44 | 1.642a | 1.33–2.03 |
| Other | – | – | – | – | – | – |
| Wealth index | ||||||
| Poorest | 2.033a | 1.71–2.22 | 2.493a | 2.16–2.65 | 2.462a | 2.37–2.82 |
| Poorer | 1.416a | 1.24–1.58 | 2.272a | 2.08–2.50 | 1.969a | 1.54–2.25 |
| Middle | 1.315a | 1.07–1.39 | 1.687a | 1.42–1.77 | 1.625a | 1.43–2.16 |
| Richer | 1.183a | 1.14–1.32 | 1.339a | 1.20–1.51 | 1.222a | 1.18–1.64 |
| Richest | – | – | – | – | – | – |
| MAL | ||||||
| Non-anemic | 0.714a | 0.62–0.79 | 0.521a | 0.48–0.60 | 0.311a | 0.26–0.38 |
| Anemic | – | – | – | – | – | – |
| MED | ||||||
| No education | 1.926a | 1.58–2.12 | 2.367a | 2.23–2.76 | 3.524a | 3.32–3.77 |
| Primary | 1.588a | 1.24–1.76 | 1.815a | 1.77–1.98 | 1.843b | 1.62–2.39 |
| Secondary | 1.333a | 1.13–1.57 | 1.202b | 1.03–1.40 | 1.196b | 1.10–1.86 |
| Higher | – | – | – | – | – | – |
| FED | ||||||
| No education | 1.417b | 1.27–1.68 | 1.817a | 1.66–1.91 | 3.202a | 3.07–3.43 |
| Primary | 1.164 | 0.96–1.28 | 1.433b | 1.38–1.62 | 1.412b | 1.36–1.71 |
| Secondary | 1.126 | 0.98–1.33 | 1.112 | 0.95–1.22 | 1.570b | 1.44–2.26 |
| Higher | – | – | – | – | – | – |
| ISP | ||||||
| No | 3.099b | 2.72–3.20 | 3.193a | 2.62–3.28 | 4.093a | 3.63–4.18 |
| Yes | – | – | – | – | – | – |
| DHM | ||||||
| Veg | 1.126b | 1.04–1.22 | 1.318a | 1.23–1.42 | 3.348a | 2.92–3.66 |
| Non-veg | – | – | – | – | – | – |
OR, odds ratio; CI, confidence interval; MAFB, mother's age at first birth; SC, Scheduled Caste; ST, Scheduled Tribe; OBC, Other Backward Class; MAL, mother's anemia level; MED, mother's education; FED, father's education; ISP, iron supplementation to mother during pregnancy; DHM, dietary habit of mother.
Detection of the risk factors is fundamental for planning and implementation of programs to eradicate child anemia, especially in those groups where prevalence is very high. In the studied population, almost 7 out of 10 children were anemic. Though overall anemia status did not present any significant variation in terms of sex, boys were more affected with severe anemia than girls. This is probably due to fact that the higher growth rate among boys during growth stages results in higher anemia prevalence, as their bodies demand a higher amount of iron, which cannot be supplied by the diet.14 The age of child and mother's anemia level predicted childhood anemia, similar to the findings of some other studies conducted in Burma, Benin, and Mali.15,16 In the present study, a declining tendency in risks and prevalence of anemia was noticed after 2 years of age. A possible explanation for the fall of anemia prevalence with age is that the iron intakes are likely to improve with age, as a result of a more varied diet, including the introduction of meat and other hemoglobin-containing diets.17 Household wealth index and parents’ level of education was found important socio-economic factors for child anemia; this may be because of association of higher level with increased chances of having a job and income, and consequently, easier access to iron-rich food. Mother's level of education, in its turn, influences the practices related to the child's health care.18
Vegetarian mothers had greater odds to have anemic children, probably due to the fact that vegetarian diets lead to poor use of biological iron in the body as compared to non-vegetarian diets; consequently, deficiency in the mother leads to poor physiological reserves of iron in the fetus. It is also found that, in several instances, children of vegetarian mothers are also vegetarian, which may be another reason for higher chances of anemia.
In the studied sample, 98.6% of Christian women were non-vegetarian; the findings revealed less likelihood of anemia for their children. Iron supplementation to pregnant mothers also reduced the likelihood of child anemia. Unfortunately, most women start pregnancy without sufficient stores of iron to meet their body's increased demands, particularly in the second and third trimesters; as a result, iron deficiency anemia among young children has become a major problem worldwide.
A limitation of the study was that the effect of iron supplementation and dietary habit of children on anemia was not analyzed, because of a concerning lack of data. Also, hemoglobin concentration for one of the Indian States, Nagaland, was not measured. Though the population of Nagaland is very small as compared to the total population of the country, the incomplete data may have led to some biased estimates. Further, as the population of the country is very large, cross-sectional study design was adopted; there was a possibility of confounded effects. However, independence of predictors was justified by multicolinearity test.
It can be concluded that the prevalence rate of child anemia is very high in India; poor economic status of household, low level of parents’ education, higher birth order of child, vegetarian mother, mother's anemia, and non-intake of iron supplements during pregnancy increase the risk of child anemia.
Conflicts of interestThe authors declare no conflicts of interest.
Please cite this article as: Goswmai S, Das KK. Socio-economic and demographic determinants of childhood anemia. J Pediatr (Rio J). 2015;91:471–77.


