
This study aimed to determine the ability of different measures of adiposity to discriminate between low/high motor coordination and to evaluate the relationship between different measures of adiposity and motor coordination.
MethodsThis study included 596 elementary school children aged 9 to 12 years (218 females – 47.1%). Weight, height, and waist circumference were objectively measured by standardized protocols. Body fat percentage was estimated by bioelectric impedance. Body mass index and waist-to-height ratio were computed. Motor coordination was assessed by the Körperkoordination Test für Kinder. Cardiorespiratory fitness was predicted by a maximal multistage 20 m shuttle-run test of the Fitnessgram Test Battery. A questionnaire was used to assess the maternal educational level.
ResultsThe receiver operating characteristic performance of body fat percentage in females and waist circumference in males presented a slightly better discriminatory accuracy than body mass index, waist circumference and waist-to-height ratio in predicting low motor coordination. After adjustments, logistic regression analyses showed that body mass index (β=2.155; 95% CI: 1.164-3.992; p=0.015 for girls; β=3.255; 95% CI: 1.740-6.088; p<0.001 for males), waist circumference (β=2.489; 95% CI: 1.242-4.988; p=0.010 for girls; β=3.296; 95% CI: 1.784-6.090; p<0.001 for males), body fat percentage (β=2.395; 95% CI: 1.234-4.646; p=0.010 for girls; β=2.603; 95% CI: 1.462-4.634; p<0.001 for males) and waist-to-height ratio (β=3.840; 95% CI: 2.025-7.283; p<0.001 for males) were positively and significantly associated with motor coordination in both sexes, with the exception of waist-to-height ratio in girls (β=1.343; 95% CI: 0.713-2.528; p=0.381).
ConclusionBody fat percentage and waist circumference showed a slightly better discriminatory accuracy in predicting low motor coordination for females and for males, respectively.
Este estudo pretende: (i) determinar a capacidade de diferentes medidas de adiposidade para diferenciar pouca/ampla CM; e (ii) avaliar a relação entre diferentes medidas de adiposidade e coordenação motora.
Método596 crianças em idade escolar fundamental, de 9 a 12 anos (218 meninas – 47,1%) participaram deste estudo. O peso, a altura e a circunferência da cintura foram mensurados objetivamente pelos protocolos padronizados. O percentual de gordura corporal foi estimado pela impedância bioelétrica. Foram calculados o índice de massa corporal e a razão cintura/estatura. A coordenação motora foi avaliada por meio do teste de coordenação corporal para crianças. A capacidade cardiorrespiratória foi predita por um teste shuttle-run multinível de no máximo 20 m da Bateria de Testes Fitnessgram. Foi usado um questionário para avaliar o nível de escolaridade das mães.
ResultadosO desempenho na curva de característica de operação do receptor do percentual de gordura corporal, em meninas, e da circunferência da cintura, em meninos, demonstrou uma precisão discriminatória levemente melhor que o índice de massa corporal, a circunferência da cintura e a razão cintura/estatura em predizer pouca coordenação motora. Após ajustes, as análises de regressão logística demonstraram que o índice de massa corporal (β=2,155; Intervalo de Confiança (IC) 95%: 1,164-3,992; p=0,015 para meninas; β=3,255; IC 95%: 1,740-6,088; p<0,001 para meninos), a circunferência da cintura (β=2,489; IC 95%: 1,242-4,988; p=0,010 para meninas; β=3,296; IC 95%: 1,784-6,090; p<0,001 para meninos), o percentual de gordura corporal (β=2,395; IC 95%: 1,234-4,646; p=0,010 para meninas; β=2,603; IC 95%: 1,462-4,634; p<0,001 para meninos) e a razão cintura/estatura (β=3,840; IC 95%: 2,025-7,283; p<0,001 para meninos) estavam positiva e significativamente relacionados à coordenação motora em ambos os sexos, com exceção da razão cintura/estatura em meninas (β=1,343; IC 95%: 0,713-2,528; p=0,381).
ConclusãoO percentual de gordura corporal e a circunferência da cintura mostraram uma precisão discriminatória ligeiramente melhor na previsão de pouca coordenação motora para meninas e meninos, respectivamente.
Childhood and adolescent obesity has become an important public health problem, as its prevalence has increased significantly over the past years in several countries.1 In Portugal, approximately one-third of children and adolescents are overweight or obese.2
An appropriate motor coordination (MC) level is essential for children's healthy growth and development, as well as for psychosocial skills and well-being.3,4 Although rudimentary forms of movement patterns may naturally be developed, mature forms of motor proficiency are more likely to be achieved with appropriate practice, encouragement, feedback, and instruction.5 The early childhood years are a key time for the development of these skills, which are considered the building blocks of more complex movements.6
It is reasonably well established in literature that there is an inverse associationbetween adiposity and MC, i.e., overweight and particularly obese children display markedly poorer performance and are less competent in motor tasks requiring support, propulsion, or movement of a great proportion of body mass compared with their normal weight counterparts.7–9 A recent review10 on the relationship between MC and health benefits in children and adolescents indicated that MC levels are inversely correlated with weight status both in cross-sectional and longitudinal studies; in that review, weight status was negatively correlated with MC in six of nine studies, and the remaining three demonstrated no relationship. For example, D’Hondt et al.,11 in a two-year longitudinal study, investigated the short-term change in the level of gross MC according to children's weight status, and concluded that participants in the normal weight group showed more progress than their overweight/obese peers, who demonstrated significantly poorer performances.
There are some sophisticated methods to accurately measure body fat percentage, such as computed axial tomography or dual-energy X-ray absorptiometric densitometry; however, it is not feasible to apply such techniques in large epidemiological studies or even in clinical settings because they are complex, time-consuming, and expensive. Therefore, several anthropometric measures, indices and other techniques (such as bioelectric impedance) have been used in the literature on the association between adiposity and MC, and the most common is the body mass index (BMI). Nevertheless, waist circumference and waist-to-height ratio measures of central obesity have yielded important insight in pediatric populations12 as well, and appears to be stronger predictors of cardiovascular risk among children.13 In a recent systematic review, Rivilis et al.14 concluded that an adverse body composition was associated with poor motor proficiency regardless of the measure of adiposity considered.
However, the gap that remains in the literature is on the ability of the different measures of weight status/adiposity to predict low MC, namely which is the most accurately non-laboratory measure of adiposity that better identifies low/high MC. Therefore, the aims of this study were (i) to determine the ability (sensibility and specificity) of different measures of adiposity: BMI, waist circumference, body fat percentage, and waist-to-height ratio to discriminate between low/high MC; and (ii) to evaluate the relationship between BMI, waist circumference, waist-to-height ratio, and fat mass percentage and MC, in a sample of children aged 9-12 years. The study attempts to answer two questions: what is the most accurate (result from the balance between sensitivity and specificity) non laboratory measure of adiposity to distinguish between high/low MC? And do BMI, waist circumference, waist-to-height ratio, and fat mass percentage predict MC? This study will allow for monitoring and comparing, and will contribute to the construction of new knowledge through the exploration of associations between these four non-laboratory measures of adiposity and MC.
MethodsData for the present study derived from the Bracara Study, which aimed to evaluate the relations between MC, physical activity, physical fitness, body composition, academic achievement, and health behaviors among elementary school children. The Bracara Study was conducted in a middle city located in the north of Portugal during the 2009/2010 academic year. Study design, sampling, and measures are reported elsewhere.15
Study Design and SamplingAll 21 urban public elementary schools in the city were considered and invited to participate in this study, corresponding to 846 children enrolled in the fourth grade. Two schools declined the invitation, corresponding to 90 children; six schools could not be evaluated in time to take part in this study, corresponding to 130 children; and 30 children who failed the inclusion criteria (having a mental and/or physical disability or a health condition that did not allow them to participate in physical education classes) or who had missing information on the variables of interest were excluded from this analysis. Therefore, the final sample included 596 participants (281 females – 47.1%) aged 9-12 years.
The schools’ directors and children's parents/guardians received verbal and written descriptions of the study and signed an informed consent. The protocol and procedures employed followed the Helsinki Declaration for Investigation in Human Subjects and were approved by the Portuguese Ministry of Education and by the University's Ethics Committee.
All data was collected during regularly scheduled physical education classes by two full-time assessors, who were physical education teachers and received specific training, and had already participated in previous anthropometry, Körperkoordination Test für Kinder (KTK), and aerobic fitness data collection. They were helped by the physical education teachers of the schools enrolled in this study. The data were collected at the same time and the agreement between these two assessors was tested in a previous data collection showing good results (data not published).
MeasuresAnthropometryWeight was measured to the nearest 0.1kg using a regularly calibrated digital scale, model TBF-300 (Tanita, São Paulo, Brazil) with the children in light clothing and without shoes. Body fat percentage was estimated by a bioelectric impedance digital scale, model TBF-300 (Tanita, São Paulo, Brazil). Height was measured to the nearest millimeter in bare or stocking feet with the children standing upright against a stadiometer, model 220 (Seca, São Paulo, Brazil). Waist circumference measurements were taken with a non-elastic tape as described by Lohman et al.16 BMI [body mass (kg)/height (m2)] and waist-to-height ratio [waist (cm)/height (cm)] were calculated.
MCThe body coordination test KTK was used to assess MC.17 The KTK battery has four items: balance; jumping laterally; hopping on one leg over an obstacle; and shifting platforms. The tests were applied following the original protocols described elsewhere.15 For this study, participants were divided into two categories according to their MC quotient: high MC (those with normal, good, or very good MC) and low MC (insufficient MC and MC disorders). The terminology used in this paper is in agreement with the most relevant and recent literature on this subject.4,8,15,18–20
Cardiorespiratory FitnessThe 20 m shuttle-run test was used to evaluate cardiorespiratory fitness according to the Fitnessgram test battery protocol, version 8.0.21
SociodemographicsMaternal educational level was assessed by a questionnaire distributed to the mothers of the participants in this study and was used as a proxy measure of socioeconomic status as previously applied in Portuguese studies. The educational level was categorized according to the Portuguese Education Level in 2009: low (mandatory education – nine school years); medium (secondary education – 12 school years); and high (college or university degree).
Statistical analysisStudent's t-test for continuous variables was used for comparisons between groups. Receiver operating characteristic (ROC) curves were used to analyze the potential diagnostic accuracy of the different measures of adiposity to discriminate between low and high MC (best trade-off between sensitivity and specificity of different adiposity measures that best differentiate between high and low MC). The area under the ROC curve (AUC) represents the ability of the test to correctly classify the participants with high or low MC. AUC values range between 1 (a perfect test) and 0.5 (a inadequate test).
In a preliminary analysis, the variables “school” and “teacher” were not significantly correlated with children's MC, physical fitness, or body composition, and there were no significant differences in the mean values of MC, physical fitness, or body composition between schools or teachers. Therefore, multilevel analysis was not performed and these variables were not used as potential confounders. In Portugal, there is a mandatory curriculum for schools (school and teacher are not allowed to introduce different subjects); furthermore, the “type of the school” (i.e. the type of building and the spaces available for outdoor activities during recess) in this study was similar. Those may be possible explanations for the lack of associations. Therefore, logistic regression analyses were performed to further study the relationship between different measures of adiposity and MC. Adjustments were performed for potential confounders: cardiorespiratory fitness and maternal education levels. In this analysis, given that the motor quotient of each participant was calculated based on the scores attained by age and gender, no further adjustments for age were performed.
Data were analyzed using the IBM SPSS Statistics v.19 (SPSS, Inc. IBM Company, New York, USA) and MedCalc statistical software (MedCalc software, Mariakerke, Belgium). A p-value under 0.05 denoted statistical significance.
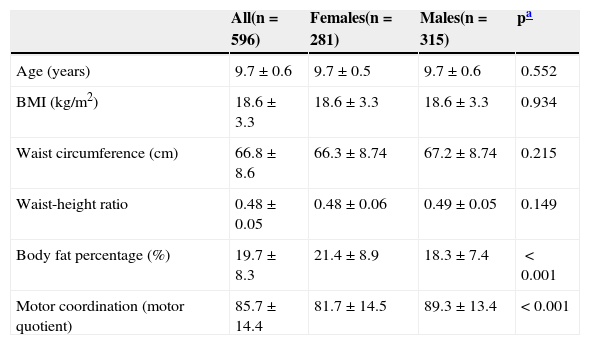
ResultsDescriptive statistics for the age, BMI, waist circumference, body fat percentage, waist-to-height ratio, and MC are summarized in Table 1. Females had significantly lower MC and higher body fat percentage than males (p<0.001 for both).
Participants’ characteristics.
| All(n=596) | Females(n=281) | Males(n=315) | pa | |
|---|---|---|---|---|
| Age (years) | 9.7±0.6 | 9.7±0.5 | 9.7±0.6 | 0.552 |
| BMI (kg/m2) | 18.6±3.3 | 18.6±3.3 | 18.6±3.3 | 0.934 |
| Waist circumference (cm) | 66.8±8.6 | 66.3±8.74 | 67.2±8.74 | 0.215 |
| Waist-height ratio | 0.48±0.05 | 0.48±0.06 | 0.49±0.05 | 0.149 |
| Body fat percentage (%) | 19.7±8.3 | 21.4±8.9 | 18.3±7.4 | <0.001 |
| Motor coordination (motor quotient) | 85.7±14.4 | 81.7±14.5 | 89.3±13.4 | < 0.001 |
BMI, body mass index (kg/m2).
169 females (28.4%) and 138 males (23.1%) were classified has having low MC, whereas 112 females (18.8%) and 177 males (29.7%) were classified as having high MC.
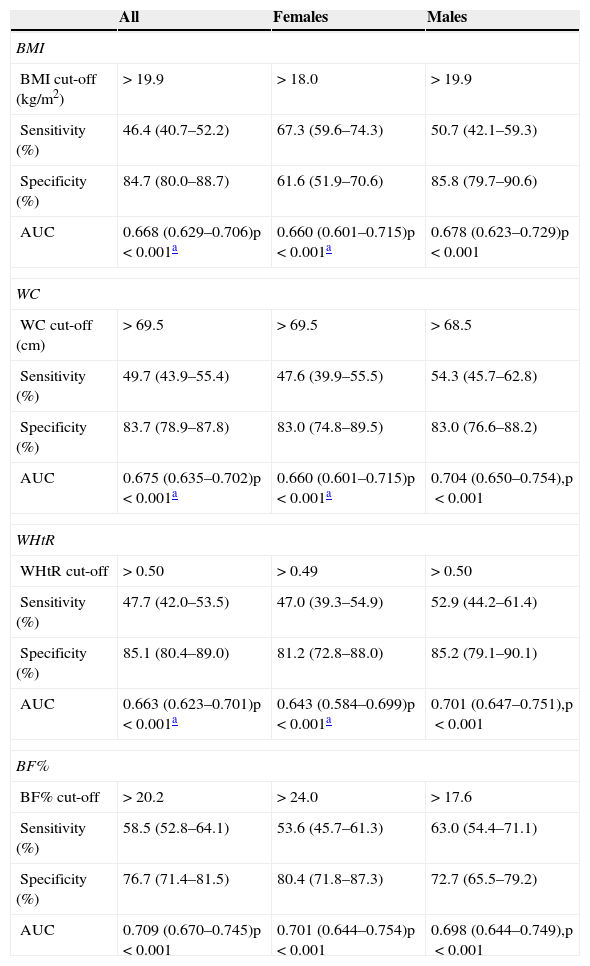
ROC curve analysis showed that all measures of adiposity performed well on average in identifying low MC, as indicated by AUC>0.6. The ROC performance of body fat percentage showed a slightly better discriminatory accuracy than did BMI, waist circumference and waist-to-height ratio in predicting low MC in females. In males, the ROC performance of waist circumference showed a better discriminatory accuracy than BMI, body fat percentage, and waist-to-height ratio in predicting low MC. In males, the ROC performance of BMI, waist circumference, and waist-to-height ratio were slightly better than in females. The AUC of BMI, waist circumference, and waist-to-height ratio were significantly different from body fat percentage (p<0.05) for the whole sample and for females. The following were observed to be optimal cut-offs for defining low MC: BMI, 18.0 kg/m2 and 19.9kg/m2; waist circumference, 69.50 cm and 68.50 cm; body fat percentage, 24.0% 17.60%; and waist-to-height ratio of 0.497 and 0.50, for females and males, respectively. (Table 2).
Cut-off values, sensitivity, and specificity for the association of different measures of adiposity with motor coordination by sex.
| All | Females | Males | |
|---|---|---|---|
| BMI | |||
| BMI cut-off (kg/m2) | >19.9 | >18.0 | >19.9 |
| Sensitivity (%) | 46.4 (40.7–52.2) | 67.3 (59.6–74.3) | 50.7 (42.1–59.3) |
| Specificity (%) | 84.7 (80.0–88.7) | 61.6 (51.9–70.6) | 85.8 (79.7–90.6) |
| AUC | 0.668 (0.629–0.706)p<0.001a | 0.660 (0.601–0.715)p<0.001a | 0.678 (0.623–0.729)p<0.001 |
| WC | |||
| WC cut-off (cm) | >69.5 | >69.5 | >68.5 |
| Sensitivity (%) | 49.7 (43.9–55.4) | 47.6 (39.9–55.5) | 54.3 (45.7–62.8) |
| Specificity (%) | 83.7 (78.9–87.8) | 83.0 (74.8–89.5) | 83.0 (76.6–88.2) |
| AUC | 0.675 (0.635–0.702)p<0.001a | 0.660 (0.601–0.715)p<0.001a | 0.704 (0.650–0.754),p<0.001 |
| WHtR | |||
| WHtR cut-off | >0.50 | >0.49 | >0.50 |
| Sensitivity (%) | 47.7 (42.0–53.5) | 47.0 (39.3–54.9) | 52.9 (44.2–61.4) |
| Specificity (%) | 85.1 (80.4–89.0) | 81.2 (72.8–88.0) | 85.2 (79.1–90.1) |
| AUC | 0.663 (0.623–0.701)p<0.001a | 0.643 (0.584–0.699)p<0.001a | 0.701 (0.647–0.751),p<0.001 |
| BF% | |||
| BF% cut-off | >20.2 | >24.0 | >17.6 |
| Sensitivity (%) | 58.5 (52.8–64.1) | 53.6 (45.7–61.3) | 63.0 (54.4–71.1) |
| Specificity (%) | 76.7 (71.4–81.5) | 80.4 (71.8–87.3) | 72.7 (65.5–79.2) |
| AUC | 0.709 (0.670–0.745)p<0.001 | 0.701 (0.644–0.754)p<0.001 | 0.698 (0.644–0.749),p<0.001 |
AUC, area under the curve; BMI, body mass index (kg/m2); WC, waist circumference (cm); BF%, body fat percentage; WHtR, waist (cm) to height (cm) ratio; 95% Confidence Intervals in parentheses.
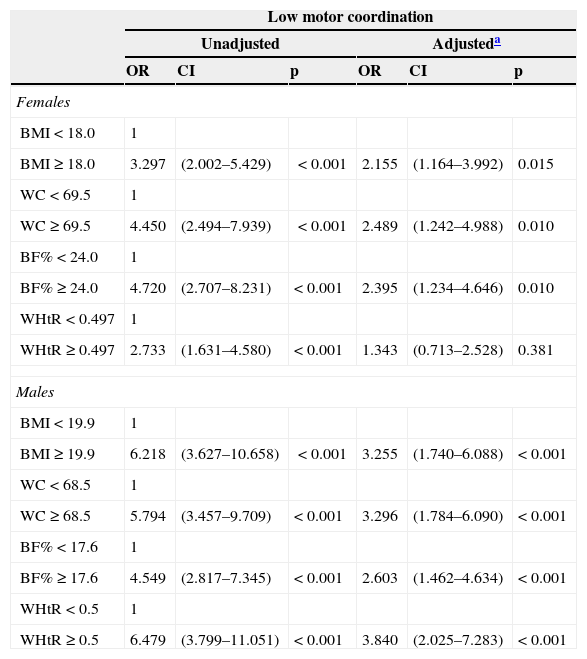
Logistic regression analyses showed that BMI, waist circumference, body fat percentage, and waist-to-height ratio were positively and significantly associated with low MC in both sexes, with the exception of waist-to-height ratio after adjustments for females (Table 3).
Odds ratios and 95% confidence intervals from logistic regression model predicting low motor coordination, for body mass index, waist circumference, waist-to-height ratio, and fat mass percentage, by sex.
| Low motor coordination | ||||||
|---|---|---|---|---|---|---|
| Unadjusted | Adjusteda | |||||
| OR | CI | p | OR | CI | p | |
| Females | ||||||
| BMI<18.0 | 1 | |||||
| BMI≥18.0 | 3.297 | (2.002–5.429) | <0.001 | 2.155 | (1.164–3.992) | 0.015 |
| WC<69.5 | 1 | |||||
| WC≥69.5 | 4.450 | (2.494–7.939) | <0.001 | 2.489 | (1.242–4.988) | 0.010 |
| BF%<24.0 | 1 | |||||
| BF%≥24.0 | 4.720 | (2.707–8.231) | <0.001 | 2.395 | (1.234–4.646) | 0.010 |
| WHtR<0.497 | 1 | |||||
| WHtR≥0.497 | 2.733 | (1.631–4.580) | <0.001 | 1.343 | (0.713–2.528) | 0.381 |
| Males | ||||||
| BMI<19.9 | 1 | |||||
| BMI≥19.9 | 6.218 | (3.627–10.658) | <0.001 | 3.255 | (1.740–6.088) | <0.001 |
| WC<68.5 | 1 | |||||
| WC≥68.5 | 5.794 | (3.457–9.709) | <0.001 | 3.296 | (1.784–6.090) | <0.001 |
| BF%<17.6 | 1 | |||||
| BF%≥17.6 | 4.549 | (2.817–7.345) | <0.001 | 2.603 | (1.462–4.634) | <0.001 |
| WHtR<0.5 | 1 | |||||
| WHtR≥0.5 | 6.479 | (3.799–11.051) | <0.001 | 3.840 | (2.025–7.283) | <0.001 |
BMI, body mass index (kg/m2), WC, waist circumference (cm); BF%, body fat percentage; WHtR, waist (cm) to height (cm) ratio; OR, odds ratio; CI, confidence intervals.
The main findings of this study suggest that body fat percentage provides a marginally superior tool for discriminating low MC for females as compared with BMI, waist circumference, and waist-to-height ratio. In males, waist circumference showed a slightly better discriminatory accuracy in predicting low MC as compared with BMI, body fat percentage, and waist-to-height ratio. Slightly higher pooled AUC were observed in males as compared to females (with an exception in body fat percentage), suggesting that discrimination is more precise, on average, in males. Logistic regression analyses showed that all different measures of adiposity were negatively and significantly associated with MC in both sexes, with the exception of waist-to-height ratio for females, after adjusting for cardiorespiratory fitness and maternal education level.
A recent review of the associations between MC and aspects of physical and psychological attributes provides indirect evidence that MC may be an important antecedent or consequent mechanism for promoting health-related behaviors, including weight status.10 However, measurement issues may potentially play a role in obscuring the relationship between body composition and MC.14
In the present study, body fat percentage assessed by bioelectric impedance was the measure that best predicted low MC in females. Body fat percentage measurement techniques have been developed and validated for children; however, they have rarely been used in the literature regarding the relationship between adiposity and MC. The existing studies have found significant associations between body fat percentage and MC, whether using skin folds,9 bioelectric impedance22 or whole body air displacement plethysmography methods.23 Using bioelectric impedance, Cairney et al.,22 also found that children with poor MC had greater body weight and body fat compared to their normal MC peers. Bioelectric impedance is an appealing tool for assessing body composition due to the fact that it is simple, painless, non-invasive, and increasingly cheap, making it highly suitable for survey and clinic use, particularly in school-age children.24 However, the resulting estimates of fat and fat-free mass are in poor agreement with more accurate methods, tending to be both biased and imprecise.25
BMI is the most common anthropometric measure used in studies relating to adiposity status and MC.10,14 In a cross-sectional study with 954 Flemish stratified primary school children, D’Hondt et al.,8 observed that less than 20% of the healthy-weight participants was identified as being motor impaired, while that proportion increased to 43.3% and up to 70.8% in children with overweight and obesity, respectively. BMI is a suboptimal marker of body fat because it does not distinguish fat from lean tissue or bone; therefore, classifying people as overweight or obese based on their BMI alone may lead to significant misclassification. Moreover, BMI is not a suitable method to assess body fat distribution,26 and it has been suggested that BMI may be a less sensitive indicator of fat in children and adolescents than waist circumference or waist-to-height ratio.26
In the present study, waist circumference was the measure that best predicted low MC in males. In a longitudinal study, Cairney et al.,27 also found associations between MC and waist circumference. Waist circumference is a simple, effective, and inexpensive anthropometric tool to measure abdominal adiposity and related metabolic risks in children of different ethnicities.26,28 For children and adolescents, there are no internationally accepted cut-off values; however, waist circumference centile charts have been developed for children and adolescents in some countries.29 Abdominal obesity appears to reflect intra-abdominal fat, including visceral adipose tissue,30 and it is known that increased visceral adipose tissue is strongly correlated with cardiovascular disease risk factors.31 During childhood and adolescence, abdominal obesity is an important predictor for several cardiovascular disease risk factors.13 Indeed, in a cross-sectional study with 571 elementary school students, Faught et al.32 found an association between poor MC with increased body fat and low cardiorespiratory fitness – physical activity was a significant mediator for both relationships. These authors concluded that poor MC is related to factors associated with increased risk for coronary vascular disease, including decreased cardiorespiratory fitness and increased body fat through the mediating influence of physical activity in children.
Waist-to-height ratio has been proposed as a convenient alternative measurement to assess central fatness in children.13 Similar to waist circumference, waist-to-height ratio has been shown to be strongly correlated with abdominal fat measured using imaging techniques.31 Correcting waist circumference to height may obviate the need for age-, sex-, and ethnic-related reference values,33 while waist circumference requires population-specific cut-off values.34 To the best of the authors’ knowledge, there are no studies linking waist-to-height ratio and MC; however, the good AUC found in this study may suggest that waist-to-height ratio is a good measure for predicting low MC.
Strengths and limitationsThis study has some limitations that need to be recognized. The data has been derived from a cross-sectional study; therefore the results do not indicate causality. The present sample is not representative of the Portuguese population; therefore, the present findings are not generalizable.
Overall, the strengths of the present study are that the present findings are based on objective measurements using reliable and valid test instruments (the KTK); the inclusion of potential confounding factors such as maternal education level (used as a proxy measure of socioeconomic status), which is recognized as having a powerful and synergistic relationship with obesity;35 the presence of cardiorespiratory fitness as a potential confounding element, due to its importance of being simultaneously linked to adiposity and MC (i.e., inversely associated with adiposity and positively related to MC);9,32 and the novelty of the study, which aimed to determine the ability of different measures of adiposity to discriminate between low and high MC.
More research on other measures and techniques is needed to further assess the accuracy of different measures of adiposity in discriminating between low and high MC.
Body fat percentage and waist circumference showed a slightly better discriminatory accuracy in predicting low MC for females and for males, respectively. BMI, waist circumference, body fat percentage, and waist-to-height ratio were positively and significantly associated with low MC in both sexes, with the exception of waist-to-height ratio in females after adjustments.
FundingPortuguese FCT-MEC (Fundação para a Ciência e a Tecnologia - Ministério da Educação e Ciência) grant [Doctoral Scholarship/43808/2008].
Conflicts of interestThe authors declare no conflicts of interest.
The first author was supported by a Portuguese FCT-MEC grant [Doctoral Scholarship/43808/2008].
Please cite this article as: Lopes L, Santos R, Moreira C, Pereira BL, Lopes VP. Sensitivity and specificity of different measures of adiposity to distinguish between low/high motor coordination. J Pediatr (Rio J). 2015;91:44–51.


