
Latitude gradients have been found in the male-female ratio at birth (M/F: male divided by total births), which is anticipated to be 0.515.
MethodsAnnual national male and female live births by country were obtained for South America from the World Health Organization (WHO) and analysed with contingency tables. The continent was arbitrarily divided into two regions: a region 10° above the Equator to 20° below the Equator, and a second area 20° below the Equator.
ResultsThis study analyzed 147,773,689 live births. An overall increasing trend in M/F was found for the region >20° (p<0.0001) for the entire period. For the aggregate, a significant decrease was present for the period 1950-74 (p = 0.01) followed by a significant increase thereafter (p<0.001). A latitude gradient was also noted, with more males being born in cooler (more Southern > 20° S) latitudes (p<0.0001). There were 3,765,648 male births in excess of what was anticipated.
ConclusionThe M/F ratio is increasing in South America, unlike the decline present in Europe and North America. This study also showed that M/F latitude gradients are similar to those previously reported in North America, with more males being born in cooler latitudes, contrary to the trends reported in Europe. The interplay of several poorly understood factors is likely.
Analisar as tendências seculares e gradientes de latitude na proporção masculino-feminina ao nascimento (M/F: masculinos divididos por total de nascidos vivos) no Continente Sul Americano.
MétodosOs dados sobre nascidos vivos masculinos e femininos em âmbito nacional, durante um ano por país, foram obtidos da Organização Mundial da Saúde e analisados com tabelas de contingência. O continente foi arbitrariamente dividido em duas regiões: a primeira: de 10° acima da linha do Equador até 20° abaixo da linha Equador (10° N-20° S), e uma segunda abaixo de 20° da linha do Equador (> 20°S).
ResultadosO estudo analisou 147.773.689 nascidos vivos. Encontrou-se uma tendência crescente M/F na maioria dos países próximos ao Equador (10° N-20° S) (p = 0,004). A análise do período entre 1950 e 1974 não mostrou diferença, porém após este período (1974-1996) encontrou-se um aumento M/F (p = 0,03). Um aumento na proporção M/F foi encontrado em todo o período na região > 20°S (p<0,0001). Também foi observado um gradiente de latitude, nascendo mais lactentes masculinos em latitudes mais frias (mais ao sul, > 20°S) (p<0,0001).
ConclusãoA proporção M/F está crescendo na América do Sul, diferentemente do presente declínio na Europa e na América do Norte. Este estudo também mostra que os gradientes de latitude para a proporção M/F são semelhantes àqueles anteriormente publicados na América do Norte, nascendo mais bebês masculinos nas latitudes mais frias, ao contrário das tendências publicadas na Europa. É provável o inter-relacionamento de vários fatores ainda pouco entendidos.
In mammals, sex is determined at conception, and male births occur slightly in excess.1 The male to female ratio of live births is generally expressed as the ratio of male live births divided by total live births. Although this would be more accurately abbreviated as M/T (male births divided by total births), it is widely (albeit technically incorrectly) abbreviated as M/F, and this will be used throughout. For humans, M/F is anticipated to be 0.515.2 The reason for this discrepancy is uncertain, but a plethora of factors have been proposed.3
It has been demonstrated that M/F varies by geographical location, exhibiting a latitude gradient.4 This gradient is different in Europe and North America, with more males born towards the south of Europe, in contrast with the North American continent, where more males are born towards the north of the continent.2
Several studies have also shown that M/F varies through time. The most striking findings have been a decline in M/F over the second half of the 20th century in various industrialized countries.5
This study identified the secular trends in M/F in South America from a World Health Organization (WHO) dataset for the second half of the 20th century. Trends by geographical latitude were also analysed. The null hypothesis was that there were no significant geographical or temporal differences in M/F.
MethodsData sourcesAnnual male and female live births had been obtained directly from WHO in 2000. The original sources were contacted (Drs. Galea and Inoue – personal communication) and the data was made available as an official, comma-delimited file directly from WHO. This was imported into Microsoft Excel, which was then used for collation and analysis.
Data was available for South American countries as shown in Table 1. Data for Guyana and French Guiana were unavailable.
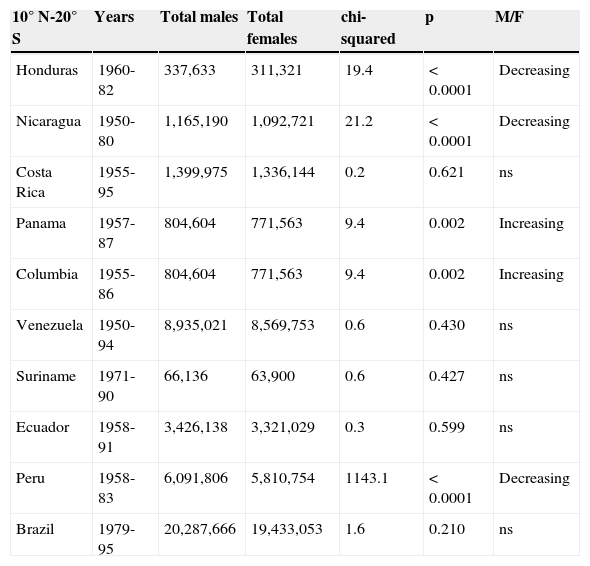
Total male and female live births for South American countries and chi-squared for trend analysis of the male to female ratio (male divided by total births).
| 10° N-20° S | Years | Total males | Total females | chi-squared | p | M/F |
|---|---|---|---|---|---|---|
| Honduras | 1960-82 | 337,633 | 311,321 | 19.4 | < 0.0001 | Decreasing |
| Nicaragua | 1950-80 | 1,165,190 | 1,092,721 | 21.2 | < 0.0001 | Decreasing |
| Costa Rica | 1955-95 | 1,399,975 | 1,336,144 | 0.2 | 0.621 | ns |
| Panama | 1957-87 | 804,604 | 771,563 | 9.4 | 0.002 | Increasing |
| Columbia | 1955-86 | 804,604 | 771,563 | 9.4 | 0.002 | Increasing |
| Venezuela | 1950-94 | 8,935,021 | 8,569,753 | 0.6 | 0.430 | ns |
| Suriname | 1971-90 | 66,136 | 63,900 | 0.6 | 0.427 | ns |
| Ecuador | 1958-91 | 3,426,138 | 3,321,029 | 0.3 | 0.599 | ns |
| Peru | 1958-83 | 6,091,806 | 5,810,754 | 1143.1 | < 0.0001 | Decreasing |
| Brazil | 1979-95 | 20,287,666 | 19,433,053 | 1.6 | 0.210 | ns |
| >20° S | Years | Total males | Total females | chi | P | M/F |
|---|---|---|---|---|---|---|
| Paraguay | 1979-80 | 378,698 | 351,387 | 2.8 | 0.096 | ns |
| Uruguay | 1950-85 | 1,080,347 | 1,042,270 | 1.2 | 0.265 | ns |
| Chile | 1955-94 | 5,612,609 | 5,385,378 | 0.4 | 0.515 | ns |
| Argentina | 1955-96 | 12,741,429 | 12,200,047 | 5.7 | 0.017 | Increasing |
M/F, male births divided by total births; NS, not significant.
South America may be divided into an area that spans from Honduras at circa 10° above the equator to 20° below the Equator, and a second area 20° below the Equator and further south (Table 1). Thus, only small parts of Bolivia and Brazil extend south and only small parts of Chile and Paraguay extend north of this arbitrary division.
StatisticsExcel was used for data entry, overall analysis, Pearson correlations and charting. The quadratic equations of Fleiss were used for exact calculation of 95% confidence intervals for ratios.6 Chi-squared tests and chi-squared tests for trends for male and female births were used throughout. The latter were applied using the Bio-Med-Stat Excel add-in for contingency tables. This add-in is based on the original work on this subject which led to the development of the Cochran-Armitage test (Dr. Peter Slezák, Institute of Normal and Pathological Physiology, Slovak Academy of Sciences, personal communication). A p-value ≤ 0.05 was considered significant.
ResultsThis study analysed 147,773,689 live births. There have been significant increases and also decreases in M/F in different countries (Table 1). Significant trends were present mostly in countries closer to the equator. No discernable pattern was noted in that trends were sometimes opposed in neighboring countries.
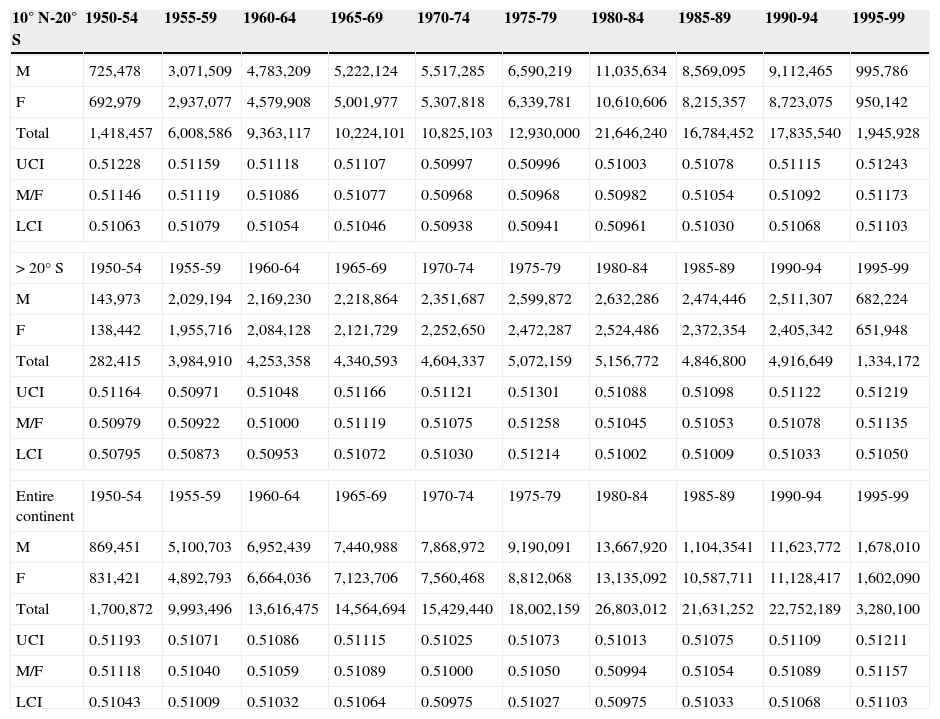
Countries were grouped as described in Table 1 (above and below 20° latitude), and five-year trends for live births are shown in Table 2.
5 year total live births. Countries allocated as per Table 1.
| 10° N-20° S | 1950-54 | 1955-59 | 1960-64 | 1965-69 | 1970-74 | 1975-79 | 1980-84 | 1985-89 | 1990-94 | 1995-99 |
|---|---|---|---|---|---|---|---|---|---|---|
| M | 725,478 | 3,071,509 | 4,783,209 | 5,222,124 | 5,517,285 | 6,590,219 | 11,035,634 | 8,569,095 | 9,112,465 | 995,786 |
| F | 692,979 | 2,937,077 | 4,579,908 | 5,001,977 | 5,307,818 | 6,339,781 | 10,610,606 | 8,215,357 | 8,723,075 | 950,142 |
| Total | 1,418,457 | 6,008,586 | 9,363,117 | 10,224,101 | 10,825,103 | 12,930,000 | 21,646,240 | 16,784,452 | 17,835,540 | 1,945,928 |
| UCI | 0.51228 | 0.51159 | 0.51118 | 0.51107 | 0.50997 | 0.50996 | 0.51003 | 0.51078 | 0.51115 | 0.51243 |
| M/F | 0.51146 | 0.51119 | 0.51086 | 0.51077 | 0.50968 | 0.50968 | 0.50982 | 0.51054 | 0.51092 | 0.51173 |
| LCI | 0.51063 | 0.51079 | 0.51054 | 0.51046 | 0.50938 | 0.50941 | 0.50961 | 0.51030 | 0.51068 | 0.51103 |
| > 20° S | 1950-54 | 1955-59 | 1960-64 | 1965-69 | 1970-74 | 1975-79 | 1980-84 | 1985-89 | 1990-94 | 1995-99 |
| M | 143,973 | 2,029,194 | 2,169,230 | 2,218,864 | 2,351,687 | 2,599,872 | 2,632,286 | 2,474,446 | 2,511,307 | 682,224 |
| F | 138,442 | 1,955,716 | 2,084,128 | 2,121,729 | 2,252,650 | 2,472,287 | 2,524,486 | 2,372,354 | 2,405,342 | 651,948 |
| Total | 282,415 | 3,984,910 | 4,253,358 | 4,340,593 | 4,604,337 | 5,072,159 | 5,156,772 | 4,846,800 | 4,916,649 | 1,334,172 |
| UCI | 0.51164 | 0.50971 | 0.51048 | 0.51166 | 0.51121 | 0.51301 | 0.51088 | 0.51098 | 0.51122 | 0.51219 |
| M/F | 0.50979 | 0.50922 | 0.51000 | 0.51119 | 0.51075 | 0.51258 | 0.51045 | 0.51053 | 0.51078 | 0.51135 |
| LCI | 0.50795 | 0.50873 | 0.50953 | 0.51072 | 0.51030 | 0.51214 | 0.51002 | 0.51009 | 0.51033 | 0.51050 |
| Entire continent | 1950-54 | 1955-59 | 1960-64 | 1965-69 | 1970-74 | 1975-79 | 1980-84 | 1985-89 | 1990-94 | 1995-99 |
| M | 869,451 | 5,100,703 | 6,952,439 | 7,440,988 | 7,868,972 | 9,190,091 | 13,667,920 | 1,104,3541 | 11,623,772 | 1,678,010 |
| F | 831,421 | 4,892,793 | 6,664,036 | 7,123,706 | 7,560,468 | 8,812,068 | 13,135,092 | 10,587,711 | 11,128,417 | 1,602,090 |
| Total | 1,700,872 | 9,993,496 | 13,616,475 | 14,564,694 | 15,429,440 | 18,002,159 | 26,803,012 | 21,631,252 | 22,752,189 | 3,280,100 |
| UCI | 0.51193 | 0.51071 | 0.51086 | 0.51115 | 0.51025 | 0.51073 | 0.51013 | 0.51075 | 0.51109 | 0.51211 |
| M/F | 0.51118 | 0.51040 | 0.51059 | 0.51089 | 0.51000 | 0.51050 | 0.50994 | 0.51054 | 0.51089 | 0.51157 |
| LCI | 0.51043 | 0.51009 | 0.51032 | 0.51064 | 0.50975 | 0.51027 | 0.50975 | 0.51033 | 0.51068 | 0.51103 |
F, female; LCI, lower confidence interval; M, male; M/F, male births divided by total births; UCI, upper confidence interval.
For the region 10° N-20° S (top part of table) data was available for some (but not all countries) up to 1995, and hence, the absolute values for male, female and total births are smaller for the last 3 columns for this region in Table 2. For the region >20° S, data was only available for some countries (not all) up to 1996. Hence, the last two columns are blank and for the last column with data, the male, female and total births are smaller for the last column for this region in Table 2.
An increasing trend in M/F was found for the region >20° (r=0.3, chi=24, p<0.0001) for the entire period. Overall, for the aggregate (the entire continent), a significant decrease was present for the period 1950-74 (r=-0.3, chi=5.9, p=0.01) followed by a significant increase thereafter (r=0.5, chi=60, p<0.001).
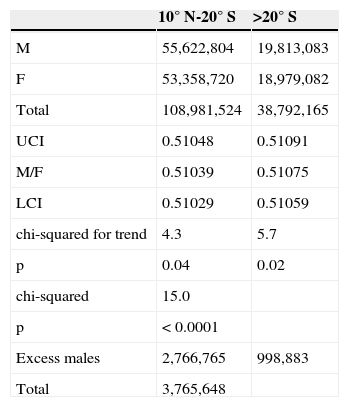
A comparison of totals for the two areas also showed a latitude gradient, with more males being born in cooler (more Southern, > 20° S) latitudes (p<0.0001 [Table 3]).
Summary statistics and significance testing.
| 10° N-20° S | >20° S | |
|---|---|---|
| M | 55,622,804 | 19,813,083 |
| F | 53,358,720 | 18,979,082 |
| Total | 108,981,524 | 38,792,165 |
| UCI | 0.51048 | 0.51091 |
| M/F | 0.51039 | 0.51075 |
| LCI | 0.51029 | 0.51059 |
| chi-squared for trend | 4.3 | 5.7 |
| p | 0.04 | 0.02 |
| chi-squared | 15.0 | |
| p | < 0.0001 | |
| Excess males | 2,766,765 | 998,883 |
| Total | 3,765,648 |
Countries allocated to the above two regions as per Table 1.
F, female; LCI, lower confidence interval; M, male; M/F, male births divided by total births; UCI, upper confidence interval.
The male births in excess of that which would be anticipated based on an M/F of 0.515 were calculated (using simple proportion) at 3,765,648 (Table 3).
DiscussionStudies that analysed data prior to 1950 observed generally increasing trends in M/F. For example, it was demonstrated that M/F was rising in Scandinavia before 1950, and decreased thereafter.7 This was notably true in Finland, with a rise in M/F from 1751 to 1948, and in Denmark.8,9
A declining M/F has been observed in many industrialized countries since 1950, since the more fragile male fetus may be spontaneously aborted at a higher rate than the more robust female fetus when exposed to hypothetical deleterious environmental factors.10
Adverse environmental factors or traumatic experiences that affect entire populations have both been shown to lower M/F. For example, M/F declines after warfare,11 earthquakes,12 and a multiplicity of environmental disasters.13 It appears that such events promote stressed pregnant women to spontaneously abort male fetuses to a greater extent than female fetuses.14 M/F has been proposed as a potential surrogate sentinel health indicator.15
Despite these adverse factors, males are invariably born in excess of females,16 implying an even higher conception rate of males.
A study in Europe has shown a higher incidence of male births in southern Europe, which is warmer, than in northern Europe.4 However, a study over a longer time span that also incorporated the North American continent not only did not confirm the European trend, but also demonstrated that more males are born in the higher and cooler latitudes of the Northern American continent than in the southern parts of that continent.2
The South American data presented in this study is in accordance with the latitude gradient described in North America, and contrary to the latitude gradient observed in Europe.2 Moreover, in contrast with North America and Europe, M/F is increasing in South America.5 A simple calculation shows that, for the available years, there was a male birth rate in excess of the anticipated M/F of 0.515, resulting in a female birth deficit of at least 3,765,648.
Various hypotheses have been elaborated to explain observed trends in M/F but with the available data, it is not possible to ascertain what factor/s have contributed to these findings These include, on the one hand, differing secular trends in M/F when comparing Europe and North America with South America, and on the other hand, latitude gradient differences in M/F that are in agreement in the Americas but display an opposite trend in Europe. Several poorly understood factors may be interacting.
Conflicts of interestThe author declares no conflicts of interest.
Dr. Mie Inoue and Dr. Gauden Galea from the World Health Organization.
Please cite this article as: Grech V. Secular trends in sex ratios at birth in South America over the second half of the 20th century. J Pediatr (Rio J). 2013;89:505–9.


