

To analyze the risk factors for neonatal death in Florianópolis, the Brazilian city capital with the lowest infant mortality rate.
MethodData were extracted from a historical cohort with 15,879 live births. A model was used that included socioeconomic, behavioral, and health service use risk factors, as well as the Apgar score and biological factors. Risk factors were analyzed by hierarchical logistic regression.
ResultsBased on the multivariate analysis, socioeconomic factors showed no association with death. Insufficient prenatal consultations showed an OR of 3.25 (95% CI: 1.70–6.48) for death. Low birth weight (OR 8.42; 95% CI: 3.45–21.93); prematurity (OR 5.40; 95% CI: 2.22–13.88); malformations (OR 4.42; 95% CI: 1.37–12.43); and low Apgar score at the first (OR 6.65; 95% CI: 3.36–12.94) and at the fifth (OR 19.78; 95% CI: 9.12–44.50) minutes, were associated with death.
ConclusionDiffering from other studies, socioeconomic conditions were not associated with neonatal death. Insufficient prenatal consultations, low Apgar score, prematurity, low birth weight, and malformations showed an association, reinforcing the importance of prenatal access universalization and its integration with medium and high-complexity neonatal care services.
Analisar os fatores de risco para o óbito neonatal em Florianópolis, capital brasileira com a menor taxa de mortalidade infantil.
MétodoOs dados foram extraídos de coorte histórica, contando com 15.879 nascidos vivos. Utilizou-se modelo ordenando fatores de risco socioeconômicos, comportamentais e de utilização dos serviços de saúde, além do escore de Apgar e de fatores biológicos. Os fatores de risco foram analisados por regressão logística hierarquizada.
ResultadosCom base na análise multivariada, os fatores socioeconômicos não mostraram associação com o óbito. Consultas pré-natais insuficiente apresentaram um OR 3,25 (IC95% 1,70–6,48) para óbito. Baixo peso ao nascer (OR 8,42; IC95% 3,45–21,93); prematuridade (OR 5,40; IC95% 2,22–13,88); malformações (OR 4,42; IC95% 1,37–12,43); baixo escore de Apgar no 1o (OR 6,65; IC95% 3,36-12,94) e no 5o (OR 19,78; IC95% 9,12–44,50) minutos, associaram-se ao óbito.
ConclusãoDiferente de outros estudos, as condições socioeconômicas não se associaram ao óbito neonatal. Pré-natal insuficiente, baixo escore de Apgar, prematuridade, baixo peso e malformações mostraram associação, reforçando a importância da universalização do acesso ao pré-natal e da integração deste com serviços de atenção ao recém-nascido, de média e alta complexidade.
The infant mortality rate is used to assess the quality of life of a population and the health care of their children. Infant deaths are associated with a wide range of socioeconomic, behavioral, and biological risk factors.1–3 To evaluate these factors in an integrated way, in 1984 Mosley and Chen3 proposed a hierarchical model based on the hypothesis that socioeconomic factors determine behaviors, which, in turn, have an impact on a set of biological factors. According to their model, biological factors are those directly responsible for death. The hierarchical model brings a great advance to the development of public policies, since information coming from studies that are limited to only a group of risk factors result in inadequate recommendations to assess the deaths among children, as they presents a limited vision of the phenomenon.3 For instance, studies that encompass only behavioral risk factors can make it difficult to contextualize these behaviors. Thus, when addressing the low demand for prenatal consultations or vaccines, it is crucial to understand the socioeconomic conditions of the studied individuals, being clear that actions directed at a population with high level of schooling and easy access to health services should be different from those directed at individuals with a low educational level and few available health services.
Infant mortality has shown a substantial decrease worldwide, which has been attributed to progress in social and environmental conditions and health services observed in recent years.1,4 This decrease has been mainly due to the decrease in its post-neonatal component.5,6 Neonatal deaths, however, have not responded in the same way to the abovementioned improvements, and still present a great challenge for developing nations, such as Brazil.1,4
In Brazil, since the enactment of the Federal Constitution of 1988, a large part of the burden of coping with neonatal mortality has been imposed on municipalities, which have taken on a prominent position in the implementation of public health policies.7,8
Florianópolis, the capital city of the state of Santa Catarina, located in southern Brazil, has the highest Municipal Human Development Index (HDI-M) among all Brazilian capitals.9 The municipality, with 477,798 inhabitants,10 also has the lowest infant mortality rate,9 which was 5.34 per 1000 live births in 2016.11
Information produced in this context and using a model that integrates risk factors with a hierarchical model can help to achieve a broad comprehension of the phenomenon. This is crucial to develop public policies by the municipality itself and by other Brazilian cities, in the scenario of administrative and tax decentralization experienced by the country.12 Moreover, it can also provide information to policies in cities located in other developing countries, and to the states and the Brazilian federal setting, contributing to the prevention of infant deaths in the neonatal period. Thus, the present study aimed to analyze the risk factors for neonatal death in the capital city of Santa Catarina.
MethodsArea and study populationThe study was carried out based on a historical cohort of live births, developed as part of the epidemiological surveillance activities of the Municipal Health Secretariat in 2016. It was carried out through the data analysis of children born in the municipality between 01/01/2012 and 12/31/2014, extracted from the Live Births Information System (Sistema de Informação sobre Nascidos Vivos [SINASC]) and those who died between 01/01/2012 and 12/31/2015, collected from the Mortality Information System (Sistema de Informação sobre Mortalidade [SIM]). The cohort considered all live births whose birth certificate (BC) was linked to the respective death certificate (DC) within a period shorter than 365 days, assuming no migration or loss of observation during the considered period.
From this cohort, children were selected from mothers living in the municipality, with 15,879 live births identified. Neonatal deaths were all those that occurred in children younger than 28 days.
Study model and variablesThe hierarchical conceptual model of Mosley & Chen3 was adapted, according to Fig. 1. Risk factors were dichotomized and then organized into three dimensions, the most distal one consisting of socioeconomic risk factors; the intermediate, consisting of behavioral factors and the use of health services; and the proximal, consisting of the Apgar score and biological risk factors.

Hierarchical model for the evaluation of neonatal death risk factors, adapted from Mosley & Chen.3
Among the risk factors that constitute the distal dimension, the authors assessed maternal schooling, considering a high level of schooling as the completion of 11 or more years of study; and the marital status, divided between mothers who had partners, that is, those married or in stable union, and mothers without partners.
The second dimension is related to behavioral risk factors and the use of health services. In this study, prenatal consultations were assessed; seven or more consultations were considered as sufficient prenatal care and six or fewer, as insufficient; the maternity units where the deliveries were performed were classified as units belonging to the Brazilian Unified Health System or private services; the type of birth was classified as vaginal birth or C-section.
The Apgar score and biological risk factors comprised the third and final dimension, the proximal one. Apgar scores at the 1st and 5th minutes of life were classified as high if greater than or equal to 7, and low if less than this value. Birth weight was considered low if less than 2500g, and the child was classified as preterm if the pregnancy lasted less than 37 weeks. The other factors that comprised this dimension were: gender; presence of malformation; type of pregnancy, whether single or multiple; and maternal age, divided into mothers aged 35 or older and women younger than this age.
Data analysisInitially, descriptive statistical analysis of the risk factors was performed, with their absolute and relative frequencies being presented. Then, bivariate analyses were performed, between the outcome and each of the risk factors. The chi-squared test and Fisher's exact test were used at this step. Factors with p≤0.25 were maintained for the multivariate regression, as recommended by Hosmer and Lemeshow.12
The outcome variable is dichotomous; thus, the logistic regression was chosen as the multivariate statistical method. The regression was performed in steps, with the risk factors of each of the dimensions being included in block. All the risk factors from one dimension that showed p≤0.25 in the bivariate analysis were included at once. It started with the distal dimension, and the risk factorsthat presented p≤0.05 after being included in block were maintained in the next step. The intermediate dimension risk factors were added to these, and the process was repeated. Finally, the process was performed once again with the proximal dimension risk factors.
Hosmer & Lemeshow's pseudo-r2 was calculated for the final model, and the existence of multicollinearity was assessed by means of the variance inflation factor (VIF) and the tolerance test (1/VIF) among the risk factors that constituted it. Additionally, the odds ratio (OR) and the respective 95% confidence intervals were computed. All analyses were performed using the statistical software R v. 3.3.2 (R Project for Statistical Computing, Stanford University, USA),13 and R-Studio, v. 1.0.4 (R Project for Statistical Computing, Stanford University, CA, USA).14
Ethical considerationsThis study was submitted to the Research Ethics Committee of Universidade do Sul de Santa Catarina (UNISUL), approved under CAAE No. 62237716.8.0000.
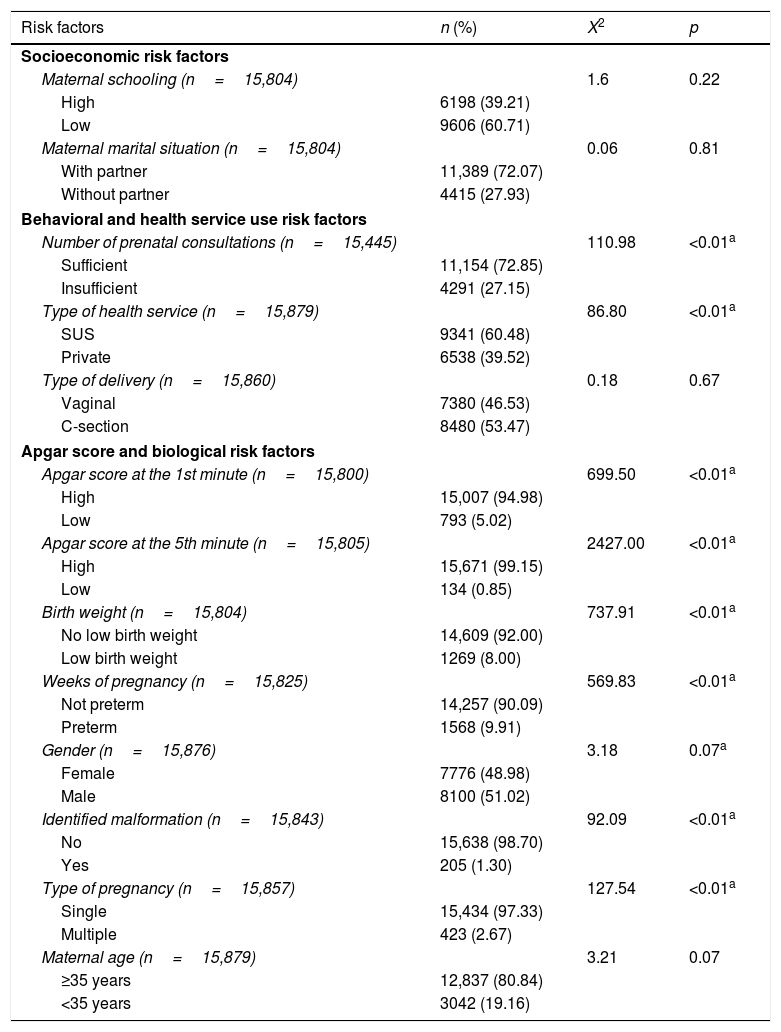
ResultsA total of 86 neonatal deaths were identified among 15,879 children. Therefore, the neonatal mortality rate in the sample was 5.4 per 1000 live births. Descriptions of the absolute and relative frequency of risk factors and the bivariate analysis are shown in Table 1.
Distribution of risk factors and bivariate analysis. Florianópolis, SC, Brazil.
| Risk factors | n (%) | X2 | p |
|---|---|---|---|
| Socioeconomic risk factors | |||
| Maternal schooling (n=15,804) | 1.6 | 0.22 | |
| High | 6198 (39.21) | ||
| Low | 9606 (60.71) | ||
| Maternal marital situation (n=15,804) | 0.06 | 0.81 | |
| With partner | 11,389 (72.07) | ||
| Without partner | 4415 (27.93) | ||
| Behavioral and health service use risk factors | |||
| Number of prenatal consultations (n=15,445) | 110.98 | <0.01a | |
| Sufficient | 11,154 (72.85) | ||
| Insufficient | 4291 (27.15) | ||
| Type of health service (n=15,879) | 86.80 | <0.01a | |
| SUS | 9341 (60.48) | ||
| Private | 6538 (39.52) | ||
| Type of delivery (n=15,860) | 0.18 | 0.67 | |
| Vaginal | 7380 (46.53) | ||
| C-section | 8480 (53.47) | ||
| Apgar score and biological risk factors | |||
| Apgar score at the 1st minute (n=15,800) | 699.50 | <0.01a | |
| High | 15,007 (94.98) | ||
| Low | 793 (5.02) | ||
| Apgar score at the 5th minute (n=15,805) | 2427.00 | <0.01a | |
| High | 15,671 (99.15) | ||
| Low | 134 (0.85) | ||
| Birth weight (n=15,804) | 737.91 | <0.01a | |
| No low birth weight | 14,609 (92.00) | ||
| Low birth weight | 1269 (8.00) | ||
| Weeks of pregnancy (n=15,825) | 569.83 | <0.01a | |
| Not preterm | 14,257 (90.09) | ||
| Preterm | 1568 (9.91) | ||
| Gender (n=15,876) | 3.18 | 0.07a | |
| Female | 7776 (48.98) | ||
| Male | 8100 (51.02) | ||
| Identified malformation (n=15,843) | 92.09 | <0.01a | |
| No | 15,638 (98.70) | ||
| Yes | 205 (1.30) | ||
| Type of pregnancy (n=15,857) | 127.54 | <0.01a | |
| Single | 15,434 (97.33) | ||
| Multiple | 423 (2.67) | ||
| Maternal age (n=15,879) | 3.21 | 0.07 | |
| ≥35 years | 12,837 (80.84) | ||
| <35 years | 3042 (19.16) | ||
X2, chi-squared test; p, probability; SUS, Brazilian Unified Health System.
In the bivariate analysis of the socioeconomic dimension risk factors, statistically significant results were observed only for maternal schooling. Thus, this factor was maintained for the next step.
Therefore, the second step of the regression comprised the inclusion of two risk factors from the intermediate dimension, the number of prenatal consultations and the type of maternity unit, which showed p≤0.25 in the bivariate analysis. After this step was performed, maternal schooling and type of maternity unit showed p≥0.05 and were withdrawn from the model. In the third step, the Apgar score at the 1st and 5th minutes, in addition to birth weight, weeks of gestation, gender, identified malformations, type of pregnancy, and maternal age were added to the number of prenatal consultations. After this phase, all factors showed a statistically significant association with the outcome, except for gender, type of pregnancy, and maternal age, which were removed from the final model. VIFs were below 10 and the 1/VIF above 0.1, indicating the absence of strong multicolinearity,15 and Hosmer & Lemeshow's pseudo-r2 of the final model was 0.56.
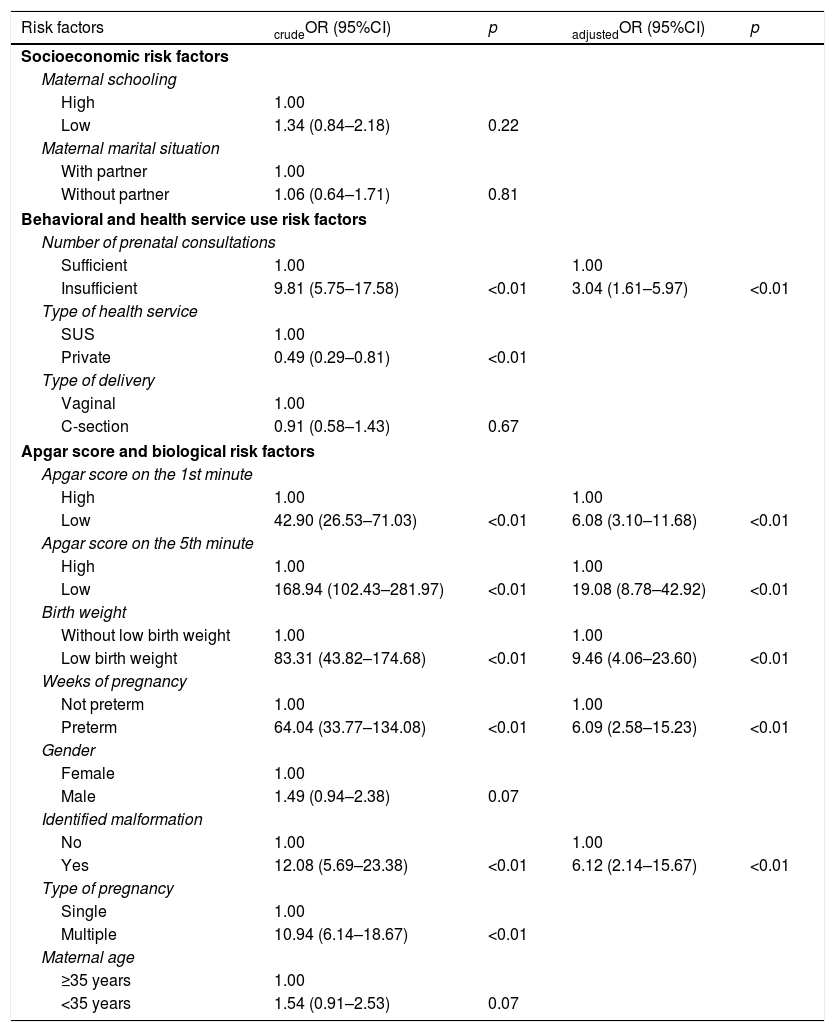
According to the final model, children whose mothers had an insufficient number of prenatal consultations, i.e., fewer than seven visits, had a three-fold higher chance of neonatal death (OR 3.04; 95% CI: 1.61–5.97) compared to those whose mothers had seven or more consultations (Table 2).
Multivariate analysis of risk factors for neonatal death in Florianópolis, SC, Brazil.
| Risk factors | crudeOR (95%CI) | p | adjustedOR (95%CI) | p |
|---|---|---|---|---|
| Socioeconomic risk factors | ||||
| Maternal schooling | ||||
| High | 1.00 | |||
| Low | 1.34 (0.84–2.18) | 0.22 | ||
| Maternal marital situation | ||||
| With partner | 1.00 | |||
| Without partner | 1.06 (0.64–1.71) | 0.81 | ||
| Behavioral and health service use risk factors | ||||
| Number of prenatal consultations | ||||
| Sufficient | 1.00 | 1.00 | ||
| Insufficient | 9.81 (5.75–17.58) | <0.01 | 3.04 (1.61–5.97) | <0.01 |
| Type of health service | ||||
| SUS | 1.00 | |||
| Private | 0.49 (0.29–0.81) | <0.01 | ||
| Type of delivery | ||||
| Vaginal | 1.00 | |||
| C-section | 0.91 (0.58–1.43) | 0.67 | ||
| Apgar score and biological risk factors | ||||
| Apgar score on the 1st minute | ||||
| High | 1.00 | 1.00 | ||
| Low | 42.90 (26.53–71.03) | <0.01 | 6.08 (3.10–11.68) | <0.01 |
| Apgar score on the 5th minute | ||||
| High | 1.00 | 1.00 | ||
| Low | 168.94 (102.43–281.97) | <0.01 | 19.08 (8.78–42.92) | <0.01 |
| Birth weight | ||||
| Without low birth weight | 1.00 | 1.00 | ||
| Low birth weight | 83.31 (43.82–174.68) | <0.01 | 9.46 (4.06–23.60) | <0.01 |
| Weeks of pregnancy | ||||
| Not preterm | 1.00 | 1.00 | ||
| Preterm | 64.04 (33.77–134.08) | <0.01 | 6.09 (2.58–15.23) | <0.01 |
| Gender | ||||
| Female | 1.00 | |||
| Male | 1.49 (0.94–2.38) | 0.07 | ||
| Identified malformation | ||||
| No | 1.00 | 1.00 | ||
| Yes | 12.08 (5.69–23.38) | <0.01 | 6.12 (2.14–15.67) | <0.01 |
| Type of pregnancy | ||||
| Single | 1.00 | |||
| Multiple | 10.94 (6.14–18.67) | <0.01 | ||
| Maternal age | ||||
| ≥35 years | 1.00 | |||
| <35 years | 1.54 (0.91–2.53) | 0.07 | ||
.crudeOR, odds ratio of bivariate analysis; adjustedOR, odds ratio of multivariate analysis; SUS, Brazilian Unified Health System.
Also, according to the model, neonates with Apgar score in the first minute below 7 had an OR of 6.08 (95% CI: 3.10–11.68) for neonatal death, when compared to those with a higher Apgar score. A low Apgar score at the 5th minute was the factor with the greatest magnitude of association with neonatal death, with an OR of 19.08 (95% CI: 8.78–42.92).
Several biological risk factors were also associated with neonatal death in Florianópolis, after the multivariate analysis. Low birth weight showed an OR of 9.46 (95% CI: 4.06–23.60) and prematurity, an OR of 6.09 (95% CI: 2.58–15.23). Children with identified malformations had an odds ratio of six (OR: 6.12, 95% CI: 2.14–15.67), compared to their peers without malformations (Table 2).
DiscussionThe analysis of the risk factors for neonatal death at the local level is essential so that the Brazilian municipalities can, in partnership with states and the federal government, develop public policies adapted to each reality.
Florianópolis has a favorable context for the development of knowledge in this area, since it has the lowest infant mortality rate among Brazilian capitals.11,16 However, a search for studies that analyzed risk factors for neonatal death in Florianópolis performed in the PubMed, SciELO, Web of Science, Scopus, and LILACS databases did not show any articles.
Therefore, based on the use of a hierarchical model, it was possible to jointly and systematically analyze socioeconomic risk factors, as well as those related to behavioral risk factors and the use of health services, Apgar score, and biological factors. Some peculiarities were demonstrated in the capital of Santa Catarina and may foster policy changes at the federal level, while other findings corroborate results already shown in the literature, as reported below.
Socioeconomic risk factors, based on maternal schooling, are commonly associated with neonatal mortality.3,17,18 A high level of maternal education can increase the child survival rate by promoting knowledge about effective ways to prevent, recognize, and treat childhood illnesses.19 A national, hospital-based cohort on neonatal mortality, using hierarchical modeling, found a four-fold higher chance of death in neonates of mothers with low level of schooling,20 similar to that found by Borges and Vayego18 in the metropolitan region of Curitiba. In Florianópolis, low schooling did not show such an association; some hypotheses can be suggested as causal for this, among them a possible protection generated by good educational levels attained in the municipality, where 80.03% of the population older than 18 years old has at least finished elementary school. This is the best result among all Brazilian municipalities.9 This hypothesis needs to be adequately tested.
Regarding the behavioral risk factors and the use of health services, the insufficient number of prenatal consultations showed a significant increase in the chance of neonatal death. Those born in Florianópolis, whose mothers had less than seven prenatal consultations, had a three-fold higher risk of death than those whose mothers had more consultations. That indicates that, despite the good coverage and quality of primary care in the municipality, access problems still exist. Florianópolis has 100% coverage by the Family Health Strategy, and 90% of its teams were evaluated as above average or well above the average for their stratum in the Program for Improving Primary Care Access and Quality (Programa de Melhoria do Acesso e da Qualidade na Atenção Primária [PMAQ]).21
Nonetheless, 27% of the mothers of children assessed in this study had less than seven prenatal consultations. The identification of women of childbearing age treated in the health systems allows the diagnosis of situational groups more likely to develop potential complications during pregnancy. This diagnosis favors individualized prenatal planning and organization, especially important for those with gestational risk factors.20 From this perspective, the earlier the detection of gestation and the greater the number of prenatal visits, the lower the chance of neonatal death.22–24
Low Apgar scores also showed a strong association with neonatal deaths in this study. The Apgar score represents the newborn's state of vitality and is directly related to the quality of childbirth care, representing a universally accepted method for reporting the child's condition immediately after birth. The low Apgar score at the 5th minute showed the highest magnitude of association among all analyzed factors, corroborating findings from other studies.20,25
The association between biological risk factors and death in the first 28 days of life has also been described by other authors.18,20,24,26 Approximately one-quarter (28%) of all children worldwide are born with low birth weight27 and roughly 60–80% of all neonatal deaths are associated with this factor.28 In Florianópolis, low birth weight was associated with an approximately nine-fold chance of neonatal death. A study carried out by Oliveira29 showed that the lowest rates of low birth weight among Brazilian states were concentrated in the southern states, such as Santa Catarina, and in the Southeast, concluding that the availability of health services and their use by the population were determinant for this result.
Prematurity is considered one of the most important gestational problems and one of the main risk factors for neonatal death.18,20,23,25 Gaiva et al.,24 for instance, found a risk of death in the neonatal period that was approximately three-fold higher among preterm infants. In Florianópolis, the chance of neonatal death was six-fold higher in children with gestational age less than 37 weeks.
In contrast to what occurs with low birth weight, there is a higher proportion of deaths associated with congenital malformations in the southern and southeastern regions of Brazil (42%) when compared to other regions of the country.20 In this study, the proportion was much lower than that, 1.3%. Nevertheless, there was a four-fold increase in neonatal death in infants diagnosed with some type of congenital malformation in Florianópolis. This information is relevant, because some congenital genetic, infectious, or environmental-related anomalies can be prevented through the implementation of public policies and an adequate offer of health services.30
The present study showed a number of positive points, including the use of already-consolidated national bases and a hierarchical model, which allowed an integrated analysis of socioeconomic, behavioral, and health risk factors, the Apgar score, and biological risk factors, which may support the development of more comprehensive and contextualized public policies. Despite the possible contributions brought on by the results shown here, it is important to observe that the explanatory power of the constructed model, evaluated by Hosmer & Lemeshow's pseudo-r,2 is a moderate one. Therefore, there is still a considerable part of the phenomenon that could not be analyzed by the variables extracted from the SINASC. One possibility to improve the capacity to assess risk factors for neonatal death is to aggregate data from the Maternal, Child, and Fetal Death Prevention Committees, which include other risk factors such as maternal smoking and the presence of gestational diseases.
Another limitation that should be considered is the small cohort period, only three years, which associated with the low mortality of the municipality resulted in a small number of deaths in the study population. The increase of the study period in future research might disclose an association between some risk factors that were not statistically significant here and neonatal death.
Pragmatically, the data shown here indicate that some points regarding primary care in the country need to be reconsidered. Florianópolis is the capital with the highest primary care coverage and quality, according to analysis of the Brazilian Ministry of Health. However, 27% of the mothers in the city did not have sufficient prenatal consultations, with a negative impact on neonatal deaths. That shows that both the parameters for calculating coverage and the quality assessment used by the federal government need to be improved. It is essential to analyze the possibility of reducing the number of teams per inhabitant and to review the quality assessment model so that it considers access to certain programmatic actions with good evidence, such as sufficient prenatal care.
Conflicts of interestThe authors declare no conflicts of interest.
The authors thank the Municipal Health Secretariat of Florianópolis for the data availability of the Live Birth Cohort. The author Leandro Pereira Garcia receives a PhD scholarship from PROSUP/CAPES and would also like to thank Coordenação de Aperfeiçoamento de Pessoal de Nível Superior – CAPES.
Please cite this article as: Garcia LP, Fernandes CM, Traebert J. Risk factors for neonatal death in the capital city with the lowest infant mortality rate in Brazil. J Pediatr (Rio J). 2018. https://doi.org/10.1016/j.jped.2017.12.007
Study carried out at Universidade do Sul de Santa Catarina, Palhoça, SC, Brazil.


