

To analyze the psychometric properties of the Child Development Assessment Questionnaire (QAD-PIPAS).
MethodsThis methodological study was comprised of two axes. The first one aimed to analyze the instrument's construct validity (discriminant and concurrent validity) and internal consistency, and the second one examined test-retest reliability, involving two different samples and procedures. For construct validity and internal consistency, the sample was recruited in Embu das Artes-SP, Brasilia-DF and Recife-PE during the immunization campaign in 2017, involving caregivers of 2005 children under 60 months of age (1295 under 36 and 710 from 37 to 59 months). For the test-retest analysis the sample consisted of 30 children aged 0–59 months old that attended daycare centers in Embu das Artes-SP in 2018.
ResultsMultivariate analyses of construct validity showed that the QAD-PIPAS was able to identify the association between the outcome (suspected child development delays) and expected risk and protective factors based on Nurturing Care Framework (OMS/UNICEF). A significant positive correlation was achieved between the scores of the QAD-PIPAS and CREDI in six of the eight age groups analyzed, with the most significant correlations being in the age groups from 25 to 30 and 31–36 months. Acceptable internal consistencies were identified in all age groups, with better performance above 36 months of age (Cronbach’s alpha between 0.61 to 0.80). We also found an adequate test-retest reliability (global Kappa 0.81).
ConclusionThe QAD-PIPAS showed evidence of construct validity and reliability to be used in population studies involving children aged 0–59 months during multi-vaccination campaigns in Brazil.
The first years of life are essential to lay the groundwork for lifelong development.1–3
However, an estimated 250 million children under five years of age worldwide will not reach their developmental potential due to poverty and stunting, in addition to their exposure to violence, abuse, neglect, or abandonment.4,5
The Sustainable Development Goals (SDGs) prioritize early childhood development (ECD) by recommending access to care and timely learning for young children. As a result, ECD interventions have increased, especially in low- and middle-income countries, which concentrate most of the disadvantaged children.6 Brazil has increased investment in ECD programs, such as the Criança Feliz, a home visiting program that has reached about 2000 Brazilian municipalities.7 However, the formulation, improvement, and monitoring of these interventions depends on consistent evaluation of needs and outcomes related to ECD, using culturally appropriate measures.5,8,9
Some tools have been developed for monitoring ECD at the populational level and large-scale in the last years, highlighting the role of international agencies such as UNICEF, the World Health Organization (WHO), and the Inter-American Bank. UNICEF has recently published the Early Childhood Development Index (ECDI2030)10 to determine whether children aged 24–59 months are developmentally on track in health, learning, and psychosocial well-being, based on 20 questions; the Regional Project on Child Development Indicators (PRIDI)11 is an initiative launched by the Inter-American Development Bank and consists in a direct assessment tool of children aged 24–59 months, including 21 items for capturing cognition, communication, language, socioemotional, and motor development;the Caregiver Reported Early Development Index (CREDI)8,12 is a population-level measure for assessing the overall development of children aged 0–35 months across the motor, language, cognition, socioemotional, and mental health domains based on the child’s primary caregiver report. An ongoing initiative under the WHO leadership, called The Global Scale for Early Development (GSED), aims to provide an instrument that can assess child development across different contexts.13 Despite the efforts of international agencies to develop an instrument that allows comparable measurement of child development at a global level, no consensus exists on the best instrument for population studies.
Due to the successful Brazilian experience of conducting rapid and low-cost surveys in vaccination campaigns,14 the scarcity of data on ECD in population studies in Brazil and the non-availability of an open-access test, based on caregivers’ report, to assess the development of children aged 0–59 months, the PIPAS Project (Early Childhood for Healthy Adults) created an easy and quick to administer instrument (QAD-PIPAS), to be applied in multi-vaccination campaigns. The great advantage of creating a new test is that it can be tailored to the local context. Nevertheless, any new test development requires reliability and validity assessments before being applied in the field.6 This article aims to analyze the Child Development Assessment Questionnaire’s (QAD-PIPAS) psychometric properties, focusing on reliability and construct validity, for population-level studies involving Brazilian children aged 0–59 months.
MethodsThis methodological study was comprised of two axes, involving two different samples and procedures. The first aimed to analyze the instrument's construct validity (discriminant and concurrent validity) and internal consistency. The second axis examined test-retest reliability.
The following psychometric properties6,15,16 were examined: 1) Discriminant validity: checks whether test scores are associated with factors that are expected to be related to them; 2) Concurrent validity: analyses the extent to which the results of a particular test or measurement tool correlate with results of a previously established measurement of the same construct measured at the same time; 3) Internal consistency: assesses how well the instrument items work individually and together, and 4) Test-retest reliability: refers to how consistently a measure produces similar results for a group of children with repeated measurements over a short period of time.
Study samples and recruitment proceduresThe study included two samples. The first one was recruited on September 16th during the 2017 national multi-vaccination campaign in 44 Basic Health Units from three Brazilian regions: Embu das Artes (São Paulo) in the Southeast, Recife (Pernambuco) in the Northeast and Distrito Federal (Distrito Federal) in the Central-West. A convenience sample was defined to include at least 30 children in each of the following age groups: 0–6; 7–9; 10–12; 13–15; 16–18; 19–24; 25–30; 31–36; 37–49; 49–59 months (n=2005). The inclusion criteria included was to be aged 0–59 months and to be accompanied by a primary caregiver (i.e., mother, father, grandmother) during the immunization procedure. Children were recruited in order of arrival at the Basic Health Unit. The questionnaire was applied from 8 am to 5pm to all caregivers who agreed to participate in the study. Data collection involved 274 undergraduate health students who received an 8-h training by the study’s coordination team.
The second sample was recruited in 2018 on September 22th, in two daycare centers in Embu das Artes (São Paulo). We used a convenience sample of 30 children aged 0–59 months. The caregivers were interviewed twice within a 3–8 hour-interval (at the arrival at the daycare center and at the end of the period) by different researchers. The QAD-PIPAS was applied by eight interviewers who attended an 8-h training and had a graduate education level.
Data collection instrumentsThe QAD-PIPAS is an open-source tool that aims to assess children's overall development from 0 to 59 months. It is based on the report of the child’s primary caregivers (i.e., mother, father, grandmother). It is structured in ten age groups (0–6; 7–9; 10–12; 13–15; 16–18; 19–24; 25–30; 31–36; 37–49; 49–59 months) and for each one, a set of items assesses the motor, cognitive, language, and socio-emotional domains, using a yes/no/do not know response scale. The number of items by age group can vary from 9 to 24 questions. The content validity of the instrument is described elsewhere.9
Considering that the care experienced by the children in their surrounding environment may influence their development, 66 questions were added to generate information about the WHO Nurturing Care Framework domains: good health, adequate nutrition, responsive care, opportunities for early learning, and security and safety.17 In addition, questions from the Multiple Indicator Cluster Survey (MICS) related to the caregivers' engagement in child stimulation activities were included.18 The complete QAD-PIPAS can be accessed in the Supplementary File 1.
For concurrent validity analysis, the Caregiver Reported Early Development Index (CREDI)8,12 was also applied to the same children during the multi-vaccination campaign. CREDI was designed to be applied at the population level and is based on caregivers report, assessing the same domains of the QAD-PIPAS, and was validated to be used with Brazilian children aged 0–36 months.8
Statistical treatmentThe data were entered into an application developed for PIPAS Project and exported to an Excel spreadsheet. The analysis was performed in the statistical packages SPSS 25.0 and Stata 14.0.
In the first stage, the Hot Deck imputation method was used to minimize the loss of information.19 For each child, a score was obtained from the sum of the answers to the items. The dichotomous attributes coding was 1 for the expected answers and 0 for the absence of the expected skill or behavior. Then, the scores were standardized by calculating the proportion of expected responses in relation to the total of items evaluated. This standardized score ranged from 0 to 1, with a value of 0 expressing inappropriate responses in all items evaluated and a value of 1 indicating appropriate responses in all items. The calculation of the QAD-PIPAS standardized scores for any age group is given by the expression (1):
Score=∑i=1pQip where Q represents the i-th question, whose value is 0 (No) or 1 (Yes), and p is the number of questions or items evaluated.
The score was normalized using the z-score distribution. Children with Z-scores less than -2 were suspected of having a developmental delay.
The discriminant validity analysis was based on hypothesis tests. The study hypothesized that risk factors for developmental delays would be associated with poorer test performance. The authors used multiple logistic regression to analyze the discriminant validity, and the outcome was suspected ECD delays (yes vs. no). The independent variables were organized considering the Nurturing Care Framework domains17 as follows: good health (prenatal care; the presence of health/growth problems); adequate nutrition (exclusive breastfeeding for children under six months and food diversity for those over six months); responsive care (engaging caregivers in activities to stimulate development); opportunities for early learning (attending daycare centers and one or more children’s books at home) and safety and security (maternal education; home with running water; and participation in the Bolsa Família Conditional Cash Transfer Program). A descriptive analysis was carried out to characterize the study sample, followed by a logistic regression adjusted for the child’s age, adopting a significance level of 5%. Data are presented separately for children 0–36 (n=1295) and 37–59 months old (n=710).
The concurrent validity analysis sought to assess whether the results of the QAD-PIPAS correlate with the CREDI simplified version.8,12 Only children aged 0–36 months old (n=1295) were included in this analysis because this is the age range covered by the CREDI. The procedures described to generate the standardized scores of PIPAS were also adopted to generate CREDI standardized scores for each child. Considering that the original categorical answers to the questionnaire were transformed in scores, bivariate correlation analysis was used to obtain Pearson’s correlation coefficient, at a significance level of 5%. The scatterplot diagram was used to represent the correlation between the scores obtained by applying CREDI and QAD-PIPAS.
The Cronbach’s alpha coefficient was used to calculate the internal consistency because it is recommended for instruments that adopt categorical ratings.15 We performed the analysis by age groups, as the items of the QAD-PIPAS differ according to the child’s age. The internal consistency is considered low if Cronbach’s alpha was lower than 0.21; reasonable if it was 0.21 to 0.40; moderate if 0.41 to 0.60; substantial if 0.61 to 0.80 and almost perfect if it was equal or higher than 0.81.20
The test-retest reliability was analyzed using the Kappa coefficient, as QAD-PIPAS items were rated on a three-level scale.6 The agreement was categorized as insignificant (0), weak (Kappa coefficient < 0.21), reasonable (0.21–0.40), moderate (0.41–0.60), strong (0.61–0.80), and almost perfect (≥0.81).21
Ethical considerationsThe research was approved by the Ethics Committee of the São Paulo Health Institute (CAAE 55261616.5.0000.5469).
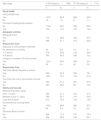
ResultsTable 1 shows the characteristics of the sample across the Nurturing Care Framework domains. In the good health domain, almost all mothers received prenatal care, and 10.5% of the mothers with children under 36 months and 15.4% with children between 37–59 months reported child health/growth problems. In the adequate nutrition domain, children with adequate food were higher in the age group above 36 months (67.5%) than in younger children (58.9%). In the responsive care, more than 75% of the caregivers of children aged 37–59 months reported engaging in 4–6 stimulation activities in the last week, whereas among children under 36 months was 61%. About 5% of the caregivers reported concerns about the child’s development in both age groups. Considering opportunities for early learning, only 20% of children under 36 months were attending daycare centers, while 78% of those aged 37–59 months attended school. The percentage of children who had at least one children’s book at home was 61% among children under 36 months and 87% between 37–49 months. In the security and safety domain, in both age groups, most mothers studied for 8–11 years, lived in homes with running water, and 30% were beneficiaries of the Bolsa Família Program.
Characterization of the studied population of children 0–59 months old according to variables selected by the Nurturing Care Framework. Embu das Artes, Recife, and Distrito Federal, 2017.
| Age range | 0–36 meses (n=1295) | 37–59 meses (n=710) | ||
|---|---|---|---|---|
| n | % | n | % | |
| Good health | ||||
| Had prenatal care | ||||
| Yes | 1272 | 98.8 | 698 | 98.9 |
| No | 15 | 1.2 | 8 | 1.1 |
| Child with health/growth problem | ||||
| No | 1146 | 89.5 | 598 | 84.5 |
| Yes | 134 | 10.5 | 100 | 15.4 |
| Adequate nutrition | ||||
| Adequate Food | ||||
| Yes | 710 | 58.9 | 443 | 67.5 |
| No | 496 | 41.1 | 213 | 32.5 |
| Responsive Care | ||||
| Exposure to CD promotion activities | ||||
| No stimulation or activity | 34 | 2.6 | 15 | 2.1 |
| 1–3 stimuli | 476 | 36.8 | 159 | 24.5 |
| 4–6 stimuli | 785 | 60.6 | 536 | 75.5 |
| Caregiver considers CD to be normal | ||||
| Yes | 1216 | 94.6 | 666 | 94.1 |
| No | 69 | 5.4 | 42 | 5.9 |
| Responsive Care | ||||
| The child attends daycare or school | ||||
| Yes | 262 | 20.3 | 554 | 78.1 |
| No | 1031 | 79.7 | 155 | 21.9 |
| The child has one or more books at home | ||||
| Yes | 783 | 61.4 | 601 | 87.5 |
| No | 493 | 38.6 | 86 | 12.5 |
| Safety and security | ||||
| Maternal Education Level | ||||
| Over 11 years | 269 | 21.3 | 213 | 31.0 |
| Between 8 and 11 years | 786 | 62.1 | 374 | 54.4 |
| Less than 8 years | 210 | 16.6 | 100 | 14.6 |
| Household has running water | ||||
| Yes | 1253 | 96.6 | 692 | 97.5 |
| No | 44 | 3.4 | 18 | 2.5 |
| Receives Bolsa Família | ||||
| No | 906 | 71.2 | 515 | 73.9 |
| Yes | 366 | 28.8 | 182 | 26.1 |
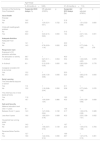
Multivariable logistic regression models of suspected ECD delays are presented in Table 2. Under 36 months, when caregivers reported children had health/growth problems and were concerned about developmental problems, there was a significant association with the outcome, configuring a risk factor; while receiving one or more developmental stimulus at home configured as a protective factor. For children 37–59 months, similar results were observed. In addition, not having children’s books and low maternal education significantly increased the chances of developmental problems.
Factors associated with suspected ECD delays by age group adjusted for Nurturing Care Framework variables and the child’s age. Embu das Artes, Recife and Distrito Federal, 2017.
| Age Range | ||||||
|---|---|---|---|---|---|---|
| 0–36 months (n=1295) | 37–39 months (n=710) | |||||
| Domains of the Nurturing Care Framework | Suspected ECD delays (%) | OR adjusted (IC95%) | p | Suspected ECD delays (%) | OR adjusted (IC95%) | p |
| Good Health | ||||||
| Prenatal | ||||||
| Yes | 14.2 | 1 | 21.9 | 1 | ||
| No | 33.4 | 1.30 (0.31–5.51) | 0.722 | 37.5 | 1.51 (0.32–6.99) | 0.600 |
| Child with health/growth problem | ||||||
| No | 12.5 | 1 | 31.3 | 1 | ||
| Yes | 32.0 | 3.43 (2.10–5.60) | 0.000 | 19.4 | 2.47 (1.44–4.27) | 0.001 |
| Adequate Nutrition | ||||||
| Adequate Food | ||||||
| Yes | 14.1 | 1 | 23.0 | 1 | ||
| No | 14.5 | 0.78 (0.53–1.16) | 0.222 | 20.2 | 0.77 (0.48–1.23) | 0. 276 |
| Responsive Care | ||||||
| Exposure to CD promotion activities | ||||||
| No stimulation or activity | 38.7 | 1 | 40.0 | 1 | ||
| 1–3 stimuli | 20.4 | 0.27 (0.11 – 0.65) | 0.004 | 33.4 | 1.02 (0.25–4.20) | 0.979 |
| 4–6 stimuli | 9.9 | 0.12 (0.05 – 0.30) | 0.000 | 18.3 | 0.82 (0.20–3.34) | 0.778 |
| Caregiver considers CD to be normal | ||||||
| Yes | 13.2 | 1 | 20.0 | 1 | ||
| No | 35.3 | 2.46 (1.30–4.68) | 0.006 | 52.4 | 4.60 (2.19–9.66) | 0.000 |
| Early Learning | ||||||
| The child attends daycare or school | ||||||
| Yes | 112 | 1 | 21.1 | 1 | ||
| No | 15.2 | 1.18 (0.68–2.04) | 0.550 | 25.8 | 0.77 (0.45–1.38) | 0.376 |
| The child has one or more books at home | ||||||
| Yes | 11.8 | 1 | 18.0 | 1 | ||
| No | 18.7 | 1.00 (0.64–1.54) | 0.980 | 43.0 | 2.36 (1.26–4.46) | 0.008 |
| Safe and Security | ||||||
| Maternal education level | ||||||
| Over 11 years | 8.1 | 1 | 13.6 | 1 | ||
| Between 8 and 11 years | 14.3 | 1.47 (0.82–2.64) | 0.192 | 21.7 | 1.32 (0.76–2.28) | 0.328 |
| Less than 8 years | 19.6 | 1.85 (0.91–3.78) | 0.089 | 40.0 | 3.33 (1.58–7.01) | 0.002 |
| Household has running water | ||||||
| Yes | 14.2 | 1 | 16.7 | 1 | ||
| No | 22.0 | 1.58 (0.67–3.72) | 0.139 | 22.3 | 1.05 (0.74–1.49) | 0.784 |
| Receives Bolsa Família | ||||||
| No | 12.7 | 1 | 18.6 | 1 | ||
| Yes | 18.8 | 1.42 (0.94–2.12) | 0.090 | 29.7 | 1.27 (0.76–2.12) | 0.361 |
The results of concurrent validity between QAD-PIPAS and CREDI are presented in Fig. 1. A significant positive correlation was observed in six of the eight age groups analyzed. The most significant correlations were in the age groups 25–30 and 31–36 months, and the scores of the two instruments did not correlate in the age groups of 10–12 and 13–15 months.


The internal consistency was reasonable in four age groups (7–9, 10–12, 13–15, 16–18 months), moderate in an additional four (0–6, 19–24, 25–30, 31–36 months), and substantial among children over 36 months of age, with Cronbach’s alpha values varying between 0.61 and 0.80.
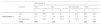
Table 3 presents the results of the reliability test-retest. 587 replicated observations were analyzed. An almost perfect agreement (Kappa ≥0.81) was observed in seven age groups (0–6; 7–9; 10–12; 13–15; 16–18; 31–36; 37–48 months) and a strong agreement (Kappa 0.61–0.80) in three age groups (19–24; 25–30; 49–59 months). The global Kappa coefficient (0.81) was almost perfect.
Results of test-retest reliability of the Child Development Assessment Questionnaire (QAD-PIPAS), 2017.
| Interviewer 2 | |||||||||
|---|---|---|---|---|---|---|---|---|---|
| Answer | Yes | No | Do not know | Total | |||||
| n | % | n | % | n | % | n | % | ||
| Interviewer 1 | Yes | 422 | 95.7 | 18 | 4.1 | 1 | 0.2 | 441 | 100 |
| No | 16 | 11.7 | 118 | 86.8 | 2 | 1.5 | 136 | 100 | |
| Do not know | 2 | 20.0 | 3 | 30.0 | 5 | 50.0 | 10 | 100 | |
| Total | 440 | 139 | 8 | 587 | 100 | ||||
The QAD-PIPAS showed evidence of construct validity and reliability to be used in population studies involving children aged 0–59 months.
The discriminant validity analysis showed that the QAD-PIPAS was sensitive to risk and protective factors based on the Nurturing Care Framework. The chance of being classified as a suspected developmental delay was higher in children experiencing risk factors than others. On the other hand, children with protective factors had fewer chances of being classified as a suspected developmental delay than their counterparts. The analysis performed enabled this validation step for both 0–36 and 37–59 age groups. Discriminant validity is one of the main objectives of the child development assessment at population-level studies, as it can inform appropriate interventions and also detect positive effects of the interventions.6 Children exposed to unfavorable socioeconomic conditions, such as low maternal education and not having children’s books, were more likely to have suspected developmental delays. Similar results were already identified in other studies in low and middle-income countries, including Brazil.22–24 Likewise, receiving one or more developmental stimulus at home in the last week, which is considered a protective factor, decreased the chances of children presenting any suspicion of developmental delays, which was also reported by Altafim et al. (2018).8 In addition, the results confirm the strong association between caregivers’ perception and children’s performance in developmental assessment tests.25
The comparisons made between QAD-PIPAS and CREDI found a statistically significant correlation in most analyzed age groups. The most favorable result was obtained for children in older age groups. Rubio-Codina et al. (2016), analyzing the concurrent validity of the cognitive, language, and fine motor scales of three multidimensional tests with the Bayley-III scales, also obtained worse results in children under 19 months and better results after 30 months of age.26
The analysis of internal consistency showed acceptable results in all age groups. Internal consistency is the reliability measure that indicates the correlation between items in a test27 and considers the factorial loads of the items.28 The number of tested items influences Cronbach’s alpha value.29,30 The best results of Cronbach’s alpha were obtained for children between 37 and 59 months. The greater number of items in these age groups may have positively influenced the results.
There was a high degree of agreement in the caregivers’ responses in the test-retest reliability, obtained by different interviewers at two different times. Reliability assumes that individuals show some stability in exhibiting the behaviors under assessment, although there may be some variation in successive tests.6 The results tend to be satisfactory if the instrument is administered uniformly, with a standardized, high-quality interviewer training.6 The results indicate that QAD-PIPAS questions were adequately understood by the caregivers and interviewers after 8-hs training, enabling consistently high rates of agreement in all age groups.
The psychometric properties of the QAD-PIPAS analyzed in the present study encourage the use of the instrument to monitor ECD at the population level in Brazil. Some aspects must be highlighted, such as the methodological rigor of all validation stages and the sample, which included children residing in different Brazilian regions and socioeconomic and cultural contexts.
The advantages of QAD-PIPAS for monitoring ECD at the population level are: (i) being based on caregivers’ reports, which shortens the application time required for the questionnaire and does not require specialized evaluators for its application; (ii) providing a global measure of child development that considers the motor, cognitive, and language domains as well as the early manifestations of socioemotional aspects; (iii) and the absence of copyright, an aspect that facilitates large-scale use.
The study's limitations include that the test-retest reliability analysis was conducted on a small sample, and it should be repeated in future studies. We could not perform the concurrent validity analysis for children over 36 months because we used CREDI as a reference test, considering its similarities to QAD-PIPAS. Besides, it is necessary to apply the instrument in larger samples in different regions of the country to test it in other contexts and expand the analysis of other psychometric properties.
The experience of applying the QAD-PIPAS in surveys carried out in São Paulo, Pernambuco, and Distrito Federal allowed the authors to learn about the conditions necessary to carry out the research. It is essential to articulate epidemiological surveillance, primary health care, and child health services in the municipalities, beyond education and social assistance sectors, which can support data collection. Moreover, the partnership with universities is essential for recruiting students and supporting the 8-h training to prepare them for data collection. The study confirmed QAD-PIPAS is easily applied and can be implemented in multi-vaccination campaigns at low costs.
FundingChamada047/2014 MCTI/CNPq/MS/DECIT/Bill and Melinda Gates Foundation (Processo 401721/2015−9)
Conflict of interestThe authors declare no conflicts of interest.
Our thanks to the managers and teams of Distrito Federal, Recife and Embu das Artes for supporting the research.
The following is Supplementary data to this article:

Study conducted at Instituto de Saúde, Secretaria de Estado da Saúde de São Paulo, São Paulo, SP, Brazil.


