
This study aimed to identify the prevalence and factors associated with body mass index (BMI) in children aged 9–11 years.
MethodsThe study is part of the International Study of Childhood Obesity Lifestyle and the Environment (ISCOLE). Body composition was determined using the bipolar bioimpedance technique. The mean BMI value was categorized as recommended by the World Health Organization. For seven consecutive days, participants used an accelerometer to objectively monitor sedentary behavior (SB) and moderate to vigorous physical activity. Individual factors (anthropometric and behavioral), family aspects, and family and school environment were provided by participants and parents and were analyzed by multilevel linear regression adjusted for gender, ethnicity, school, number of siblings, and total annual family income.
ResultsThe mean BMI was 20.1kg/m2, and 51.8% of the children were overweight/obese (50.3% boys, 53.4% girls, p=0.014). Considering all participants, the associated factors of BMI were body fat percentage (BF%, β=0.0216, p<0.001) and screen time (ST, β=0.0050, p=0.006). In boys, the associated factors were BF% (β=0.0209, p<0.001), ST (β=0.006, p=0.036), and healthy eating policies or practices (β=0.0276, p=0.025). In girls, only BF% was associated (β=0.0221, p<0.001) with BMI.
ConclusionsHigh prevalence of overweight/obesity was observed in children from São Caetano do Sul. Different associated factors were identified between the genders, with only BF% being common in both genders.
O objetivo deste estudo foi identificar a prevalência e os fatores associados do índice de massa corporal (IMC) em crianças de 9-11 anos de idade.
MétodosO estudo faz parte do International Study of Childhood Obesity Lifestyle and the Environment (ISCOLE). A composição corporal foi determinada pelo método da bioimpedância bipolar. O valor médio do IMC foi categorizado conforme sugerido pela Organização Mundial de Saúde. Durante sete dias consecutivos, os participantes usaram acelerômetro para monitorar objetivamente o comportamento sedentário (CS) e atividade física de moderada a vigorosa. Fatores associados individuais (antropométricos e comportamentais), aspectos familiares, ambiente familiar e escolar, foram preenchidos pelos participantes e pais e foram analisados pela regressão linear multi-nível ajustados para sexo, raça, escola, número de irmãos, e renda familiar total anual.
ResultadosA média do IMC foi de 20,1kg/m2, sendo que 51,8% das crianças estavam com excesso de peso/obesidade (50,3% meninos; 53,4% meninas; p=0,014). Considerando todos os participantes, os fatores associados do IMC foram a porcentagem de gordura corporal (%GC; β=0,0216; p<0,001) e o tempo de tela (TT; β=0,0050; p=0,006). Nos meninos, os fatores associados foram a %GC (β=0,0209; p<0,001), TT (β=0,006; p=0,036) e políticas ou práticas de alimentação saudável (β=0,0276; p=0,025). Já nas meninas, somente a %GC foi associada (β=0,0221; p<0,001) com o IMC.
ConclusõesMostramos valores elevados de prevalência de excesso de peso/obesidade em crianças de São Caetano do Sul. Diferentes fatores associados foram identificados entre os sexos, sendo somente a %GC foi comum em ambos os sexos.
The prevalence of overweight/obesity in children worldwide, including Brazil, has increased in recent decades,1 raising the concern of public health authorities, which have encouraged regional and local governments to consider different strategies to reduce overweight/obesity.2
Overweight/obesity is considered the fifth most important factor for overall mortality and a determinant in the development of chronic diseases,3 such as metabolic syndrome in children.4 Moreover, excess weight in this age group and in adolescence tends to remain until adulthood.5
Due to the need and importance of overweight/obesity monitoring, and so that prevention programs are effective, factors associated with excess weight need to be identified, since the prevalence in Brazilian children is high.6
Studies have found that overweight/obesity, when assessed by body mass index (BMI), are associated with the family's socioeconomic status, number of siblings,7 sedentary lifestyle,8 screen time (ST) (TV, computer, or video games),9 electronic equipment in the bedroom, total sedentary time (SED), and moderate-to-vigorous physical activity (MVPA).10 However, there are limited data on the factors associated with BMI in Brazilian children, especially those measured objectively, such as accelerometry, which requires a combination of financial resources and technological knowledge, thus constituting a challenge for researchers from low and middle-income countries.10
In this study, the hypothesis was to find significant associations of individual, family, and school/family environment factors in children. Therefore, the aim of this study was to assess the individual anthropometric and behavioral, family, and school/family environment factors associated with BMI in children aged 9–11 years.
MethodsStudy sampleThis multicenter cross-sectional study is part of the International Study of Childhood Obesity, Lifestyle, and the Environment (ISCOLE). ISCOLE was carried out in 12 countries, comprising the five geographic regions of the world.11 Details on ISCOLE have been previously published.11
The present study focuses on the data collected in the municipality of São Caetano do Sul, a representative of ISCOLE in Brazil, located in the state of São Paulo. In 2013, the municipality had 149,263 inhabitants, of whom 1557 were children aged 10 years.10
The project was presented and approved by the Municipal Education Secretariat, schools, and parents’ associations. All children attending fifth grade were invited to participate in the study. Two complete lists of public and private schools were generated and each school was selected by drawing lots. Public and private schools were selected separately from each list, considering a ratio of four (public) to one (private). Twenty schools (16 public) were selected to obtain a sample of 25–30 children from each school, with a target and total recruitment of 500 children (50% for each gender) between the ages of 9–11 years.
Data collection was performed between March 2012 and April 2013 and all evaluations were carried out during an entire week per school.
In total, 584 children (287 boys) were assessed and met the following inclusion criteria: (a) age between 9 and 11 years; (b) being regularly enrolled in a school of the municipality; and (c) having no clinical or functional limitations that would prevent the practice of daily physical activity. Incorrect or invalid information accounted for 236 children. Therefore, the final sample included 328 children. Parents and/or guardians signed the informed consent. The study was approved by the Ethics Committee of Universidade Federal de São Paulo.
Body compositionHeight was measured with a precision of 0.1cm, with the children were barefoot, in a Seca 213 portable stadiometer (Seca®, Hamburg, Germany), with the head in the Frankfurt plane. Body weight and body fat percentage (BF%) were measured using a Tanita SC-240 portable body composition analyzer (Arlington Heights, IL, USA) after children had removed shoes, socks, and heavy items from their pockets.12 After the device was started, the participant was instructed to stand in the middle of the body composition analyzer, barefoot, with the heels touching the posterior electrodes and the front of the feet in contact with the anterior electrodes. Participants were in a stable position without bending their knees. Two measurements were taken and the mean was used in the analysis (a third measurement was obtained if the first two measurements had a difference greater than 0.5kg or 2.0% for body mass).
BMI was calculated based on height and body weight (kg/m2), and the z-score was then calculated based on the World Health Organization (WHO) growth reference data. The children were classified as: underweight: <−2SD; normal weight: −2SD to 1SD; overweight >+1SD to 2SD; and obesity: >+2SD.13
Waist circumference (WC) measurements were made on exposed skin at the end of a normal expiration using a non-elastic anthropometric tape between the lower rib margin and the iliac crest.11 Participants were asked to stand in the upright position with feet side-by-side and arms relaxed at the side of the body.
AccelerometryAn Actigraph GT3X accelerometer (ActiGraph, Ft. Walton Beach, USA) was used to objectively monitor total ST and MVPA. The device was worn at the waist coupled to an elastic belt, on the right midaxillary line. Participants were encouraged to use the accelerometer 24h per day for at least seven days, including two weekend days. The children were instructed to remove the accelerometer only for physical activities in water.
The minimum amount of accelerometry data that was considered acceptable for analysis was four days (including at least one weekend day), with at least 10h/day of use, after removal at bed time.14,15 Blocks of 20min of consecutive zero counts were considered as non-use of the device and were discarded from the analyses.
The research team verified whether the data were complete using the Actilife software (ActiGraph, Pensacola, FL, USA), version 5.6. Data were collected at a sampling rate of 80Hz, downloaded in periods of 1s, and aggregated for periods of 15s.16 Specifically, in the data calculation, ≤25 counts/15s aggregates were used for total ST and ≥574 counts/15s for MVPA,16 providing the best classification accuracy between the cutoff points currently available for total ST and MVPA in children.15
QuestionnairesThe children reported on ST using the Diet and Lifestyle Questionnaire.11 They were asked about how many hours they watched TV and how many hours they played video and/or computer games on weekdays and weekends.11 In addition to ST, the questionnaire contained information related to food consumption, physical activity, SED, breakfast, transportation to school and sleep. The children completed the questionnaire regarding the consumption of 23 food items in a typical week. To identify existing dietary patterns, main component analysis (MCA) was used, considering food items as input variables. The MCA was performed with the varimax orthogonal transformation to force non-correlation and improve interpretation. Two factors were identified: “unhealthy diet pattern” (fast food, potato chips, ice cream, among others) and “healthy diet pattern” (vegetables, fruits, among others). The two scores were considered separately and treated as continuous variables.
The Demographic and Family Health Questionnaire containing information on children's health history, parental educational level, parents’ body weight and height, family income, and car ownership was answered by parents or guardians. It also included information on the children's age, gender, number of siblings, and ethnicity. The Neighborhood Questionnaire was used to obtain information about the parents’ perceptions of the social environment, built neighborhood, eating habits, environment for physical activity practice, and number of TVs at home and was answered by parents or guardians. The School Environment Questionnaire, which contains information about the characteristics of schools, policies and practices that can influence healthy eating and the practice of physical activity, was answered by a school administrator.11
Statistical analysisThe Kolmogorov–Smirnov test was used to evaluate the normality of data. Data were described through means, standard deviation (SD) frequencies and percentages. The analyses were performed using SPSS (IBM SPSS Statistics for Windows, version 20.0; NY, USA).
Multilevel linear regression analysis, including the school as a random effect, was used to assess the correlation of factors associated with BMI. All associated factors were used in univariate models adjusted for gender, ethnicity, and school (to allow grouping at the school level). Subsequently, the associated factors that had p<0.10 with BMI in the specific models were included in the final model. The variables with p<0.05 were considered to be factors associated with BMI in the final model. The covariates used in multivariate models were gender, ethnicity, school, number of siblings, and total annual family income.
Multicollinearity was tested through the correlation, tolerance, and variance inflation factor. Variance inflation factor (VIF) values higher than 5 were considered indicators of problems when estimating the coefficient, due to the multicollinearity between the independent variables. The Akaike information criterion (AIC) and Bayesian information criterion (BIC) were used to compare the models.
ResultsIn total, 698 participants received an informed consent form, of which 662 were signed. Complete accelerometry and anthropometry data were retrieved for 495 and 564 participants, respectively. Regarding the questionnaires, 569 participants presented complete data for the Diet and Lifestyle Questionnaire, 515 for the Demographic and Family Health Questionnaire, and 512 for the Neighborhood Questionnaire.
Complete data of interest for the study and all associated factors investigated were available for 328 participants (mean age=10.4 years [0.50]), of whom 169 (51.5%) were boys and 159 (48.5% %) were girls. Mean BF% was 23.5% (21.3 [9.6] in boys and 25.8 [9.0] in girls; p<0.001). Based on the WHO reference data,13 1.2% of the children were classified as underweight, 47% as normal weight, 23.8% as overweight, and 28% as obese (51.8% were overweight/obese, of whom 50.3% were boys and 53.4% girls). The mean WC was 67.6cm (68 [11.7] for boys and 67.2 [9.8] for girls; p=0.544). The mean time spent in MVPA (min/day) was 59.3, 71.2 (27.0) for boys and 46.6 (18.6) for girls, and total ST was 500min/day (boys: 489; girls: 511; p=0.005). Sample characterization details and comparisons between the genders were described by Ferrari et al.17
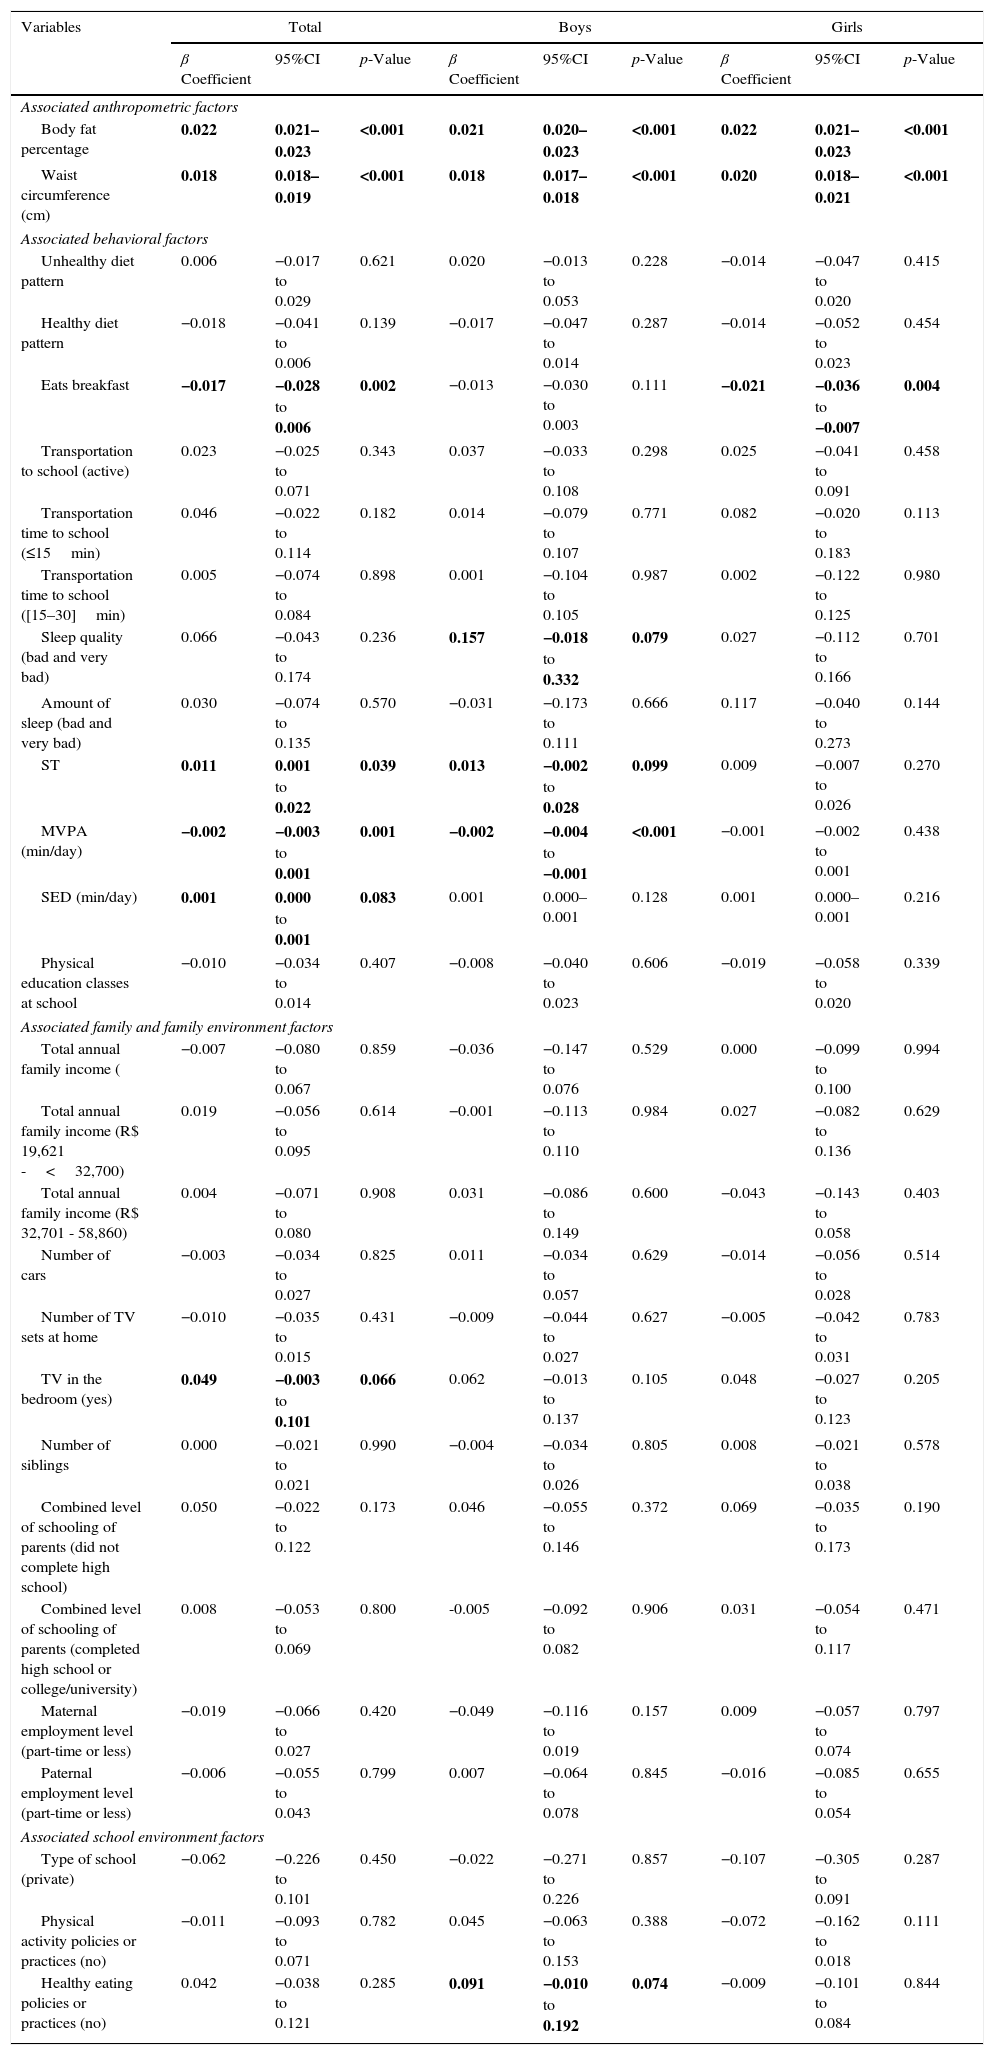
Table 1 presents the results of the univariate regression. Of the 22 individual associated factors (anthropometric and behavioral, family, and school and family environment), seven (p<0.10) were associated with BMI in both genders together, six in boys and three in girls. Considering both genders together, BMI was positively associated with BF%, WC, ST, total SED, and having a TV in the bedroom. BMI was negatively associated with eating breakfast and MVPA.
Univariate models of anthropometric, behavioral, family, and school environment factors associated with BMI in children.a
| Variables | Total | Boys | Girls | ||||||
|---|---|---|---|---|---|---|---|---|---|
| β Coefficient | 95%CI | p-Value | β Coefficient | 95%CI | p-Value | β Coefficient | 95%CI | p-Value | |
| Associated anthropometric factors | |||||||||
| Body fat percentage | 0.022 | 0.021–0.023 | <0.001 | 0.021 | 0.020–0.023 | <0.001 | 0.022 | 0.021–0.023 | <0.001 |
| Waist circumference (cm) | 0.018 | 0.018–0.019 | <0.001 | 0.018 | 0.017–0.018 | <0.001 | 0.020 | 0.018–0.021 | <0.001 |
| Associated behavioral factors | |||||||||
| Unhealthy diet pattern | 0.006 | −0.017 to 0.029 | 0.621 | 0.020 | −0.013 to 0.053 | 0.228 | −0.014 | −0.047 to 0.020 | 0.415 |
| Healthy diet pattern | −0.018 | −0.041 to 0.006 | 0.139 | −0.017 | −0.047 to 0.014 | 0.287 | −0.014 | −0.052 to 0.023 | 0.454 |
| Eats breakfast | −0.017 | −0.028 to 0.006 | 0.002 | −0.013 | −0.030 to 0.003 | 0.111 | −0.021 | −0.036 to −0.007 | 0.004 |
| Transportation to school (active) | 0.023 | −0.025 to 0.071 | 0.343 | 0.037 | −0.033 to 0.108 | 0.298 | 0.025 | −0.041 to 0.091 | 0.458 |
| Transportation time to school (≤15min) | 0.046 | −0.022 to 0.114 | 0.182 | 0.014 | −0.079 to 0.107 | 0.771 | 0.082 | −0.020 to 0.183 | 0.113 |
| Transportation time to school ([15–30]min) | 0.005 | −0.074 to 0.084 | 0.898 | 0.001 | −0.104 to 0.105 | 0.987 | 0.002 | −0.122 to 0.125 | 0.980 |
| Sleep quality (bad and very bad) | 0.066 | −0.043 to 0.174 | 0.236 | 0.157 | −0.018 to 0.332 | 0.079 | 0.027 | −0.112 to 0.166 | 0.701 |
| Amount of sleep (bad and very bad) | 0.030 | −0.074 to 0.135 | 0.570 | −0.031 | −0.173 to 0.111 | 0.666 | 0.117 | −0.040 to 0.273 | 0.144 |
| ST | 0.011 | 0.001 to 0.022 | 0.039 | 0.013 | −0.002 to 0.028 | 0.099 | 0.009 | −0.007 to 0.026 | 0.270 |
| MVPA (min/day) | −0.002 | −0.003 to 0.001 | 0.001 | −0.002 | −0.004 to −0.001 | <0.001 | −0.001 | −0.002 to 0.001 | 0.438 |
| SED (min/day) | 0.001 | 0.000 to 0.001 | 0.083 | 0.001 | 0.000–0.001 | 0.128 | 0.001 | 0.000–0.001 | 0.216 |
| Physical education classes at school | −0.010 | −0.034 to 0.014 | 0.407 | −0.008 | −0.040 to 0.023 | 0.606 | −0.019 | −0.058 to 0.020 | 0.339 |
| Associated family and family environment factors | |||||||||
| Total annual family income ( | −0.007 | −0.080 to 0.067 | 0.859 | −0.036 | −0.147 to 0.076 | 0.529 | 0.000 | −0.099 to 0.100 | 0.994 |
| Total annual family income (R$ 19,621 -<32,700) | 0.019 | −0.056 to 0.095 | 0.614 | −0.001 | −0.113 to 0.110 | 0.984 | 0.027 | −0.082 to 0.136 | 0.629 |
| Total annual family income (R$ 32,701 - 58,860) | 0.004 | −0.071 to 0.080 | 0.908 | 0.031 | −0.086 to 0.149 | 0.600 | −0.043 | −0.143 to 0.058 | 0.403 |
| Number of cars | −0.003 | −0.034 to 0.027 | 0.825 | 0.011 | −0.034 to 0.057 | 0.629 | −0.014 | −0.056 to 0.028 | 0.514 |
| Number of TV sets at home | −0.010 | −0.035 to 0.015 | 0.431 | −0.009 | −0.044 to 0.027 | 0.627 | −0.005 | −0.042 to 0.031 | 0.783 |
| TV in the bedroom (yes) | 0.049 | −0.003 to 0.101 | 0.066 | 0.062 | −0.013 to 0.137 | 0.105 | 0.048 | −0.027 to 0.123 | 0.205 |
| Number of siblings | 0.000 | −0.021 to 0.021 | 0.990 | −0.004 | −0.034 to 0.026 | 0.805 | 0.008 | −0.021 to 0.038 | 0.578 |
| Combined level of schooling of parents (did not complete high school) | 0.050 | −0.022 to 0.122 | 0.173 | 0.046 | −0.055 to 0.146 | 0.372 | 0.069 | −0.035 to 0.173 | 0.190 |
| Combined level of schooling of parents (completed high school or college/university) | 0.008 | −0.053 to 0.069 | 0.800 | -0.005 | −0.092 to 0.082 | 0.906 | 0.031 | −0.054 to 0.117 | 0.471 |
| Maternal employment level (part-time or less) | −0.019 | −0.066 to 0.027 | 0.420 | −0.049 | −0.116 to 0.019 | 0.157 | 0.009 | −0.057 to 0.074 | 0.797 |
| Paternal employment level (part-time or less) | −0.006 | −0.055 to 0.043 | 0.799 | 0.007 | −0.064 to 0.078 | 0.845 | −0.016 | −0.085 to 0.054 | 0.655 |
| Associated school environment factors | |||||||||
| Type of school (private) | −0.062 | −0.226 to 0.101 | 0.450 | −0.022 | −0.271 to 0.226 | 0.857 | −0.107 | −0.305 to 0.091 | 0.287 |
| Physical activity policies or practices (no) | −0.011 | −0.093 to 0.071 | 0.782 | 0.045 | −0.063 to 0.153 | 0.388 | −0.072 | −0.162 to 0.018 | 0.111 |
| Healthy eating policies or practices (no) | 0.042 | −0.038 to 0.121 | 0.285 | 0.091 | −0.010 to 0.192 | 0.074 | −0.009 | −0.101 to 0.084 | 0.844 |
Multilevel linear model adjusted for school type, gender, and ethnicity with random effect of school, and with non-standard beta coefficients are shown;
95%CI, 95% confidence interval; BMI, body mass index; MVPA, moderate to vigorous physical activity; ST, screen time; SED, sedentary time: TV, television.
Reference categories of categorical variables: transport to school: inactive; transportation time to school: >30min; quality and quantity of sleep: good and very good; total annual family income: Rs 58,861 and above; TV in bedroom: no; combined parental level of education: specialization; level of maternal and paternal employment: full-time; type of school: public; physical activity or healthy eating policies or practices: yes.
In boys, a positive association was observed between BMI and BF%, WC, sleep quality, ST, and healthy eating policies and practices. A negative association of BMI was observed only with MVPA. In girls, BMI was positively associated with BF% and WC. Additionally, BMI was negatively associated with eating breakfast (Table 1).
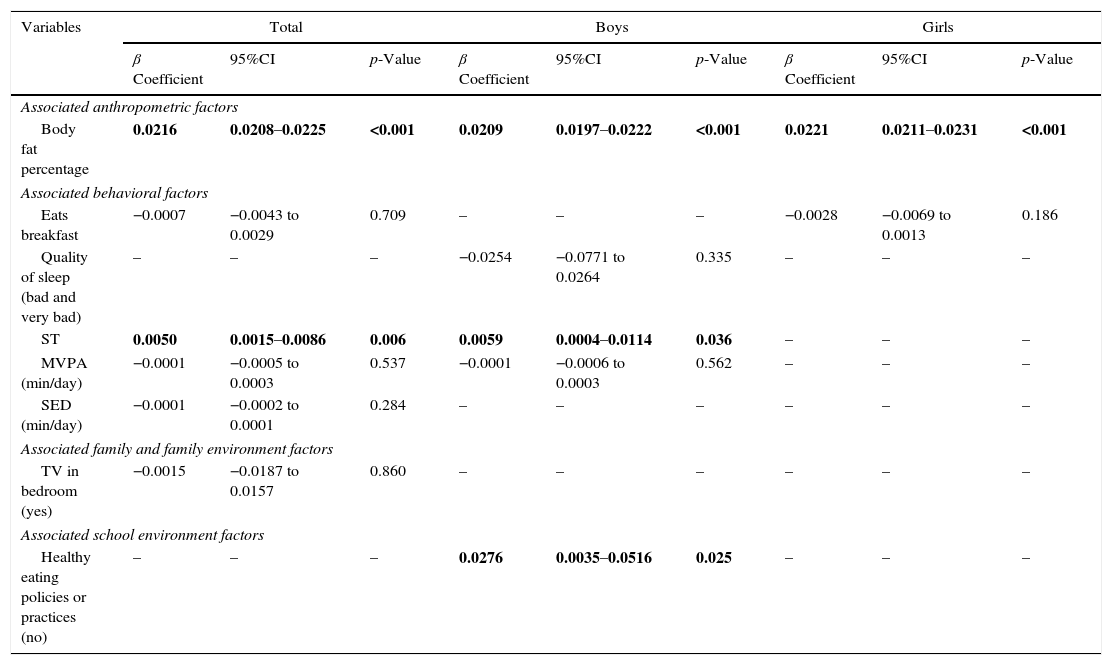
In the multivariate models, the presence of multicollinearity problems between BF% and WC variables was observed. The variable BF% presented the best fit models (lower AIC and BIC values), and was therefore was included in the multivariate models.
Considering both genders together, the significant and positive associated factors of BMI (p<0.05) were BF% and screen time. In boys, in addition to BF% and screen time, BMI was positively associated with healthy eating policies and practices. In girls, only BF% was positively associated with BMI, when adjusted for school type, gender, ethnicity, number of siblings, and total annual family income (Table 2).
Final (multivariate) model of anthropometric, behavioral, family, and school environment factors associated with BMI in children.a
| Variables | Total | Boys | Girls | ||||||
|---|---|---|---|---|---|---|---|---|---|
| β Coefficient | 95%CI | p-Value | β Coefficient | 95%CI | p-Value | β Coefficient | 95%CI | p-Value | |
| Associated anthropometric factors | |||||||||
| Body fat percentage | 0.0216 | 0.0208–0.0225 | <0.001 | 0.0209 | 0.0197–0.0222 | <0.001 | 0.0221 | 0.0211–0.0231 | <0.001 |
| Associated behavioral factors | |||||||||
| Eats breakfast | −0.0007 | −0.0043 to 0.0029 | 0.709 | – | – | – | −0.0028 | −0.0069 to 0.0013 | 0.186 |
| Quality of sleep (bad and very bad) | – | – | – | −0.0254 | −0.0771 to 0.0264 | 0.335 | – | – | – |
| ST | 0.0050 | 0.0015–0.0086 | 0.006 | 0.0059 | 0.0004–0.0114 | 0.036 | – | – | – |
| MVPA (min/day) | −0.0001 | −0.0005 to 0.0003 | 0.537 | −0.0001 | −0.0006 to 0.0003 | 0.562 | – | – | – |
| SED (min/day) | −0.0001 | −0.0002 to 0.0001 | 0.284 | – | – | – | – | – | – |
| Associated family and family environment factors | |||||||||
| TV in bedroom (yes) | −0.0015 | −0.0187 to 0.0157 | 0.860 | – | – | – | – | – | – |
| Associated school environment factors | |||||||||
| Healthy eating policies or practices (no) | – | – | – | 0.0276 | 0.0035–0.0516 | 0.025 | – | – | – |
Multilevel linear model, including all significant variables in the univariate model, adjusted for school type, gender, ethnicity, number of siblings and total annual family income, and school with random effect.
95%CI, 95% confidence interval; MVPA, moderate to vigorous physical activity; SED, sedentary time; ST, screen time.
Note: Data in bold indicate significance (p<0.05).
Reference categories of categorical variables: quality and quantity of sleep: good and very good; TV in bedroom: no; healthy eating policies or practices: yes.
This study aimed to assess the associated factors of BMI in children. The present results showed that 51.8% of the children (50.3% boys, 53.4% girls) were overweight/obese. In the total sample, the associated factors of BMI were BF% and screen time. In boys, the identified associated factors were BF%, screen time, and healthy eating policies or practices. In girls, only BF% was considered to be a factor associated with BMI.
Childhood overweight/obesity has increased dramatically in many countries, including Brazil, making its prevention and management a public health priority.1 The Family Budget Survey found a prevalence of overweight/obesity of 37.2% in children, being 41.1% in boys and 33.2% in girls.18 In the present study, a prevalence of 51.8% (50.3% in boys, 53.4% in girls) of overweight/obesity in a single region was observed.
The increased prevalence of overweight/obesity is a matter of concern due to the increased risk of children having excess weight in adolescence, as well as in adult life.5 Overweight/obesity in children is also related with many severe consequences, including metabolic syndrome.4 Therefore, being overweight impairs the individual's health and quality of life throughout their lifetime.19
These results support previous studies that documented strong associations between BMI and BF% in children.20,21 Mei et al.21 in a data analysis of the National Health and Nutrition Examination Survey reported correlations of 0.81 and 0.88 between BMI-for-age and BF% in boys and girls, respectively. Katzmarzyk et al.20 found a correlation of 0.81 between BMI and BF% in children. These results are similar to those of the present study, in which the correlation (total sample) was 0.92 between BMI and BF%.
The present results showed significant associations between ST and BMI, being consistent with longitudinal studies that demonstrated a temporal sequence between screen time and increase in overweight/obesity, and also with an intervention research showing that the reduction of screen time may delay BMI increase in adolescence.22 For Kimbro et al.,23 children whose time is less structured fill up their free periods with screen time.
Martinez-Gomez et al.24 found a positive association between the number of risk factors (for instance, physical activity and ST) and WC, BF%, and BMI in adolescents. Vioque et al.25 found that obese adults spent more time watching TV than those with normal weight. The authors also found that the ST risk factor is more important for predicting overweight/obesity than physical activity as a protector against excess weight. In the present study, no association of MVPA with BMI was observed.
Healthy eating policies or practices were associated with BMI in children. That is, boys from schools without healthy eating policies and practices have higher BMI than those who study in schools with healthy eating policies and practices, indicating the need to increase and expand health promotion actions aimed at schools and children. In addition to initiatives in the field of public policies indicating the encouragement of a healthy diet as a priority for the promotion of health and food and nutritional security26 the National Food and Nutrition Policy is in progress.26 From this perspective, these results should be widely disclosed in order to subsidize actions to be implemented, expanded, and/or reformulated. Furthermore, the maintenance of the surveillance system for health risk factors for children should be part of the list of future actions.27
Especially in children, prevention is universally seen as the best approach to reverse the increasing global prevalence of overweight/obesity.1,2 Despite the apparent fascination of prevention, to date, there is limited evidence on the most effective means of preventing childhood obesity. This may be partly related to the relatively small sample sizes for the expected effect size and/or insufficient duration of the longitudinal study in many prevention trials.28 Prevention is multi-level and measures should be instituted at the individual, family, community, and institutional healthcare levels.28
This study contributes to the existing literature on overweight/obesity in children, exploring the role of modifiable life behaviors. This study has some strengths that should be highlighted: the robust quality and the guarantee of data collection procedures,11 as well as the inclusion of intervening variables that were controlled in the analyses. Conversely, the fact that this was a cross-sectional study precludes the determination of whether these associations are in any way causal or whether, for instance, screen time may be a marker of other lifestyle factors that may influence BMI, such as dietary factors, socioeconomic level, physical activity, or other sedentary activities. However, the associations are consistent with cross-sectional studies that also included intervention assessment.29 The biological age was not controlled in the study, although most children were likely to be prepubertal. Particularly, the results for healthy and unhealthy diets should be treated with caution due to the difficulties observed when measuring this behavior.
Future studies should also aim to understand how different types of technology influence overweight/obesity in longitudinal studies, since the present study only assessed total screen time. This is important for health professionals to plan public health strategies to reduce ST and, consequently, overweight/obesity.
High prevalence values of overweight/obesity were observed in children from São Caetano do Sul. In both genders, when considered together, the factors associated with BMI were BF% and ST. In boys, the identified associated factors were BF%, ST, and healthy eating policies or practices. In girls, only BF% was considered to be associated with BMI when adjusted for gender, ethnicity, school type, number of siblings, and total annual income.
FundingThe ISCOLE Brazil research project was funded by the Coca-Cola Company; P.T.K. is partially funded by Marie Edana Corcoran in obesity and childhood diabetes.
ISCOLE was sponsored by the Coca-Cola Company. The sponsor had no role in the study design, data collection and analysis, nor in the preparation of this manuscript and decision to publish it.
Conflicts of interestThe authors declare no conflicts of interest.
The authors would like to thank all ISCOLE researchers, the participants, the parents and/or tutors, teachers and coordinators of the Municipal Education Secretariat of São Caetano do Sul, and the City Hall of São Caetano do Sul.
Please cite this article as: Ferrari GL, Matsudo V, Katzmarzyk PT, Fisberg M. Prevalence and factors associated with body mass index in children aged 9–11 years. J Pediatr (Rio J). 2017;93:601–9.


