

To establish the frequency of 82 morphological features in a sample of Brazilian children (between 3 and 13 years old), to understand the influence of age, gender, and ethnicity.
MethodsThis was a cross-sectional study that evaluated 239 children with typical development (between 3 and 13 years old) regarding the presence of 82 morphological characteristics. A previously described protocol, based on the London Dysmorphology Database, was applied to evaluate the sample. This protocol was culturally adapted to Brazilian Portuguese.
ResultsThe frequency of 82 morphological characteristics was established in the sample; of 82 characteristics, 50% were considered morphological anomalies (frequency less than 4%). At least 25% of the sample presented more than one minor morphological anomaly. Age was shown to influence the frequency of the following morphological characteristics: widow's peak, prominent antihelix, prominent upper lip, irregular or crowded teeth, and clinodactyly, but had no influence on the frequency of minor morphological anomalies. Gender influenced dysplastic ears and attached earlobe, but had no influence on the frequency of minor morphological anomalies; ethnicity showed influence on camptodactyly and prominent antihelix. A statistically significant divergence was observed regarding 43 of the 73 morphological characteristics that could be compared with literature data (58.9%).
ConclusionsThe study determined the frequency of 82 morphological characteristics in 239 children with typical development. Age was the variable that showed more influence on the frequency of morphological characteristics, and comparison with literature data showed that the frequency depends on variables such as age and ethnicity.
Estabelecer a frequência de 82 características morfológicas em uma amostra de crianças brasileiras (entre 3 e 13 anos), para entender a influência da idade, sexo e etnia.
MétodosEste foi um estudo transversal. Avaliamos 239 crianças com desenvolvimento típico (entre 3 e 13 anos), em relação à presença de 82 características morfológicas. Aplicamos um protocolo descrito anteriormente, baseado no London Dysmorphology Database, para avaliar nossa amostra. Este protocolo foi culturalmente adaptado ao português do Brasil.
ResultadosA frequência de 82 características morfológicas foi estabelecida em nossa amostra; de 82 características, 50% foram consideradas anomalias morfológicas (frequência inferior a 4%). Pelo menos 25% da nossa amostra apresentou mais de uma anomalia morfológica menor. A idade mostrou influência na frequência das seguintes características morfológicas: “bico de viúva”, “anti-hélice proeminente”, “lábio superior proeminente”, “dentes irregulares ou encavalados” e “clinodactilia”, mas não teve influência na frequência de anomalias morfológicas menores. O sexo mostrou influência nas seguintes características: “orelhas displásicas” e “lóbulo da orelha aderente”, mas não teve influência na frequência de anomalias morfológicas menores; a etnia mostrou influência na “camptodactilia” e “anti-hélice proeminente”. Houve divergência (estatisticamente significativa) em 43 características morfológicas de 73 que pudemos comparar com os dados da literatura (58,9%).
ConclusõesEstabelecemos a frequência de 82 características morfológicas em 239 crianças com desenvolvimento típico. A idade foi a variável que mostrou maior influência na frequência de características morfológicas e a comparação com dados da literatura mostrou que a frequência depende de variáveis como idade e etnia.
A morphological anomaly is a phenotype that is substantially different from that observed in a reference population.1 This difference can be defined as the occurrence of the phenotypic characteristic in less than 2.5% of the population.1 Some authors consider a statistical threshold of 4% for its definition.2 Morphological anomalies are classified as major, when their presence results in medical consequences for the individual, and as minor, when they do not generate such effects.2 The presence of minor morphological anomalies is considered an indicator of an abnormal embryological development process; therefore, studies have already indicated a correlation between minor morphological and major anomalies.2–4
Most studies on the frequency of morphological characteristics assessed newborns,2–5 and it is known that morphological characteristics may change according to age.6–11
The most recent survey on the frequency of morphological characteristics was carried out by Merks et al. in a sample of Dutch children aged between 8 and 14 years.12
There are no data on the frequency of morphological characteristics in a sample of Brazilian children. Additionally, the definition of a minor morphological anomaly involves a statistical concept. Based on these assumptions, this study aimed to determine the frequency of 82 morphological characteristics in a sample of children with typical development and to verify the influence of the variables age, gender, and ethnicity on their frequency.
MethodsSample selectionThe selected children met the following inclusion criteria: age between 3 and 13 years and typical developmental history, characterized by the absence of neuropsychomotor developmental delay and/or psychiatric disorders.
Statistical considerationsConsidering a 95% confidence level and a 5% confidence interval, and based on previous literature data on the frequency of minor anomalies in the population,2–4 a sample of 200 children was estimated. To compensate for possible losses, the study included 239 children.
Categorical variables were described as frequencies. To compare the frequencies of the morphological characteristics with those already described, the Z-test was used to compare between two proportions.
To determine whether the frequency of each anomaly showed a statistically significant difference according to gender, age, and ethnicity, the chi-squared test or Fisher's exact test was used. The results with p≤0.05 were considered significant. Statistical analysis was carried out using the SPSS software for statistical analysis (IBM Corp. Released 2011, IBM SPSS Statistics for Windows, Version 20.0, NY, USA).
Protocol use and morphological evaluation of the childrenChildren were evaluated according to a protocol containing 82 morphological characteristics based on the definition of the London Dysmorphology Database (LDDB), which lists approximately 2000 characteristics. The protocol used to evaluate the 82 characteristics has been previously used by Miles et al. to evaluate children with autism spectrum disorder (ASD).13 This protocol is being validated for use in children with ASD in Brazil, and part of this process depends on its application in children with typical development. Thus, the authors chose to apply this protocol to the present sample.
The definition of some morphological characteristics was changed in relation to the previous definition given by the LDDB, after a consensus among four geneticists (authors of the study), aiming to make them more objective. The characteristics with the description after the cultural adaptation are shown in Table 1.
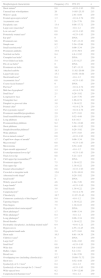
Frequency of morphological characteristics found.
| Morphological characteristic | Frequency (%) | 95% CI | n |
|---|---|---|---|
| Short staturea | 0.8 | −0.33–1.93 | 239 |
| Unusual hair whorl/pattern | 20 | 14.65–25.35 | 215 |
| Widow's peak | 5.9 | 2.91–8.89 | 239 |
| Frontal upsweep/cowlicka | 1.3 | −0.14–2.74 | 239 |
| Asymmetric ears | 5 | 2.24–7.76 | 239 |
| Dysplastic ears | 13.4 | 9.08–17.72 | 239 |
| Large ears (macrotia)a | 0.4 | −0.4–1.2 | 239 |
| Low-set earsa | 0.8 | −0.33–1.93 | 239 |
| Posteriorly rotated earsa | 0.8 | −0.33–1.93 | 239 |
| Ear pitsa | 0 | DNA | 239 |
| Prominent ears | 9.6 | 5.87–13.33 | 239 |
| Simple ears | 9.2 | 5.54–12.86 | 239 |
| Small ears/microtiaa | 1.7 | 0.06–3.34 | 239 |
| Prominent antihelix | 33.9 | 27.9–39.9 | 239 |
| Notched ear helix | 8.4 | 4.8–11.92 | 239 |
| Crumpled ear helixa | 0 | DNA | 239 |
| Over-folded ear helix | 5.4 | 2.53–8.27 | 239 |
| Pits of ear helixa | 0 | DNA | 239 |
| Prominent ear helix | 9.6 | 5.87–13.33 | 239 |
| Attached earlobe | 16.3 | 11.62–20.98 | 239 |
| Large/wide nose | 15.1 | 10.56–19.64 | 239 |
| Short/small nosea | 0.4 | −0.4–1.2 | 239 |
| Asymmetric facea | 0.8 | −0.33–1.93 | 239 |
| Coarse facial featuresa | 0 | DNA | 239 |
| Flat facea | 1.3 | −0.14–2.74 | 239 |
| Mid-face hypoplasiaa | 1.3 | −0.14–2.74 | 239 |
| Small facea | 2.1 | 0.28–3.92 | 239 |
| Long/narrow face | 5 | 2.24–7.76 | 239 |
| Triangular face | 4.2 | 1.66–6.74 | 239 |
| Dimpled or grooved chin | 3.8 | 1.38–6.22 | 239 |
| Pointed china | 1.3 | −0.14–2.74 | 239 |
| Flat zygomatic regiona | 1.3 | −0.14–2.74 | 239 |
| Prominent mandible/prognathism | 2.9 | 0.77–5.03 | 239 |
| Small mandible/micrognathia | 2.5 | 0.52–4.48 | 239 |
| Long philtrum | 12.1 | 8.0–16.3 | 239 |
| Prominent/deep philtrum | 9.2 | 5.54–12.86 | 239 |
| Short philtrum | 8.4 | 4.88–11.92 | 239 |
| Simple/absent/flat philtruma | 2.1 | 0.28–3.92 | 239 |
| Wide philtrum | 2.9 | 0.77–5.03 | 239 |
| Down-turned cornersa | 0.8 | −0.33–1.93 | 239 |
| Cupid bow shape of moutha | 1.7 | 0.06–3.34 | 239 |
| Macrostomiaa | 0.8 | −0.33–1.93 | 239 |
| Microstomia | 2.5 | 0.52–4.48 | 239 |
| Open-mouth appearancea | 0.4 | −0.4–1.2 | 239 |
| Everted/prominent lower lipa | 0.8 | −0.33–1.93 | 239 |
| Thick lower lip | 8.8 | 5.21–12.9 | 239 |
| Cleft upper lip (nonmidline)a,b | 0 | DNA | 239 |
| Prominent upper lip | 7.5 | 1.38–6.22 | 239 |
| Thin upper lip | 3.8 | 1.38–6.22 | 239 |
| Enamel abnormalitiesa | 0.8 | −0.33–1.93 | 239 |
| Crowded or irregular teeth | 12.6 | 8.39–16.81 | 239 |
| Abnormal tooth shapea | 2.1 | 0.28–3.92 | 239 |
| Small teetha | 0 | DNA | 239 |
| Widely spaced teeth | 4.6 | 1.94–7.26 | 239 |
| Large handsa | 0.8 | −0.33–1.93 | 239 |
| Small hands | 3.8 | 1.38–6.22 | 239 |
| Camptodactylya | 1.3 | −0.14–2.74 | 239 |
| Clinodactyly | 16.7 | 11.97–21.43 | 239 |
| Cutaneous syndactyly of the fingersa | 0.4 | −0.4–1.2 | 239 |
| Tapering fingers | 3.8 | 1.38–6.22 | 239 |
| Thin fingers | 7.5 | 1.38–6.22 | 239 |
| Hypoplastic/short metacarpalsa | 0 | DNA | 239 |
| Short phalangesa | 1.7 | 0.06–3.34 | 239 |
| Wide phalangesa | 0.4 | −0.4–1.2 | 239 |
| Long phalangesa | 1.7 | 0.06–3.34 | 239 |
| Broad thumbs | 7.5 | 1.38–6.22 | 239 |
| Dystrophic (dysplastic), including striated nailsa | 0.4 | −0.41–1.21 | 235 |
| Hyperconvex | 8 | 4.55–11.45 | 238 |
| Hypoplastic/small nails | 2.9 | 0.77–5.03 | 238 |
| Short nails | 10.5 | 6.61–14.39 | 238 |
| Clubfoot varusa | 0 | DNA | 239 |
| Large feeta | 2.1 | 0.28–3.92 | 239 |
| Small feeta | 0.8 | −0.33–1.93 | 239 |
| Wide feet | 10.9 | 6.9–14.85 | 239 |
| Hallux valgus | 10 | 6.2–13.8 | 239 |
| Broad toes | 3.3 | 1.04–5.56 | 239 |
| Overlapping toes (including clinodactyly) | 65.7 | 59.68–71.72 | 239 |
| Short toes | 2.5 | 0.52–4.48 | 239 |
| Syndactyly of 2–3 toesa | 0.4 | −0.4–1.2 | 239 |
| Syndactyly of toes (except for 2–3 toes)a | 0.8 | −0.33–1.93 | 239 |
| Wide-spaced toes | 9.2 | 5.54–12.86 | 239 |
| Camptodactyly/hammer toesa | 0.4 | −0.4–1.2 | 239 |
For anthropometric data collection, a vertical anthropometer and a metric tape were used. During the morphological examination, the following were measured in addition to height; ears, hands, middle fingers, and middle toes. The curves used to define micro/macrotia; elongated/small feet; large/small hands; and elongated/short phalanges are those found in Smith's Recognizable Patterns of Human Malformation,14 using the ±2 SD (standard deviations) limit. A height-for-age measurement below the third percentile in the WHO curve was defined as short stature. The other characteristics were scored as absent or present.
The 239 children were evaluated by the first author of this study, who is also a geneticist, in two municipal schools in the city of Barueri (state of São Paulo, Brazil). It was decided to evaluate children from the public school system to prevent the ethnic selection bias that may occur in private schools.
Regulatory aspectsThis study was submitted to and approved by the Research Ethics Committee of UNIFESP. Children were evaluated after parents or tutors gave their authorization by signing the free and informed consent form.
ResultsOverall sample characteristicsA total of 239 children aged 3 to 13 years were evaluated in municipal schools of the city of Barueri (SP).
The mean age of the sample was 7 years and 9 months±2 years and 10 months, with a median of 7 years and 6 months. The sample comprised 111 male subjects (46.4%). Regarding ethnicity, the distribution of the analyzed subjects consisted of 62.3% white (n=149), 25.9% mixed-race (n=62), 10.9% African descendants (n=26), and 0.8% native Brazilians (n=2).
Determination of the frequency of morphological characteristicsTable 1 shows the frequencies of each assessed morphological characteristic.
Of the 82 morphological characteristics evaluated, 41 (50%) showed a frequency <4%, and could be considered as morphological anomalies. Therefore, one minor anomaly was observed in 42 subjects (17.5%), two anomalies in 12 subjects (5%), and three anomalies in six subjects (2.5%). Therefore, 60 children (25%) had at least one minor anomaly.
Determination of the frequency of morphological characteristics by genderOf the 82 evaluated characteristics, only two showed frequencies with significant differences when divided by gender: dysplastic ears (20.7% [13.6–28.2%] in 111 male subjects vs. 7% [2.58–11.4%] in 128 female subjects; p=0.002) and attached earlobe (10.8% [5.03–16.57%] in 111 male subjects vs. 21.2% [14.1–28.28%] in 128 female subjects; p=0.032.
Determination of the frequency of morphological characteristics by age groupThe 239 study subjects were grouped into five groups with different age ranges: group I, from 3 to 5 years; Group II, from 5 years and 1 month to 7 years; Group III, from 7 years and 1 month to 9 years; Group IV, from 9 years and 1 month to 11 years; and group V, from 11 years and 1 month to 13 years.
Five characteristics showed significant frequency variations depending on age: widow's peak, prominent antihelix, prominent upper lip, crowded teeth, and clinodactyly.
The first of the characteristics showed a statistically significant difference when comparing group II with group III (1.6% vs. 12.5%; p=0.032); the second characteristic, when comparing groups I vs. II; II vs. III; III vs. IV (14.8% vs. 31.7% vs.57.5% vs. 34.2%; p<0.05 in all comparisons); the third, when comparing groups II x III (11.1% vs. 0.0%; p=0.041); the fourth, when comparing groups II vs. III (4.2% vs. 17.5%; p=0.044); and the fifth, when comparing groups I vs. II (29.6% vs. 12.7%; p=0.024).
Age did not influence the frequency of individuals who had at least one minor morphological anomaly. Group I had 22.2% of subjects with at least one minor anomaly; group II, 19.6%; group III, 30.7%; group IV, 32.4%; and group V, 36.3% (p=0.451).
Determination of the frequency of morphological characteristics by ethnicityThe proportion of individuals with at least one morphological anomaly did not present a statistically significant difference between the ethnic groups; 23.9%, 30.7%, and 34.4% of white, African-descendants, and mixed-race individuals, respectively, presented at least one minor morphological anomaly (p=0.407). The only characteristics that showed variations according to the ethnicity were: prominent antihelix (30.2% vs. 23.0% vs. 48.3% vs. 0% in white, African descendants, mixed-race, and native Brazilians, respectively; p=0.026), and “camptodactyly” (0% vs. 7.7% vs. 1.6% vs. 0% in white, African descendants, mixed-race, and native Brazilians, respectively; p=0.025).
DiscussionIn general, a frequency of at least 25% of individuals with at least one morphological anomaly was observed in the present sample. The frequencies of the morphological characteristics, when compared with those already described in the literature, showed discrepancies. When stratifying children by age, ethnicity, and gender, the variables age and ethnicity appeared to influence the frequency of characteristics.
Frequency of identified morphological characteristicsConsidering the 4% threshold to define a morphological anomaly, only 41 of the assessed characteristics could be considered as such. Most of these characteristics (39) are minor morphological anomalies, except upper lip cleft non-midline and short stature, which may have clinical implications and association with malformations and skeletal dysplasias, respectively, being considered major morphological anomalies.12
In the present study, 25% of the sample had at least one minor anomaly.
Marden et al.,2 when evaluating newborns, found a prevalence of 14.2% of individuals with at least one minor morphological anomaly without an associated major morphological anomaly; Mèhes et al.,3 a prevalence of 16.3%; Leppig et al.,4 a prevalence of 39.9%; and Tsai et al.,5 a prevalence of 43.3% in Chinese newborns.
The difference in frequencies found between the studies can be justified by the number of characteristics assessed, the evaluation method, and the ethnicity of the assessed children.
The 41 characteristics that were not considered as morphological anomalies – as they were observed in over 4% of the present sample – are morphological variants or normal characteristics (frequency >50%).3,4
Influence of the variables age, gender, and ethnicity on the observed characteristicsData are scarce on the influence of gender on the morphological characteristics of individuals. Marden et al.2 did not address the question of the influence of gender on the morphological anomalies of the assessed newborns. Leppig et al.4 also did not consider this issue; however, they stated that prominent heel, for instance, was an anomaly found only in girls.
In contrast with Leppig et al.4 and Marden et al.,2 Tsai et al.5 emphasized that variables such as gender, maternal age, and gestational age did not influence the frequency of anomalies found in their sample. The influence of gender on morphological variants was not assessed in any of them.
The present study demonstrated that, of the 82 morphological characteristics assessed, only two showed a statistically significant difference when considering gender: dysplastic ears and attached earlobe. These two characteristics, due to their frequency, would be considered morphological variants. For all other morphological variants and morphological anomalies, no influence of gender was observed on the identified frequencies.
In short, gender is a variable that does not appear to influence the morphological characteristics considered morphological anomalies.
Regarding the influence of the age range on the frequency of the assessed characteristics, it is known that genetic syndrome phenotypes, as well as the individuals’ morphological characteristics, change over time6–11; however, none of the aforementioned studies allowed the determination of the age group interference on the frequency of the identified morphological characteristics.
The present study was a pioneer in evaluating the influence of this variable. All characteristics that showed statistically significant variations in frequency according to age were morphological variants. The characteristics that showed any variation in their frequency according to age were: widow's peak, prominent antihelix, prominent upper lip, crowded teeth, and clinodactyly.
The onset of the characteristic crowded teeth after 7 years of age is perhaps due to the age group, when deciduous teeth start to be replaced by permanent dentition.
The characteristics widow's peak and prominent antihelix presented increased frequency with age. This may reflect the fact that some characteristics, even though they may be present from birth, are easier to identify in older age groups. In contrast, clinodactyly is more easily perceived in younger age groups.
Merks et al.,12 when comparing the frequency of characteristics found in their study on schoolchildren with the frequency identified in previous studies on newborns, also concluded that there is an important influence of age on the individual's phenotype.
These findings show that studies on the frequency of morphological characteristics with larger samples in specific age groups are important to determine what is or what is not considered a morphological anomaly for that specific age group.
All characteristics that varied according to age range were previously considered as morphological variants. Age did not influence the frequencies observed for minor morphological anomalies.
Ethnic aspects are noteworthy, since the morphological characteristics of skin color and facial features are used to categorize what the literature calls ethnicity and currently, through genomic studies, as ancestry.
Demographic statistics use the self-declared skin color as an indicator of ancestry. Thus, according to data from the Brazilian Institute of Geography and Statistics (Instituto Brasileiro de Geografia e Estatística [IBGE], 2010 census),15 the Brazilian population consists of 47.7% of white; 43.1% of mixed-race; 7.6% of African descendants; 1.1% of Asian descendants; and 0.4% of native Brazilian individuals. The use of the chi-squared test of adherence indicated that there was a difference between the distribution of the present sample regarding ethnicity in relation to the Brazilian population (p<0.001).
Such difference is predictable, since in the present study ethnic designation was derived from observation and physical examination, whereas that of IBGE is self-reported. In turn, the miscegenation of the Brazilian population is considered one of the widest in the world, and information on the morphological phenotype, either determined by physical characteristics or self-declared, is not a good predictor of genomic ancestry.16,17
The absence of a statistically significant difference between the proportion of individuals with morphological anomalies, when considering ethnicity, was expected, since morphological anomalies represent intrinsic developmental alterations and there would be no reason for them to predominate in a particular ethnicity. The fact that only two of the 82 morphological features showed significant differences when stratified by ethnicity can be justified by the evaluator's ethnic considerations when defining characteristics (e.g., thick lower lip).
Comparison with the study by Merks et al.12Data on the frequency of morphological characteristics in children's samples are scarce in the literature.
In this sense, the present data are better compared with those by Merks et al.12 The authors were pioneers in determining the frequency of morphological characteristics in a sample of the Dutch population with a median age of 11 years. Based on the data obtained in the assessment of 683 characteristics (using LDDB) in 923 children, frequencies were established, allowing the classification of the characteristics as morphological anomalies or variants.
Of the 73 morphological characteristics that were evaluated in both studies and had a frequency other than zero, in 43 (59%) a statistically significant difference was observed between the frequencies found in the present study and those in the study by Merks et al.12 The characteristics showing any discrepancy are shown in Table 2.
Morphological characteristics found with significant statistical difference in comparisons with the study by Merks et al.12
| Morphological characteristic | Observed frequency (%) (Perrone, 2016) | Observed frequency (%) (Merks et al., 2006)12 | Z-value | p-value |
|---|---|---|---|---|
| Unusual hair whorl/pattern | 20 | 0.1 | −13.6 | <0.001 |
| Frontal upsweep/cowlick | 1.3 | 15.8 | 6.0 | <0.001 |
| Asymmetric ears | 5.0 | 1.7 | −2.95 | 0.003 |
| Dysplastic ears | 13.4 | 0.0 | −11.2 | <0.001 |
| Prominent ears | 9.6 | 2.6 | −4.9 | <0.001 |
| Simple ears | 9.2 | 0.1 | −8.9 | <0.001 |
| Notched ear helix | 8.4 | 0.0 | −8.8 | <0.001 |
| Prominent ear helix | 9.6 | 2.6 | −4.9 | <0.001 |
| Large/wide nose | 15.1 | 0.4 | −11 | <0.001 |
| Short/small nose | 0.4 | 9.3 | 4.65 | <0.001 |
| Hypoplasia of the middle third of the face | 1.3 | 0 | −3.42 | <0.001 |
| Long/narrow face | 5.0 | 2.2 | −2.43 | 0.01 |
| Triangular face | 4.2 | 0.1 | −5.79 | <0.001 |
| Prominent mandible/prognathism | 2.9 | 0.3 | −3.88 | <0.001 |
| Long philtrum | 12.1 | 3.1 | −5.68 | <0.001 |
| Prominent/deep philtrum | 9.2 | 1.8 | −5.63 | <0.001 |
| Short philtrum | 8.4 | 2.8 | −3.92 | <0.001 |
| Simple/absent/flat philtrum | 2.1 | 5.3 | 2.1 | 0.03 |
| Down-turned corners | 0.8 | 0.1 | −1.97 | 0.047 |
| Open-mouth appearance | 0.4 | 0.0 | −1.96 | 0.04 |
| Thick lower lip | 8.8 | 14.5 | 2.32 | 0.02 |
| Prominent upper lip | 7.5 | 2.1 | −4.29 | <0.001 |
| Thin upper lip | 3.8 | 8.9 | 2.66 | 0.007 |
| Enamel abnormalities | 0.8 | 0 | −2.78 | 0.005 |
| Irregular or crowded teeth | 12.6 | 0 | −10.9 | <0.001 |
| Abnormal tooth shape | 2.1 | 0.1 | −3.8 | <0.001 |
| Widely spaced teeth | 4.6 | 0 | −6.54 | <0.001 |
| Large hands | 0.8 | 0 | −2.78 | 0.005 |
| Small hands | 3.8 | 0 | −5.9 | <0.001 |
| Camptodactyly | 1.3 | 0 | −3.4 | 0.006 |
| Clinodactyly | 16.7 | 3.6 | −12.6 | <0.001 |
| Tapering fingers | 3.8 | 0.4 | −4.36 | <0.001 |
| Broad thumbs | 7.5 | 0.9 | 6.2 | <0.001 |
| Hyperconvex | 8.0 | 0 | −8.65 | <0.001 |
| Hypoplastic/small nails | 2.9 | 0.2 | −4.2 | <0.001 |
| Short nails | 10.5 | 0.9 | −7.9 | <0.001 |
| Large feet | 10.9 | 0.3 | −9.3 | <0.001 |
| Hallux valgus | 10.0 | 2.4 | −5.4 | <0.001 |
| Broad toes | 3.3 | 0.7 | −3.4 | <0.001 |
| Overlapping toes (including clinodactyly) | 65.7 | 0.3 | −26.7 | <0.001 |
| Short toes | 2.5 | 0.2 | −3.8 | <0.001 |
| Syndactyly of toes (except 2–3 toes) | 0.8 | 0 | −2.78 | 0.005 |
| Wide-spaced toes | 9.2 | 26.3 | 5.59 | <0.001 |
Some hypotheses can be raised to clarify this discrepancy: the ethnic composition of Merks’ sample was different from that of the present sample (the first one, consisting of white children, and the second one consisting of Brazilian children, the result of miscegenation); the age range of the evaluated patients was also different; the subjectivity and the continuity of some morphological characteristics makes their assessment observer-dependent.
Some examples will be used to illustrate the previously mentioned hypotheses.
Regarding the ethnic difference, it seems paradoxical that a lower frequency of children with thick lower lip was observed in the present sample when compared to that in Merks’12 sample (8.8% vs. 14.5%, respectively). However, as the ethnical criterion was considered in the definition of a thick lower lip, and as this characteristic is subjective and continuous, in the sample only children who had a very thick lower lip were considered as presenting this characteristic, leading to its.
Tsai et al.,5 after assessing 3345 Chinese newborns, verified that ethnicity influenced the frequency of morphological features (single palmar crease, ascending oblique palpebral fissure, and frontal bossing were observed at a frequency higher than 4% in a sample of Chinese newborns, being morphological variants in that sample).
The fact that some characteristics are continuous and subjective makes it difficult to define the limit to consider them as normal or altered, which may result in under- or overestimation of their frequencies.
This reasoning applies to clinodactyly, whose definition only states a “significant lateral bending, usually observed in the fifth finger”. This characteristic was found in 16.7% of the assessed individuals, in contrast to 3.6% in the Merks et al.12 sample. Probably, the latter authors considered higher degrees of clinodactyly during their evaluation. If the definition were clearer regarding the degree of acceptable bending, a similar frequency might have been observed.
Another assessed characteristic that showed high prevalence in the evaluated sample (65.7%) and could therefore be considered as a normal variant was overlapping toes (including clinodactyly). What led to this high prevalence was the inclusion of the term clinodactyly in the definition, since clinodactyly of the fifth toe in children is a common finding and has subjective evaluation.
The median age of the Merks et al.12 sample was different from the present sample (11 years vs. 7 years and 6 months, respectively). The age group of the patients may have influenced the difference in some findings. When the present sample was divided into different age groups, the influence of the age variable was observed.
Of the 43 characteristics that presented frequency discrepancy between the studies, 31 (72.1%) could be considered as morphological variants, one (2.4%) as a normal characteristic, and 11 (25.5%) as morphological anomalies. Of the 30 characteristics that showed similar frequencies between the studies, 22 (73.3%) could be considered morphological anomalies and eight (26.7%) as variants. This indicates that the chance of finding a morphological variant in the group of patients with a discrepancy in the assessed data was eight-fold higher than in the group without discrepancy (OR: 8; p<0.001; 95% CI: 2.7–23.0).
As the morphological variants are characterized by having a frequency above 4% and by a continuum of the characteristic, it is easy to understand they will be more difficult to evaluate, and therefore more susceptible to the discrepancy in frequency survey data in the literature.
Study limitationsThe evaluation of the morphological characteristics was carried out by only one examiner and only once; therefore, it was not possible to rule out inter- or intraobserver variations. Additionally, sample calculation was made based on the presence of at least one minor morphological anomaly in the population and not on the frequency of each them in particular; therefore, the differences not found between the different groups (when stratified by gender, age group, ethnicity, and when compared to the literature) do not necessarily mean that the groups are equal, since the difference may not have been observed due to lack of statistical power to detect them.
The present study determined and classified morphological characteristics in a sample of the Brazilian population aged 3–13 years, so that it was possible to determine what is a variant of normality and what is a morphological anomaly for this population. It showed that some morphological characteristics need to be standardized to facilitate their identification.
The study also demonstrated there is an important influence of age and ethnicity on the frequency of some characteristics; studies with larger samples, associating age and ethnicity to the frequency of the identified characteristics, are necessary to adequately classify a morphological characteristic.
Conflicts of interestThe authors declare no conflicts of interest.
Please cite this article as: Perrone E, Zanolla TA, Fock RA, Perez AB, Brunoni D. Determining the frequency of morphological characteristics in a sample of Brazilian children. J Pediatr (Rio J). 2017;93:592–600.
Study carried out at Universidade Federal de São Paulo (UNIFESP), São Paulo, SP, Brazil.


