
this study was performed to determine the predictive capacity of four different bioelectrical impedance analysis (BIA) devices in the assessment of adolescents, with and without a protocol.
Methodsa cross-sectional study was performed with 215 adolescents aged 10 to 14 years, of both genders, evaluated through anthropometry and body composition by dual energy X-ray absorptiometry (DXA) and by four different BIA devices, with and without a protocol. The following tests were used: Kolmogorov-Smirnov's, chi-squared, Student's t or Mann-Whitney's, Kruskal-Wallis's, Wilcoxon's, and kappa index. The ROC curves were constructed and the sensitivity, specificity, and positive and negative predictive values were calculated.
Resultsof the 215 adolescents, 44.2% had excessive body fat. The tetrapolar BIA device equipped with eight tactile electrodes showed more sensitivity and results that were closer to those obtained by DXA (area under the ROC curve [AUC] = 0.964 with protocol and AUC = 0.973 without protocol, p < 0.001), as well as greater agreement (k = 0.67 with protocol and k = 0.63 without protocol, p < 0.001). The evaluation without protocol was similar to that by DXA in most investigated situations (p > 0.05).
ConclusionBIA is capable of predicting alterations in adolescents’ body composition. When it is impossible to perform the assessment with a protocol, its results may be useful in population studies.
determinar a capacidade preditiva de quatro equipamentos distintos de bioimpedância elétrica (BIA) na avaliação de adolescentes, com e sem a realização de protocolo.
Métodosestudo transversal realizado com 215 adolescentes de 10 a 14 anos, de ambos os sexos, avaliados através da antropometria e da composição corporal pelo DEXA e por quatro equipamentos distintos de BIA, com e sem protocolo. Foram utilizados os testes estatísticos: Kolmogorov-Smirnov, do Qui-quadrado, t-Student ou Mann-Whitney, Kruskal-Wallis, Wilcoxon e Índice Kappa. Foram construídas curvas ROC e calculados os valores de sensibilidade, especificidade e preditivos positivo e negativo.
Resultadosdos adolescentes, 44,2% apresentaram excesso de gordura corporal. A BIA tetrapolar, equipada com oito eletrodos táteis, demonstrou-se mais sensível e com resultados mais próximos ao DEXA (AUC = 0,964 com protocolo e AUC = 0,973 sem protocolo, p < 0,001), apresentando, também, maior concordância (k = 0,67 com protocolo, e k = 0,63 sem protocolo, p < 0,001). A avaliação sem protocolo foi semelhante ao DEXA na maioria das situações investigadas (p > 0,05).
Conclusãoa BIA é um instrumento capaz de predizer distrofias relacionadas à gordura corporal de adolescentes. Na impossibilidade de realização do protocolo, seus resultados podem ser úteis em estudos populacionais.
The World Health Organization (WHO) defines adolescence as the period from 10 to 19 years, characterized by intense physical, psychological, and social changes. Rapid growth and nutritional vulnerability also characterize this phase, when there is consolidation of eating habits, which, when adequate, can become a protective factor for obesity, cardiovascular disease, and metabolic disorders in adulthood.1
According to the household budget survey (HBS) conducted by the Brazilian Institute of Geography and Statistics (Instituto Brasileiro de Geografia e Estatística - IBGE) in the years 2008 and 2009, excess body weight was identified in approximately 20% of the adolescent population of the metropolitan areas of Brazil.2
When weight increases due to excess body fat, it can lead to adolescent obesity, which has been considered a predictor of risk for cardiovascular disease, diabetes mellitus, dyslipidemia, and hypertension. Therefore, it is relevant to adequately estimate body composition in adolescence, as it is a period of great change, mainly as a result of puberty.3–6
It must be emphasized, however, that there is a need for methods used in body composition determination that are practical, fast, and easy to perform, with the possibility of being applicable to several working conditions, including in population-based studies in the field. Among these methods, bioelectrical impedance analysis (BIA) is highlighted, as it has all these characteristics at a relatively low cost, in addition to its portability and noninvasiveness.4,5,7–9
The use of previous preparations (protocols) for standardization of variables that affect body hydration is a recommendation to perform BIA.9–11 However, its use may be restricted by lack of adherence or difficulty to follow these requirements by the adolescent.
Given the importance of accurately determining body composition and the broad use of BIA, this study aimed to determine the predictive capacity of four different devices in the evaluation of adolescents with and without a protocol.
MethodsSampleThis was an epidemiological, cross-sectional study, with a population of 215 adolescents of both genders, aged between 10 years to 14 years, 11 months, selected by simple random sampling from all public and private schools in the age range of interest, located in urban and rural areas of the city of Viçosa, state of Minas Gerais, Brazil. The following inclusion criteria were used: interest in participating in the study; absence of prosthetics and/or pacemakers; absence of chronic diseases or use of continuous medication that could interfere with body hydration; and adherence to the recommended protocol to undergo BIA.
Sample selection was based on the total number of adolescents in the city at the age of interest in 2010.12 The sample was calculated using EpiInfo software, release 6.04 for cross-sectional studies, considering a total population of 5,754 individuals, the expected frequency of excess body fat of 17.5%, 13 and variability of 5%, totaling 214 individuals, with a confidence level of 95%.
The sample draw was conducted among all who met the inclusion criteria and returned the signed informed consent, respecting the proportionality of the number of students that each school had in each age group. When the adolescent did not want to participate or abandoned the study, a new draw was made to replace him/her.
The project was approved by the Ethics Committee on Human Research of Universidade Federal de Viçosa (protocol. N. 0140/2010); adolescents and their parents signed the consent form, prepared in accordance with standards established by 196/96 Resolution of the National Health Council.
Anthropometric assessmentWeight was measured on a digital scale with a maximum capacity of 150kg and a sensitivity of 50g, whereas height was measured using a portable stadiometer with an extension of 2.13 m and 0.1cm resolution. Measurements were made in duplicate, allowing the use of the mean values between the two measurements. In cases where the difference exceeded 0.5cm, new measurements were performed. The body mass index (BMI)/age and height/age indices were calculated to characterize the population, using as reference the cutoffs (Z-scores), established by the WHO. 14
Body compositionThe body fat percentage (BF%) was measured by a DXA equipment (Lunar Prodigy Advance DXA System - analysis version: 13,31, GE Healthcare) and estimated by the following BIA equipment: tetrapolar horizontal Biodynamics®, model 450 (BIA 1), tetrapolar vertical Tanita®, model BC-558 (BIA 2), tetrapolar vertical Biospace®, equipped with eight tactile electrodes, InBody® 230 model (BIA 3), and bipolar vertical Tanita®, model 2220 (BIA 4). BF% was analyzed according to the classification proposed by Lohman15, considering as excess body fat values ≥ 20% for males and ≥ 25% for females, and as low body fat percentage < 10% for males and < 15% for females. Assessment by BIA was performed in two stages, following the protocol proposed by Barbosa16 and later, within an average time period of 9±4 days, without the protocol.
The protocol involved previous preparation aiming to standardize the hydration status to undergo the BIA assessment and consisted of the following: be at least seven days after the last menstrual period and seven days before the next; undergo complete fasting in the previous 12hours; refrain from physical exercises in the previous 12hours; no alcohol consumption in the previous 48hours; no use of diuretics for at least seven days before the assessment; and urination 30minutes before the assessment. Adolescents were also asked to remove metal objects such as earrings, rings, watches, and others, which could interfere with the passage of electrical current.
Statistical analysisThe Kolmogorov-Smirnov normality test was performed to determine variable distribution (parametric or not) and thus choose the most appropriate statistical test to evaluate data. Parameters with normal distribution were expressed as mean and standard deviation; those with non-normal distribution were expressed as median and range.
The chi-squared test was used to compare prevalence. In case of continuous variables, Student's t or Mann-Whitney's tests were performed to compare two, and Kruskal-Wallis's test was used to compare three or more; Wilcoxon's test was used when two evaluations were performed by the same individuals using the same equipment (with and without protocol).
The kappa index was used to determine the agreement between the assessments by BIA and DXA, classifying it according to the criteria by Landis and Koch17, with the following concordances: from 0 to 0.19: poor; 0.2 to 0.39: weak; 0.4 - 0.59: moderate; 0.6 to 0.79: substantial; 0.8 to 1.0: almost perfect.
ROC curves were constructed to verify the capacity of BIA in predicting excess body fat when compared to DXA. Areas under the curve (AUC) were calculated with their respective 95% confidence intervals. The null hypothesis would be accepted with an AUC value ≤ 0.50. Sensitivity (probability of a test being positive, if there is an alteration), specificity (probability of a test being negative, if there is no alteration), positive predictive values (proportion of true positives among all individuals who tested positive), and negative predictive values (proportion of true negatives among all individuals who tested negative) were calculated for each device, with and without protocol; excess body fat was considered as the altered variable.18
The database was created using Microsoft Office Excel 2007 with duplicate entries; statistical analyses were performed using the SIGMA STAT software, release 3.2 and MEDCALC statistical software, release 12.2.1.0. Significance level was set at p < 0.05.
ResultsSubjects’ characteristicsA total of 215 adolescents (of whom 53.5%, n = 115, were females), participated in the study, presenting the following median values for age, weight, and BMI: 11.9 years (range: 10.1 to 14.9), 42.2kg (range: 25.1 to 92.8), and 18.0kg/m2 (range: 12.5 to 33.8). The mean height was 151.6±10.0cm. There was no difference regarding these parameters between genders (p > 0.05).
Regarding the nutritional status, 2.8% (n = 6) had short stature for age, and 3.3% (n = 7) had low BMI for age, 16.7% (n = 36) were overweight, and 8.4% (n = 18) were obese.
DXA assessment showed a prevalence of 44.2% (n = 95) of excess BF% and 13.5% (n = 29) of low BF%.
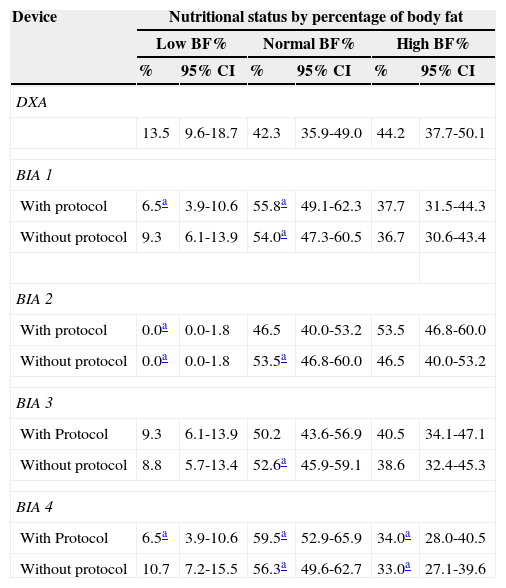
Comparison of assessments with and without protocolTable 1 shows the prevalence of low BF%, normal BF%, and high BF% measured by DXA and estimated by BIA, with and without protocol. It was observed that the evaluation carried out by all BIA devices with a protocol identified more adolescents with high BF% than without protocol. Regarding the increase in BF%, BIA 4 was the only device that underestimated the prevalence (p < 0.05), whereas the others were similar to DXA in both assessments (p > 0.05). It is noteworthy that BIA 3 showed prevalence more similar to DXA in all situations (p > 0.05) except for normal BF% without protocol, where it overestimated it (p < 0.05).
Nutritional status by percentage of body fat in adolescents assessed by DXA and four bioelectrical impedance devices, with and without protocol.
| Device | Nutritional status by percentage of body fat | |||||
|---|---|---|---|---|---|---|
| Low BF% | Normal BF% | High BF% | ||||
| % | 95% CI | % | 95% CI | % | 95% CI | |
| DXA | ||||||
| 13.5 | 9.6-18.7 | 42.3 | 35.9-49.0 | 44.2 | 37.7-50.1 | |
| BIA 1 | ||||||
| With protocol | 6.5a | 3.9-10.6 | 55.8a | 49.1-62.3 | 37.7 | 31.5-44.3 |
| Without protocol | 9.3 | 6.1-13.9 | 54.0a | 47.3-60.5 | 36.7 | 30.6-43.4 |
| BIA 2 | ||||||
| With protocol | 0.0a | 0.0-1.8 | 46.5 | 40.0-53.2 | 53.5 | 46.8-60.0 |
| Without protocol | 0.0a | 0.0-1.8 | 53.5a | 46.8-60.0 | 46.5 | 40.0-53.2 |
| BIA 3 | ||||||
| With Protocol | 9.3 | 6.1-13.9 | 50.2 | 43.6-56.9 | 40.5 | 34.1-47.1 |
| Without protocol | 8.8 | 5.7-13.4 | 52.6a | 45.9-59.1 | 38.6 | 32.4-45.3 |
| BIA 4 | ||||||
| With Protocol | 6.5a | 3.9-10.6 | 59.5a | 52.9-65.9 | 34.0a | 28.0-40.5 |
| Without protocol | 10.7 | 7.2-15.5 | 56.3a | 49.6-62.7 | 33.0a | 27.1-39.6 |
BIA 1, biodynamics horizontal tetrapolar device, model 450; BIA 2, tanita vertical tetrapolar device, model BC-558; BIA 3, biospace equipped with eight tactile electrodes, model InBody 230; BIA 4, Tanita vertical bipolar device, model 2220; BF%, percentage of body fat; CI, confidence interval; DXA, dual-energy X-ray absorptiometry.
Chi-squared test: BIA vs. DXA.
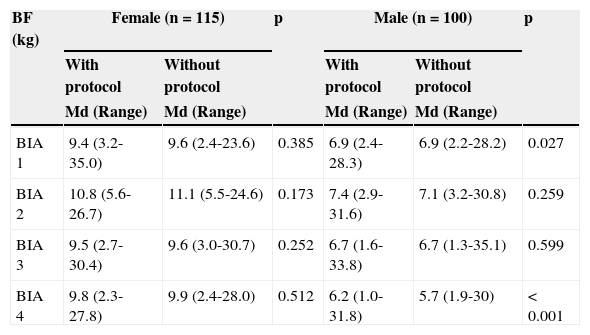
When compared, all BIA devices had similar values for body fat in kg (BF) when compared to DXA in both with and without protocol assessments (p > 0.05), considering the total population. Regarding the stratification by gender, only the male gender, assessed by BIA 2, was higher than DXA (p = 0.011 with protocol and p = 0.017 without protocol). The comparison of BIA devices by gender is shown in Table 2.
Body fat determined by different electrical bioimpedance devices, with and without protocol, by gender, in adolescents.
| BF (kg) | Female (n=115) | p | Male (n=100) | p | ||
|---|---|---|---|---|---|---|
| With protocol | Without protocol | With protocol | Without protocol | |||
| Md (Range) | Md (Range) | Md (Range) | Md (Range) | |||
| BIA 1 | 9.4 (3.2-35.0) | 9.6 (2.4-23.6) | 0.385 | 6.9 (2.4-28.3) | 6.9 (2.2-28.2) | 0.027 |
| BIA 2 | 10.8 (5.6-26.7) | 11.1 (5.5-24.6) | 0.173 | 7.4 (2.9-31.6) | 7.1 (3.2-30.8) | 0.259 |
| BIA 3 | 9.5 (2.7-30.4) | 9.6 (3.0-30.7) | 0.252 | 6.7 (1.6-33.8) | 6.7 (1.3-35.1) | 0.599 |
| BIA 4 | 9.8 (2.3-27.8) | 9.9 (2.4-28.0) | 0.512 | 6.2 (1.0-31.8) | 5.7 (1.9-30) | < 0.001 |
BIA 1, biodynamics horizontal tetrapolar device, model 450; BIA 2, tanita vertical tetrapolar device, model BC-558; BIA 3, biospace equipped with eight tactile electrodes, model InBody 230; BIA 4, tanita vertical bipolar device, model 2220; BF%, body fat; Md, median.
Wilcoxon test (BIA with vs. BIA without protocol).
It was observed that, for females, the protocol did not influence any of the assessments, whereas for males, BIA 2 and 3 also showed similar values in both situations (p > 0.5). It is noteworthy, however, that BIA 3 did not differ from DXA, contrary to that occurred with BIA 2, which overestimated BF in both situations (p < 0.05).
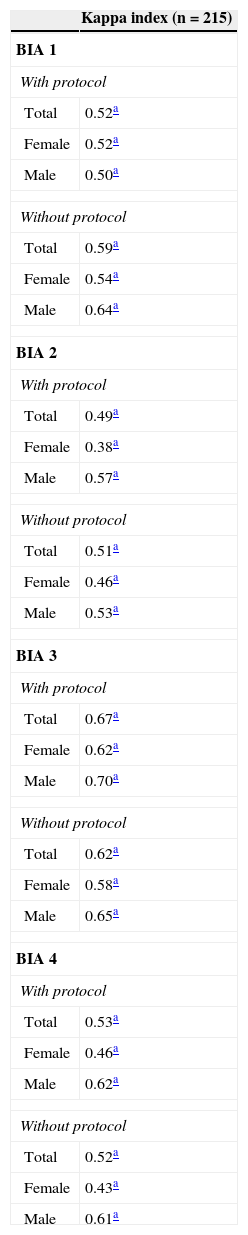
Agreement between the assessments by BIA and by DXAWhen analyzing the agreement between DXA evaluations and by each of the BIA devices (Table 3), significance were observed among all of them (p < 0.001). However, BIA 3 again showed better results, with a strong agreement for the two assessments in both genders.
Agreement between body fat assessment in adolescents performed by different bioelectrical impedance devices and DXA.
| Kappa index (n=215) | |
|---|---|
| BIA 1 | |
| With protocol | |
| Total | 0.52a |
| Female | 0.52a |
| Male | 0.50a |
| Without protocol | |
| Total | 0.59a |
| Female | 0.54a |
| Male | 0.64a |
| BIA 2 | |
| With protocol | |
| Total | 0.49a |
| Female | 0.38a |
| Male | 0.57a |
| Without protocol | |
| Total | 0.51a |
| Female | 0.46a |
| Male | 0.53a |
| BIA 3 | |
| With protocol | |
| Total | 0.67a |
| Female | 0.62a |
| Male | 0.70a |
| Without protocol | |
| Total | 0.62a |
| Female | 0.58a |
| Male | 0.65a |
| BIA 4 | |
| With protocol | |
| Total | 0.53a |
| Female | 0.46a |
| Male | 0.62a |
| Without protocol | |
| Total | 0.52a |
| Female | 0.43a |
| Male | 0.61a |
BIA 1, biodynamics horizontal tetrapolar device, model 450; BIA 2, tanita vertical tetrapolar device, model BC-558; BIA 3, biospace equipped with eight tactile electrodes, model InBody 230; BIA 4, tanita vertical bipolar device, model 2220; Kappa index: BIA vs. DXA.
The other BIA devices also showed strong agreement for the male gender. For the total population and the female gender, agreement was considered moderate.
BIA 2 presented the worst results; the female gender, with protocol, was considered the weakest among all analyzed data.
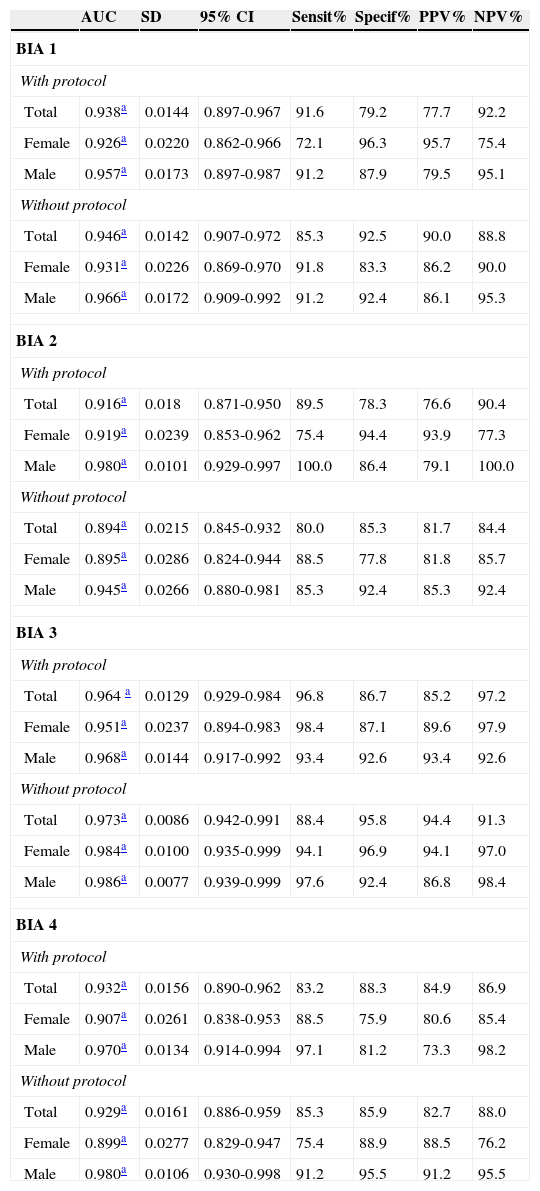
Predictive capacity of electrical bioimpedance, with and without protocolTable 4 shows the AUC, sensitivity, and specificity, as well as positive and negative predictive values for each device and gender, at the assessments with and without protocol, obtained after creating the ROC curves, considering the excess BF. It was observed that BIA 3, without protocol, showed the highest areas for the total population and for both genders, after stratification.
Predictive capacity of excess body fat in different electrical bioimpedance devices compared to DXA, by gender, in the evaluation of adolescents, 2011.
| AUC | SD | 95% CI | Sensit% | Specif% | PPV% | NPV% | |
|---|---|---|---|---|---|---|---|
| BIA 1 | |||||||
| With protocol | |||||||
| Total | 0.938a | 0.0144 | 0.897-0.967 | 91.6 | 79.2 | 77.7 | 92.2 |
| Female | 0.926a | 0.0220 | 0.862-0.966 | 72.1 | 96.3 | 95.7 | 75.4 |
| Male | 0.957a | 0.0173 | 0.897-0.987 | 91.2 | 87.9 | 79.5 | 95.1 |
| Without protocol | |||||||
| Total | 0.946a | 0.0142 | 0.907-0.972 | 85.3 | 92.5 | 90.0 | 88.8 |
| Female | 0.931a | 0.0226 | 0.869-0.970 | 91.8 | 83.3 | 86.2 | 90.0 |
| Male | 0.966a | 0.0172 | 0.909-0.992 | 91.2 | 92.4 | 86.1 | 95.3 |
| BIA 2 | |||||||
| With protocol | |||||||
| Total | 0.916a | 0.018 | 0.871-0.950 | 89.5 | 78.3 | 76.6 | 90.4 |
| Female | 0.919a | 0.0239 | 0.853-0.962 | 75.4 | 94.4 | 93.9 | 77.3 |
| Male | 0.980a | 0.0101 | 0.929-0.997 | 100.0 | 86.4 | 79.1 | 100.0 |
| Without protocol | |||||||
| Total | 0.894a | 0.0215 | 0.845-0.932 | 80.0 | 85.3 | 81.7 | 84.4 |
| Female | 0.895a | 0.0286 | 0.824-0.944 | 88.5 | 77.8 | 81.8 | 85.7 |
| Male | 0.945a | 0.0266 | 0.880-0.981 | 85.3 | 92.4 | 85.3 | 92.4 |
| BIA 3 | |||||||
| With protocol | |||||||
| Total | 0.964 a | 0.0129 | 0.929-0.984 | 96.8 | 86.7 | 85.2 | 97.2 |
| Female | 0.951a | 0.0237 | 0.894-0.983 | 98.4 | 87.1 | 89.6 | 97.9 |
| Male | 0.968a | 0.0144 | 0.917-0.992 | 93.4 | 92.6 | 93.4 | 92.6 |
| Without protocol | |||||||
| Total | 0.973a | 0.0086 | 0.942-0.991 | 88.4 | 95.8 | 94.4 | 91.3 |
| Female | 0.984a | 0.0100 | 0.935-0.999 | 94.1 | 96.9 | 94.1 | 97.0 |
| Male | 0.986a | 0.0077 | 0.939-0.999 | 97.6 | 92.4 | 86.8 | 98.4 |
| BIA 4 | |||||||
| With protocol | |||||||
| Total | 0.932a | 0.0156 | 0.890-0.962 | 83.2 | 88.3 | 84.9 | 86.9 |
| Female | 0.907a | 0.0261 | 0.838-0.953 | 88.5 | 75.9 | 80.6 | 85.4 |
| Male | 0.970a | 0.0134 | 0.914-0.994 | 97.1 | 81.2 | 73.3 | 98.2 |
| Without protocol | |||||||
| Total | 0.929a | 0.0161 | 0.886-0.959 | 85.3 | 85.9 | 82.7 | 88.0 |
| Female | 0.899a | 0.0277 | 0.829-0.947 | 75.4 | 88.9 | 88.5 | 76.2 |
| Male | 0.980a | 0.0106 | 0.930-0.998 | 91.2 | 95.5 | 91.2 | 95.5 |
AUC, area under the curve; BIA 1, biodynamics horizontal tetrapolar device, model 450; BIA 2, tanita vertical tetrapolar device, model BC-558; BIA 3, biospace equipped with eight tactile electrodes, model InBody 230; BIA 4, tanita vertical bipolar device, model 2220; CI, confidence interval; NPV, negative predictive value; PPV, positive predictive value; SD, standard deviation; Sensit, Sensitivity; Specif, specificity.
ROC curve: BIA vs. DXA.
The AUCs were also compared for evaluations with and without protocol, performed for each gender and for each device and no differences were observed (p > 0.05).
DiscussionThe nutritional status of the adolescents studied followed the trend indicated by the HBS, with a low frequency of malnutrition and higher prevalence of overweight. Approximately 25% of the adolescents in the city were overweight, higher than the national prevalence (20.5%) and that found in another study with adolescents from the state of Minas Gerais (20.1%), but within the range found in the Southeastern region of Brazil (20% to 27%).2,19 Comparing the prevalence of alterations in BF% (43%) and BMI/age (25%), it is clear that the index failed to identify several adolescents who already had these alterations, confirming the importance of methods to predict excess BF even in those who present normal weight.
It is worth mentioning that the BMI criteria should not be used alone. Adolescents with an adequate BMI may have a high BF% and may eventually have risks of morbidity similar to those with high BMI, especially in females 20–24, highlighting the need for BF% assessment in order to identify possible risk factors for health.
Excess BF may be related to genetic, metabolic, physiological, and lifestyle components, such as sedentary lifestyle and poor eating habits. It is associated with insulin resistance, dyslipidemia, and metabolic syndrome, some of the risk factors for cardiovascular disease that have already been identified in adolescents at the age group analyzed in this study, corroborating the importance of monitoring these young individuals.20,21,23,25,26
BIA devices were able to predict increases in BF%, but showed distinct characteristics when the protocol influence was analyzed. In general, when compared with DXA, it was observed that both assessments behaved similarly in relation to the prevalence of excess BF, and only BIA 4 showed a different result (p < 0.05). BIA 3 was shown to be the most stable device, differing from DXA in only one situation (normal BF without protocol), but similar to DXA regarding the prevalence of excess or low BF%, with and without the protocol. Therefore, for a prevalence study, BIA 3 appears to be the most adequate device, while BIA 4 is the least recommended.
BIA 1, 3, and 4 were similar to DXA when comparing BF in kg for both genders at the two assessments, indicating they are adequate for use. BIA 2, when evaluating the female gender, could also be considered useful. These devices are portable, easy to use and transport, and despite the price variation among them, are much more affordable than DXA. For males, however, BIA 2 was not shown to be an accurate option.
The results showed that the protocol did not influence results in female adolescents, which, together with the similarity to DXA, demonstrates that the assessment without protocol could be used for females using any of the devices. For males, although devices 1 and 4 were influenced by the protocol, both assessments were similar to that of DXA. Thus, it is suggested that when using these devices, one of the two forms of assessment should be standardized.
The protocol used aimed to standardize factors that may influence BIA assessment accuracy, mainly related to the state of hydration, such as beverage consumption, menstrual period, and physical activity. Guidelines related to the technical aspects of the devices, which were provided by the manufacturers, were also observed.16
BIA is based on the passage a low-intensity electric current through the body of the individual; impedance, resistance, reactance, and phase angle values are determined, through which body composition is estimated. These values are strongly related to body hydration, as water is a good conductor of electricity, while fat is not. If the tissues are in atypical conditions of hydration, the method accuracy is compromised.10,27
The protocol, however, can compromise adherence of adolescents in population studies, as it requires effort and interest to follow the established requirements. It was observed, however, that some of the analyzed devices, particularly BIA 3, had good results even without the proposed standardization, suggesting an alternative when it is not possible to conduct the protocol.
There have been no studies in the literature that verified the influence of the protocol on the use of BIA in adolescents. However, some studies investigated differences between assessments after the consumption of food, one of the items that comprised the protocol used in the present study.
Vilaça et al.,28 when evaluating 41 elderly Brazilian males, used data obtained by tetrapolar BIA and compared to DXA, after fasting and after eating a meal. No differences were observed between the measurements (p > 0.05). These results corroborate those found in the present study, confirming the usefulness of the assessment without protocol.
Conversely, Gallagher et al.,11 when studying the influence of meals with different compositions on the results estimated by BIA in 28 Australian adults of both genders, reported that there was a significant variation in impedance and consequently, on BF estimate, after consumption of meals. Similar results were demonstrated by Slinde and Rossander-Hulthen,10 when they evaluated healthy adults by tetrapolar BIA method, before and after the consumption of three standardized meals during a 24-hour period. The authors concluded that the impedance measurement decreased approximately two to four hours after a meal (p < 0.05), causing variation of up to 8.8% (women) and 9.9% (men) in BF%, underestimating it.
The two studies presented opposite results to those of the present study, showing the influence of the protocol on the assessments, but because they were not compared with DXA, it is impossible to know whether the assessment after consumption of meals would also be helpful.
Regarding the agreement of assessments with BIA and DXA, BIA had three with better results, and although none of the devices had a kappa index > 0.8 (almost perfect agreement)17, when analyzed together with the other results, it was observed that the results confirmed the possibility of using the assessment without protocol.
The ROC curve analysis showed again the usefulness of BIA in the absence of a protocol. There was no difference between areas with and without protocol for any of the devices, indicating the capacity of this assessment in predicting BF% increase, as all constructed curves were significant (p < 0.001).
BIA 3 showed the greatest areas for the general and stratified population. It is observed that the general population and the female gender had higher sensitivity when adopting the protocol, which demonstrates its capacity to detect a greater number of adolescents with excess BF. As for the male gender, the highest sensitivity was demonstrated at the evaluation without the protocol, which again highlights its usefulness.
This device has a tetrapolar system, which differs from the others, since it has by eight tactile electrodes and is multifrequency. The combination of these factors appears to ensure more sensitivity when estimating body composition in adolescents, while the protocol did not influence the results in any of the analyzed situations.
The other BIA devices, which are of lower cost and more available for health services and that also showed moderate sensitivity, specificity, and positive and negative predictive values, can be used with caution at the population level, in the absence of more sensitive methods.
The assessment of body composition of any adolescent performed by methods that are not considered to be the “gold standard” should be made considering the possible errors and should not annul the importance and the need for prevention activities and/or control of excess BF, whatever the results.
ConclusionBased on the results, it was concluded that electrical bioimpedance has good predictive capacity to estimate excess BF in adolescents, and that when it is not possible to perform the protocol, the results are also similar to those of DXA, thus allowing its use in population studies.
The tetrapolar device with eight tactile electrodes showed the highest sensitivity and the best results for the overall population and for the female gender, with protocol, and for the male gender, without protocol.
A high prevalence of adolescents with high percentage of BF was observed, which suggests the importance of specific health care programs in this population, aiming to correct dystrophies and prevent cardiovascular and metabolic disorders in adulthood.
Due to the widespread use of electric bioimpedance devices, studies with other age groups, in the presence and absence of a protocol, are required to confirm its importance and indicate the reliability of the results for the entire population.
FundingFinancial support was received from the following agencies: Fundação de Amparo à Pesquisa do Estado de Minas Gerais (FAPEMIG)/Process No. APQ-01618-10 and Conselho Nacional de Desenvolvimento Científico e Tecnológico (CNPq)/Process No. 485986/2011-6.
Conflicts of interestThe authors declare no conflicts of interest.
Please cite this article as: Gonçalves VS, Faria ER, Franceschini SC, Priore SE. Predictive capacity of different bioelectrical impedance analysis devices, with and without protocol, in the evaluation of adolescents. J Pediatr (Rio J). 2013;89:567–574.


