
To analyze the predictive capacity of anthropometric indicators and their cut-off values for dyslipidemia screening in children and adolescents.
MethodsThis was a cross-sectional study involving 1139 children and adolescents, of both sexes, aged 6–18 years. Body weight, height, waist circumference, subscapular, and triceps skinfold thickness were measured. The body mass index and waist-to-height ratio were calculated. Children and adolescents exhibiting at least one of the following lipid alterations were defined as having dyslipidemia: elevated total cholesterol, low high-density lipoprotein, elevated low-density lipoprotein, and high triglyceride concentration. A receiver operating characteristic curve was constructed and the area under the curve, sensitivity, and specificity was calculated for the parameters analyzed.
ResultsThe prevalence of dyslipidemia was 62.1%. The waist-to-height ratio, waist circumference, subscapular, body mass index, and triceps skinfold thickness, in this order, presented the largest number of significant accuracies, ranging from 0.59 to 0.78. The associations of the anthropometric indicators with dyslipidemia were stronger among adolescents than among children. Significant differences between accuracies of the anthropometric indicators were only observed by the end of adolescence; the accuracy of waist-to-height ratio was higher than that of subscapular (p=0.048) for females, and the accuracy of waist circumference was higher than that of subscapular (p=0.029) and body mass index (p=0.012) for males. In general, the cut-off values of the anthropometric predictors of dyslipidemia increased with age, except for waist-to-height ratio. Sensitivity and specificity varied substantially between anthropometric indicators, ranging from 75.6 to 53.5 and from 75.0 to 50.0, respectively.
ConclusionsThe anthropometric indicators studied had little utility as screening tools for dyslipidemia, especially in children.
Analisar a capacidade preditiva dos indicadores antropométricos e os seus valores de corte para a triagem da dislipidemia em crianças e adolescentes.
MétodosEstudo transversal de 1.139 crianças e adolescentes de ambos os sexos com idade entre 6 e 18 anos. Peso corporal, estatura, circunferência da cintura (CC) e prega cutânea subescapular (PCSE) e prega cutânea tricipital (PCT) foram medidos. O índice de massa corporal (IMC) e relação cintura-estatura (RCE) foram calculados. As crianças e adolescentes que tinham pelo menos uma das seguintes alterações lipídicas foram definidos como tendo dislipidemia: elevados níveis de colesterol total, HDL-C baixo, LDL-C elevado, e concentração elevada de triglicérides. Uma curva ROC (Receiver Operating Characteristics) foi construída e a área sob a curva, a sensibilidade e especificidade foram calculadas para os parâmetros analisados.
ResultadosA prevalência de dislipidemia foi de 62,1%. RCE, CC, PCSE, IMC e PCT, nesta ordem, apresentaram o maior número de precisões significantes, variando de 0,59-0,78. As associações dos indicadores antropométricos com dislipidemia foram mais fortes nos adolescentes do que nas crianças. Diferenças significantes entre precisões dos indicadores antropométricos só foram observadas no final da adolescência, sendo a precisão da RCE maior do que a da PCSE (p=0,048) para meninas e a precisão de CC sendo maior do que a PCSE (p=0,029) e IMC (p=0,012) para os meninos. Em geral, os valores de corte dos preditores antropométricos de dislipidemia aumentaram com a idade, exceto para RCE. Sensibilidade e especificidade variaram substancialmente entre os indicadores antropométricos, variando de 75,6-53,5 e 75,0-50,0, respectivamente.
ConclusõesOs indicadores antropométricos estudados mostraram pouca utilidade como ferramentas de rastreamento para dislipidemia, especialmente em crianças.
Atherosclerosis is a chronic inflammatory cardiovascular disease of multifactorial etiology that causes endothelial dysfunction in the intimal layers of medium- and large-sized arteries.1 The progression of atherogenic plaques can result in severe clinical manifestations, such as myocardial infarction and cerebrovascular accident, in addition to other significant morbidities.1 The atherosclerosis develops slowly and gradually during life and its first manifestations can be observed in childhood and adolescence.2
Evidence indicates that dyslipidemia is a determinant factor for the occurrence of atherosclerosis in the pediatric population.2 The identification of dyslipidemia at an early age is an important strategy for the primary prevention of atherosclerosis. However, the diagnosis of dyslipidemia is performed by laboratory tests as part of lipid profile evaluation. These techniques are invasive and costly, and access is limited. It is therefore necessary to identify easy-to-use and low-cost methods for the epidemiological screening of individuals who are at risk of developing dyslipidemia.
A compelling body of evidence indicates that obesity is an important risk factor for the occurrence of dyslipidemia in the pediatric population.3–6 The body mass index (BMI) is the most commonly used anthropometric indicator to evaluate the nutritional status and the risk of developing cardiometabolic diseases, including dyslipidemia, in young people.7 This index evaluates the total amount of body mass and is therefore unable to distinguish the quantity and distribution of body fat. This characteristic may limit the capacity of BMI to predict dyslipidemia, since body fat distribution, especially fat accumulation in the abdominal region, appears to be a key element that is even more important than obesity to differentiate individuals with a normal and abnormal lipid profile.8
As a consequence, other anthropometric indicators such as skinfold thickness, waist circumference (WC), and waist-to-height ratio (WHtR) have been proposed as promising tools for cardiometabolic risk assessment in young people due to their capacity to estimate body adiposity and abdominal obesity.9–11 However, in young people the amount of visceral fat may not accompany the increase in total and subcutaneous adiposity at the same rate.12 It therefore remains unclear whether indicators of adiposity and abdominal obesity are better predictors of dyslipidemia than BMI during childhood and adolescence.
The identification of anthropometric indicators that allow for simple dyslipidemia screening in different public health care sectors (schools, health clinics, and hospitals) and in primary care may contribute both to prevent cardiovascular diseases and to reduce public health expenditure. This tool may be particularly useful in low- and middle-income countries such as Brazil, where access to medical specialties and laboratory tests is limited and uneven.13 In those countries, children and adolescents often reach adulthood without ever having undergone a lipid profile assessment. Therefore, the aim of the present study was to evaluate the predictive capacity of anthropometric indicators and to establish the best cut-off values for dyslipidemia screening in children and adolescents from Northeastern Brazil.
MethodsThe present study is part of a school-based epidemiological study conducted in a city of Northeastern Brazil. The estimated population in 2012 was 34,845 inhabitants,14 with a human development index of 0.662.15 The study population consisted of school-age children and adolescents, of both sexes, ranging in age from 6 to 18 years. The students were enrolled in the 1st to 9th grades of elementary school and in the 1st to 3rd year of high school of public and private schools in the city.
The representative sample size of the larger study was calculated using an estimated prevalence of 50% (for different outcomes), 95% confidence interval, and a precision of 3%, in accordance with Luiz and Magnanini.16 The estimated sample size was 971 children and adolescents; a 20% margin (n=194) was added to account for possible incomplete data of the subjects or refusal to participate in the data collection. The rate of losses due to refusal or absence on the day of data collection was 2.2%, corresponding to a sample of 1139 children and adolescents. The sample studied (n=1139) had a power of 90% (β=10%) and a 95% confidence level (α=5%) to detect areas under the receiver operating characteristics (ROC) curve of 0.58 or higher as significant.
Data were collected between August of 2011 and May of 2012. The socio-demographic variables were obtained by self-report and included age, sex, monthly household income, number of people living in the household, maternal education level, study place, school type, and socioeconomic class (estimated using the Brazilian Criterion of Economic Classification).17
Body weight was measured with a Plenna digital scale (Plenna®, Brazil) (capacity of 150kg) to the nearest 100g. Height was measured with a Seca (Seca®, Brazil) portable stadiometer (0–220cm) fixed to the wall, to the nearest 0.1cm. Both variables were measured using standard techniques18 and were used to calculate BMI. To characterize the sample in terms of the percentage of children and adolescent with excess weight (overweight and obese), BMI was classified using the cut-off values proposed by Cole et al.19 WC was measured with a non-elastic measurement tape to the nearest 0.1cm, in accordance with the procedures recommended by the World Health Organization.20 Height and WC were used to calculate WHtR. Adiposity was evaluated by the measurement of subscapular (SSF) and triceps skinfold thickness (TSF). These skinfolds were measured with a Cescorf (Cescorf®, Brazil), scientific caliper to the nearest 0.1mm, in accordance with standard techniques.21 The measurements were obtained in triplicate per site on the right side of the subject. The mean of the three measurements was used for analysis.
Anthropometric assessment was performed in the morning by two examiners of the same sex as the students, to avoid any embarrassment. The two examiners presented intra- and interobserver errors of less than 5% and 7.5% for skinfold thickness, respectively, and of less than 1% and 1.5% for the other measures, which are acceptable according to the literature.22
For lipid profile evaluation, venous blood samples (10mL) were collected at the schools in the morning, after a 12-h fast and a normal diet, and were transported under refrigeration for analysis. Serum triglycerides, total cholesterol and high-density lipoprotein (HDL-C) were measured with a Biosystems® (Biosystems®, Brazil) automatic biochemistry analyzer (model A15) using an enzymatic method. Low-density lipoprotein (LDL-C) was calculated using the equation of Friedewald et al.23 Children and adolescents exhibiting at least one of the following lipid alterations were defined as having dyslipidemia: elevated total cholesterol (≥170mg/dL), low HDL-C (<45mg/dL), elevated LDL-C (≥130mg/dL), and high triglyceride concentration (≥130mg/dL). as established by the I guidelines of prevention of atherosclerosis in childhood and adolescence.3
Data were analyzed using the SPSS 15.0 (SPSS for Windows, Version 15.0, IL, USA) and MedCalc (MedCalc for Windows, Version 12.5, Software, Ostend, Belgium) programs. Descriptive analysis consisted of the calculation of mean, median, standard deviation, percentile, and frequency. Student's t-test and one-way analysis of variance (ANOVA) were applied to determine difference in BMI, WC, WHtR, SSF, and TSF between sexes and between ages according to sex. Specific differences between ages were evaluated by the Tukey's post hoc test (p<0.05). Differences in lipid profile between sexes were tested by the Student's t-test or Mann–Whitney test and the linear trend of the lipid profile according to four age groups (6–7 years; 8–9 years; 10–12 years; 13–15 years; and 16–18 years) was evaluated by one-way ANOVA or Jonckheere–Terpstra test (p<0.05). The power of the anthropometric indicators to predict dyslipidemia was evaluated by constructing ROC curves for each sex divided into four age groups (6–7 years; 8–9 years; 10–12 years; 13–15 years; and 16–18 years). The 95% confidence intervals were calculated and significance was attributed to areas under the ROC curve that showed a lower limit of the respective confidence intervals higher than 0.50. The difference in accuracy between the anthropometric indicators associated with dyslipidemia was calculated according to Hanley and McNeil. The cut-off values for anthropometric indicators with significant areas under the ROC curve were identified based on the balance between sensitivity and specificity.
The study protocol was approved by the Ethics Committee of the university. Only students who voluntarily accepted to participate and whose parents or legal guardians signed the informed consent form were included in the study.
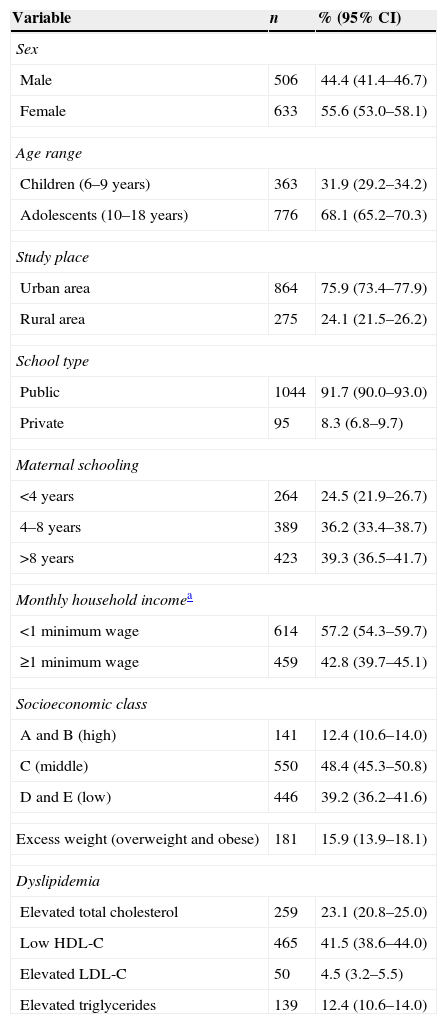
ResultsTable 1 shows the socio-demographic variables and prevalence of overweight and dyslipidemia. There was a predominance of females, adolescents, students from urban public schools, and students with a monthly household income of less than one Brazilian minimum wage. Over 60% of the sample reported maternal education of less than 8 years and approximately 40% belonged to socioeconomic classes D and E (low). The prevalence of excess weight (overweight and obesity) and dyslipidemia was 15.9% and 62.1%, respectively. Individual analysis showed a lower prevalence of elevated LDL-C (4.5%) and a higher prevalence of low HDL-C (41.5%).
Socio-demographic variables and prevalence of excess weight and dyslipidemia among the children and adolescents studied. Northeastern Brazil, 2011–2012.
| Variable | n | % (95% CI) |
|---|---|---|
| Sex | ||
| Male | 506 | 44.4 (41.4–46.7) |
| Female | 633 | 55.6 (53.0–58.1) |
| Age range | ||
| Children (6–9 years) | 363 | 31.9 (29.2–34.2) |
| Adolescents (10–18 years) | 776 | 68.1 (65.2–70.3) |
| Study place | ||
| Urban area | 864 | 75.9 (73.4–77.9) |
| Rural area | 275 | 24.1 (21.5–26.2) |
| School type | ||
| Public | 1044 | 91.7 (90.0–93.0) |
| Private | 95 | 8.3 (6.8–9.7) |
| Maternal schooling | ||
| <4 years | 264 | 24.5 (21.9–26.7) |
| 4–8 years | 389 | 36.2 (33.4–38.7) |
| >8 years | 423 | 39.3 (36.5–41.7) |
| Monthly household incomea | ||
| <1 minimum wage | 614 | 57.2 (54.3–59.7) |
| ≥1 minimum wage | 459 | 42.8 (39.7–45.1) |
| Socioeconomic class | ||
| A and B (high) | 141 | 12.4 (10.6–14.0) |
| C (middle) | 550 | 48.4 (45.3–50.8) |
| D and E (low) | 446 | 39.2 (36.2–41.6) |
| Excess weight (overweight and obese) | 181 | 15.9 (13.9–18.1) |
| Dyslipidemia | ||
| Elevated total cholesterol | 259 | 23.1 (20.8–25.0) |
| Low HDL-C | 465 | 41.5 (38.6–44.0) |
| Elevated LDL-C | 50 | 4.5 (3.2–5.5) |
| Elevated triglycerides | 139 | 12.4 (10.6–14.0) |
Results are reported as absolute and relative frequency and 95% confidence interval (95% CI).
HDL-C, high-density lipoprotein; LDL-C, low-density lipoprotein.
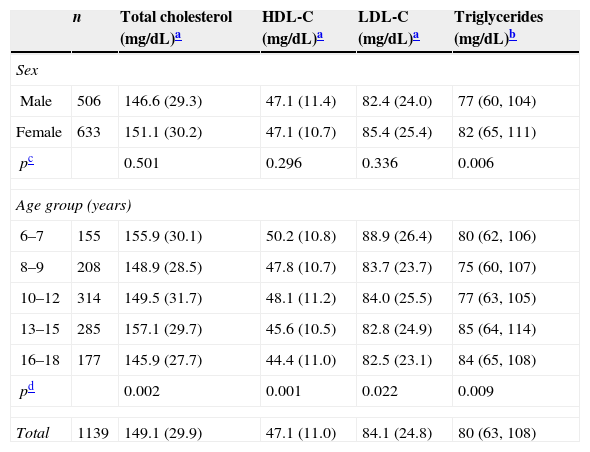
With respect to the anthropometric characteristics of the sample, BMI, WC, WHtR, SSF, and TSF were higher in females than in males (p<0.05). The mean values of the anthropometric indicators tended to increase with age (p<0.05), except for WHtR in males and females and for TSF in males. There was no difference (p>0.05) in any of the anthropometric indicators studied between ages 6 and 7 years, 8 and 9 years, 10 and 12 years, 13 and 15 years, and 16 and 18 years in either males or females. As shown in Table 2, triglyceride levels were higher in females than in males. Total cholesterol, HDL-C, and LDL-C tended to decrease and triglycerides tended to increase with age (Table 2).
Lipid profile of the children and adolescents studied according to sex and age. Northeastern Brazil, 2011–2012.
| n | Total cholesterol (mg/dL)a | HDL-C (mg/dL)a | LDL-C (mg/dL)a | Triglycerides (mg/dL)b | |
|---|---|---|---|---|---|
| Sex | |||||
| Male | 506 | 146.6 (29.3) | 47.1 (11.4) | 82.4 (24.0) | 77 (60, 104) |
| Female | 633 | 151.1 (30.2) | 47.1 (10.7) | 85.4 (25.4) | 82 (65, 111) |
| pc | 0.501 | 0.296 | 0.336 | 0.006 | |
| Age group (years) | |||||
| 6–7 | 155 | 155.9 (30.1) | 50.2 (10.8) | 88.9 (26.4) | 80 (62, 106) |
| 8–9 | 208 | 148.9 (28.5) | 47.8 (10.7) | 83.7 (23.7) | 75 (60, 107) |
| 10–12 | 314 | 149.5 (31.7) | 48.1 (11.2) | 84.0 (25.5) | 77 (63, 105) |
| 13–15 | 285 | 157.1 (29.7) | 45.6 (10.5) | 82.8 (24.9) | 85 (64, 114) |
| 16–18 | 177 | 145.9 (27.7) | 44.4 (11.0) | 82.5 (23.1) | 84 (65, 108) |
| pd | 0.002 | 0.001 | 0.022 | 0.009 | |
| Total | 1139 | 149.1 (29.9) | 47.1 (11.0) | 84.1 (24.8) | 80 (63, 108) |
HDL-C, high-density lipoprotein; LDL-C, low-density lipoprotein.
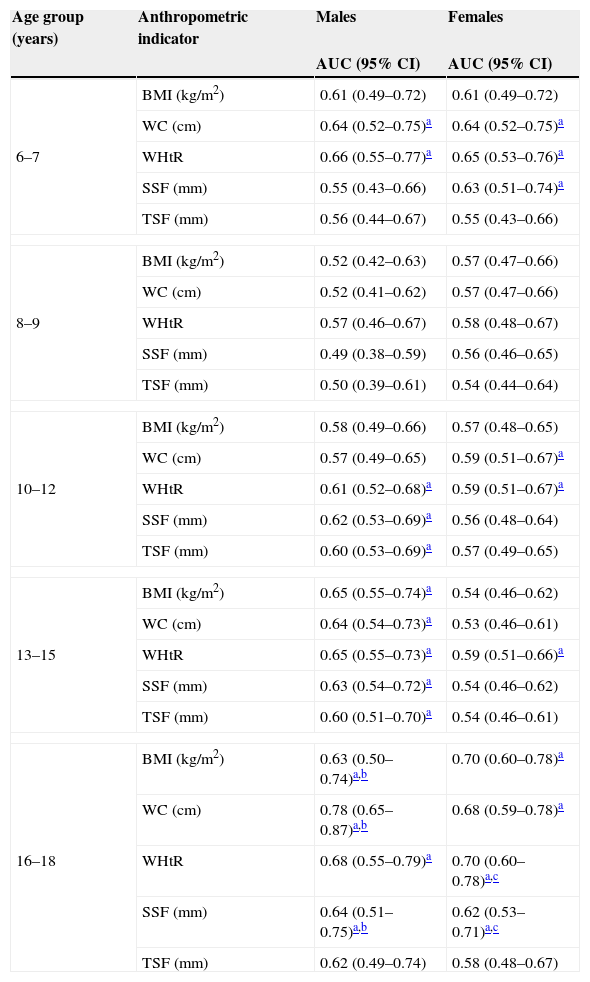
The areas under the ROC curve for the anthropometric variables as predictors of dyslipidemia are shown in Table 3. For girls, WHtR, WC, SSF, and BMI, in this order, presented the largest number of significant accuracies. For males, WHtR showed significant accuracy for four age groups, followed by WC and SSF (three groups) and BMI and TSF (two groups). Significant differences between accuracies of the anthropometric indicators were only observed for the age group of 16–18 years. For females, only the accuracy of WHtR was higher than that of SSF (p=0.048). For males, only the accuracy of WC was higher than that of SSF (p=0.029) and BMI (p=0.012). In the age group of 8–9 years, none of the anthropometric indicators was a significant predictor of dyslipidemia, regardless of sex. Conversely, the highest accuracies were observed in the age group of 16–18 years.
Areas under the ROC curve and 95% confidence intervals of the anthropometric indicators for dyslipidemia screening in the children and adolescents studied according to age group and sex. Northeastern Brazil, 2011–2012.
| Age group (years) | Anthropometric indicator | Males | Females |
|---|---|---|---|
| AUC (95% CI) | AUC (95% CI) | ||
| 6–7 | BMI (kg/m2) | 0.61 (0.49–0.72) | 0.61 (0.49–0.72) |
| WC (cm) | 0.64 (0.52–0.75)a | 0.64 (0.52–0.75)a | |
| WHtR | 0.66 (0.55–0.77)a | 0.65 (0.53–0.76)a | |
| SSF (mm) | 0.55 (0.43–0.66) | 0.63 (0.51–0.74)a | |
| TSF (mm) | 0.56 (0.44–0.67) | 0.55 (0.43–0.66) | |
| 8–9 | BMI (kg/m2) | 0.52 (0.42–0.63) | 0.57 (0.47–0.66) |
| WC (cm) | 0.52 (0.41–0.62) | 0.57 (0.47–0.66) | |
| WHtR | 0.57 (0.46–0.67) | 0.58 (0.48–0.67) | |
| SSF (mm) | 0.49 (0.38–0.59) | 0.56 (0.46–0.65) | |
| TSF (mm) | 0.50 (0.39–0.61) | 0.54 (0.44–0.64) | |
| 10–12 | BMI (kg/m2) | 0.58 (0.49–0.66) | 0.57 (0.48–0.65) |
| WC (cm) | 0.57 (0.49–0.65) | 0.59 (0.51–0.67)a | |
| WHtR | 0.61 (0.52–0.68)a | 0.59 (0.51–0.67)a | |
| SSF (mm) | 0.62 (0.53–0.69)a | 0.56 (0.48–0.64) | |
| TSF (mm) | 0.60 (0.53–0.69)a | 0.57 (0.49–0.65) | |
| 13–15 | BMI (kg/m2) | 0.65 (0.55–0.74)a | 0.54 (0.46–0.62) |
| WC (cm) | 0.64 (0.54–0.73)a | 0.53 (0.46–0.61) | |
| WHtR | 0.65 (0.55–0.73)a | 0.59 (0.51–0.66)a | |
| SSF (mm) | 0.63 (0.54–0.72)a | 0.54 (0.46–0.62) | |
| TSF (mm) | 0.60 (0.51–0.70)a | 0.54 (0.46–0.61) | |
| 16–18 | BMI (kg/m2) | 0.63 (0.50–0.74)a,b | 0.70 (0.60–0.78)a |
| WC (cm) | 0.78 (0.65–0.87)a,b | 0.68 (0.59–0.78)a | |
| WHtR | 0.68 (0.55–0.79)a | 0.70 (0.60–0.78)a,c | |
| SSF (mm) | 0.64 (0.51–0.75)a,b | 0.62 (0.53–0.71)a,c | |
| TSF (mm) | 0.62 (0.49–0.74) | 0.58 (0.48–0.67) | |
AUC, area under the ROC curve; 95% CI, 95% confidence interval; BMI, body mass index; WC, waist circumference; WHtR, waist-to-height ratio; SSF, subscapular skinfold thickness; TSF, triceps skinfold thickness; ROC, receiver operating characteristics.
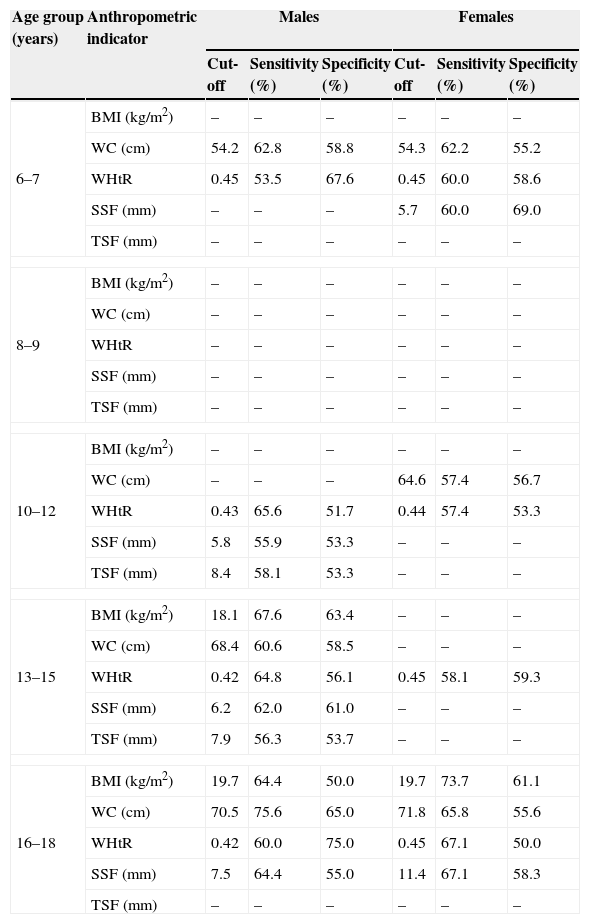
Among the anthropometric indicators identified as predictors of dyslipidemia, the cut-off values for WC and WHtR were similar for males and females aged 6–7 years. For the age groups corresponding to adolescence (10–12, 13–15, and 16–18 years), the cut-off values for WHtR were higher for females. For the age group of 16–18 years, similar BMI and WC cut-off values were obtained for both sexes, whereas SSF cut-off values were higher for females. In general, the cut-off values of the anthropometric predictors of dyslipidemia increased with age, except for WHtR. Sensitivity and specificity varied substantially between anthropometric indicators, ranging from 75.6 to 53.5 and from 75.0 to 50.0, respectively (Table 4).
Cut-off values, sensitivity, and specificity of the anthropometric indicators for dyslipidemia screening in the children and adolescents studied according to age group and sex. Northeastern Brazil, 2011–2012.
| Age group (years) | Anthropometric indicator | Males | Females | ||||
|---|---|---|---|---|---|---|---|
| Cut-off | Sensitivity (%) | Specificity (%) | Cut-off | Sensitivity (%) | Specificity (%) | ||
| 6–7 | BMI (kg/m2) | – | – | – | – | – | – |
| WC (cm) | 54.2 | 62.8 | 58.8 | 54.3 | 62.2 | 55.2 | |
| WHtR | 0.45 | 53.5 | 67.6 | 0.45 | 60.0 | 58.6 | |
| SSF (mm) | – | – | – | 5.7 | 60.0 | 69.0 | |
| TSF (mm) | – | – | – | – | – | – | |
| 8–9 | BMI (kg/m2) | – | – | – | – | – | – |
| WC (cm) | – | – | – | – | – | – | |
| WHtR | – | – | – | – | – | – | |
| SSF (mm) | – | – | – | – | – | – | |
| TSF (mm) | – | – | – | – | – | – | |
| 10–12 | BMI (kg/m2) | – | – | – | – | – | – |
| WC (cm) | – | – | – | 64.6 | 57.4 | 56.7 | |
| WHtR | 0.43 | 65.6 | 51.7 | 0.44 | 57.4 | 53.3 | |
| SSF (mm) | 5.8 | 55.9 | 53.3 | – | – | – | |
| TSF (mm) | 8.4 | 58.1 | 53.3 | – | – | – | |
| 13–15 | BMI (kg/m2) | 18.1 | 67.6 | 63.4 | – | – | – |
| WC (cm) | 68.4 | 60.6 | 58.5 | – | – | – | |
| WHtR | 0.42 | 64.8 | 56.1 | 0.45 | 58.1 | 59.3 | |
| SSF (mm) | 6.2 | 62.0 | 61.0 | – | – | – | |
| TSF (mm) | 7.9 | 56.3 | 53.7 | – | – | – | |
| 16–18 | BMI (kg/m2) | 19.7 | 64.4 | 50.0 | 19.7 | 73.7 | 61.1 |
| WC (cm) | 70.5 | 75.6 | 65.0 | 71.8 | 65.8 | 55.6 | |
| WHtR | 0.42 | 60.0 | 75.0 | 0.45 | 67.1 | 50.0 | |
| SSF (mm) | 7.5 | 64.4 | 55.0 | 11.4 | 67.1 | 58.3 | |
| TSF (mm) | – | – | – | – | – | – | |
BMI, body mass index; WC, waist circumference; WHtR, waist-to-height ratio; SSF, subscapular skinfold thickness; TSF, triceps skinfold thickness.
For cells containing “–” there was no anthropometric indicator with a significant area under the ROC curve to predict dyslipidemia.
Evidence suggests that cardiovascular risk factors present in childhood and adolescence tend to persist and increase in adult life.2 Considering that the prevalence of dyslipidemia was 62.1% in the present study, the identification of anthropometric indicators for dyslipidemia screening in the pediatric population is a feasible and important strategy for primary prevention of chronic diseases that persist into adulthood at the population level. To the best of the author's knowledge, this is the first school-based epidemiological study that evaluated several anthropometric indicators as screening tools for dyslipidemia in children and adolescents of both sexes from a municipality in Northeastern Brazil.
The prevalence of lipid profile alterations observed in the present study was similar to that reported in Brazilian studies4,5 that also used the cut-off values recommended by the Brazilian guidelines of prevention of atherosclerosis in childhood and adolescence3 for the diagnosis of dyslipidemia. It should be noted that, as observed in other studies,4,5 low HDL-C was the most prevalent outcome. This finding may have been favored by the higher cut-off for this lipoprotein proposed by the Brazilian guidelines3 when compared with international guidelines.7 Although controversy exists in the literature regarding which guidelines to use,4–6 the authors chose the national guidelines as they are a reference in Brazil for establishing individual and population strategies for the control of risk factors for atherosclerosis in childhood and adolescence.3
Regarding the comparison of anthropometric indicators according to sex and age group, the present findings showed significant differences between sexes for all anthropometric indicators, whereas the indicators were similar among age groups, regardless of sex. Therefore, the association between anthropometric indicators and dyslipidemia considered sex and age group. It should be emphasized that inadequate sex and age stratification may lead to erroneous interpretation of the results due to the body changes that occur during growth and physical development.24 However, several studies investigating the power of anthropometric indicators to predict cardiovascular risk factors in children and adolescents have overlooked these aspects.9,10
The present findings demonstrated little difference in the capacity of the anthropometric indicators to identify children and adolescents with dyslipidemia. Analysis of the ROC curve showed that only WHtR and WC were associated with dyslipidemia in children of both sexes aged 6–7 years, with a slightly higher accuracy for WHtR (without statistical significance). In contrast, none of the indicators evaluated was able to identify dyslipidemia in children aged 8–9 years. The lack of an association in this age group might be related to the transition from childhood to adolescence, when serum lipid levels peak as a result of hormonal changes, and this peak does not necessarily imply alterations in the amount of body fat.25 In adolescents, WHtR was the only indicator associated with dyslipidemia in both sexes for the three age groups (10–12, 13–15, and 16–18 years). The associations of the anthropometric indicators with dyslipidemia were stronger among adolescents than among children, especially in the age group of 16–18 years. These findings corroborate the data of literature, indicating that anthropometry is more useful to discriminate dyslipidemia in late adolescence.26
TSF showed the worst performance in predicting dyslipidemia, especially in females. Other studies also reported a weak association between this skinfold measure and cardiovascular risk factors in the pediatric population.11,27 TSF is a measure of peripheral body fat, which may explain, at least in part, the low discriminatory capacity for dyslipidemia. Fat located in the abdominal region, especially in non-fatty tissues (ectopic fat), has been shown to be a determinant factor of lipid profile abnormalities.8 It is therefore expected that indicators of central fat distribution have a higher predictive capacity of this outcome.
WHtR and WC were, in this order, the anthropometric indicators associated with dyslipidemia in the largest number of age groups per sex. Additionally, only WHtR and WC presented significantly higher accuracy than the other indicators (WHtR>SSF for females and WC>BMI and SSF for males, both aged 16–18 years). These indicators have also been proposed in other studies as good predictors of dyslipidemia and clustered cardiovascular risk factors in the pediatric population.9,10,28 However, WC does not take into account variations resulting from the process of growth/physical development, when body proportions and shapes change during different periods and at different speeds. These changes vary among the different pediatric age groups.24 Conversely, WHtR has some advantages that should be mentioned: (1) it requires two simple, low-cost, and noninvasive anthropometric measurements, providing a promising indicator of dyslipidemia in young people; (2) it is a precise indicator of central body fat accumulation and distribution by taking into account the change in height that occurs during growth and physical development, and (3) it does not require specific population references and has no measurement unit. However, the present results showed poor accuracy of this indicator for most of the age groups studied. Therefore, despite the easy inclusion of WHtR in routine primary health care evaluations in schools and family healthcare units, its usefulness for dyslipidemia screening needs further investigation.
The cut-off values proposed in the present study were lower than those reported in studies involving samples from high-income countries, regardless of anthropometric indicator, sex, or age group.24,29,30 In fact, the use of cut-off values established in developed countries to screen for dyslipidemia in children and adolescents of developing populations does not appear to be adequate, since this approach may result in a large number of false-negative results, underestimating disease prevalence. In addition, less sensitive criteria may delay the implementation of dyslipidemia prevention and treatment programs in childhood and adolescence.
The present study had some limitations, such as its cross-sectional design, which did not permit to establish cause–effect relationships as the data regarding exposure and outcome were collected simultaneously. Therefore, further studies monitoring changes in anthropometric indicators and the lipid profile of young people over time are needed to gain more insight into this topic. A broad age range was investigated, a fact that may interfere with the results. A lower frequency of dyslipidemia is expected among children. Furthermore, alterations in the lipid profile may be more affected by hormonal changes at the onset of puberty than by the accumulation of body fat.25 Among adolescents, the amount and distribution of body fat are strongly influenced by sex with advancing biological maturation.12 These factors may confound the relationship between anthropometric indicators and lipid profile in young people and explain, at least in part, the low accuracies observed in the present study, especially for children. In this respect, the analyses were performed according to age group and sex, in an attempt to minimize interferences of sample heterogeneity with the findings. However, the relationship between subcutaneous and ectopic fat may not be linear in young people, especially children,12 a fact that could limit the use of anthropometric indicators as a screening tool for dyslipidemia.
In general, the accuracy of the anthropometric indicators was poor, with the observation of more expressive values in the last years of adolescence. WHtR, WC, BMI, SSF and TSF, in this order, presented the largest number of associations with dyslipidemia in the age groups studied. The cut-off values observed here were lower than those found in studies conducted in developed countries, a finding suggesting the importance of criteria for the classification of specific anthropometric indicators for populations of middle- and low-income countries. Although WHtR showed promising results in the present study and has additional advantages over WC, its usefulness as a screening tool for dyslipidemia requires further investigation.
FundingThis study was funded by a scholarship from the Fundação de Amparo à Pesquisa do Estado da Bahia (FAPESB).
Conflicts of interestThe authors declare no conflicts of interest.
To the Municipal Education and Health Departments of Amargosa, Bahia, Brazil, for permitting this study.
To Dr. David S. Freedman of the Centers for Disease Control and Prevention, Atlanta, GA, USA, for his suggestions regarding the manuscript.
Please cite this article as: Quadros TM, Gordia AP, Silva RC, Silva LR. Predictive capacity of anthropometric indicators for dyslipidemia screening in children and adolescents. J Pediatr (Rio J). 2015;91:455–63.
Study conducted at Centro de Formação de Professores, Universidade Federal do Recôncavo da Bahia (UFRB), Amargosa, BA, Brazil.


