
This study aimed to assess diet quality among adolescents with HIV/AIDS.
MethodA cross-sectional study was conducted involving patients with HIV/AIDS treated in a referral hospital in Sao Paulo, Brazil. Eighty-eight adolescents (10-19 years of age) participated in the study. Information on disease history and use of medication were obtained from medical records. The participants responded to two 24-hour diet recalls. Diet quality was assessed by means of the Healthy Eating Index-2005 (HEI-2005) adapted to the Brazilian population. Pearson's correlation coefficients were calculated. Mean HEI-2005 scores were compared according to the independent variables using either the Student's t-test or the Mann-Whitney test.
ResultsThe mean HEI-2005 score was 51.90 (SE=0.90). The components with the lowest means were whole grains and sodium. Components with highest means were total grains and oils. No correlations were found between the independent variables and HEI score. Adolescents living in foster homes had higher means for total fruit and lower means for meat and beans in comparison to adolescents living with their families. Girls had higher means for milk and lower means for calories from solid fats, alcoholic beverages, and added sugars in comparison to boys.
ConclusionsAdolescents with HIV/AIDS exhibited a similar eating pattern to that of adolescents in the general population: high consumption of added sugar, saturated fat, and sodium, and insufficient ingestion of whole grains and fruits. Special attention should be paid to the diet of adolescents with HIV/AIDS, who are at greater risk of developing cardiovascular and other chronic diseases.
Avaliar a qualidade da dieta de adolescentes com HIV/Aids.
MétodoEstudo transversal envolvendo pacientes com HIV/Aids atendidos em um hospital de referência em São Paulo. Participaram do estudo 88 adolescentes (10-19 anos). Informações sobre história clínica e uso de medicamentos foram obtidas dos prontuários médicos. Os participantes responderam a dois recordatórios de 24 horas. A qualidade da dieta foi avaliada pelo índice de qualidade da dieta revisado (IQD-R) adaptado para a população brasileira. Coeficientes de correlação de Pearson foram calculados. As médias do escore do IQD-R foram comparadas de acordo com as variáveis independentes, usando o teste-t de Student ou teste Mann-Whitney.
ResultadosA média do IQD-R foi 51,90 (EP=0,90). Os componentes de menores médias foram: cereais integrais e sódio. Os componentes de maiores médias foram cereais totais e óleos. Não foram encontradas correlações entre as variáveis independentes e o IQD-R. Adolescentes vivendo em casas de apoio tiveram médias maiores para frutas totais e menores para carnes e feijão em comparação aos adolescentes vivendo com suas famílias. As meninas apresentaram médias mais altas para leite e menores médias para calorias provenientes de gorduras sólidas, bebidas alcoólicas e açúcares adicionados, em comparação aos meninos.
ConclusõesOs adolescentes com HIV/Aids apresentaram padrão alimentar semelhante àquele da população geral: alto consumo de açúcar, gordura saturada e sódio e ingestão insuficiente de cereais integrais e frutas. Atenção especial deve ser dada à dieta de adolescentes com HIV/Aids, pois eles estão sob maior risco de desenvolver doenças cardiovasculares e outras doenças crônicas.
The introduction of the highly active antiretroviral therapy (HAART) in the treatment of human immunodeficiency virus/acquired immunodeficiency syndrome (HIV/AIDS) has changed the course of the disease, dramatically improving survival. However, since HAART introduction, long-term side effects, some of them closely related to nutrition, such as lipid profile abnormalities, have also been described.1
Studies involving children and adolescents report important prevalence rates of metabolic disturbances. Dos Reis et al. found a high prevalence rate of lipid abnormalities among Brazilian children and adolescents: 81.4% had low HDL-cholesterol and 35.5% had increased triglyceride levels.2
Diet also plays an important role in the immune system of HIV/AIDS patients, because sufficient amounts of macro- and micronutrients are essential for its normal functioning.3
Despite of its importance, only a few studies have been conducted to assess the diet of children and adolescents with HIV/AIDS. The few existing studies reported inadequate diets. A study conducted in the USA evaluated the diet of children with HIV between 1995 and 2004 and found an excessive intake of energy, protein, and sugar, as well as insufficient fiber intake.4 Likewise, Werner et al.5 found excessive energy intake in the diets of Brazilian children with HIV/AIDS aged 2 to 16 years. Hence, the assessment of diet quality is an important aspect in monitoring and evaluating both treatment and clinical conditions in this population.
The aim of the present study was to assess the diet quality of adolescents with HIV/AIDS and determine associated factors.
MethodsA cross-sectional study nested in a cohort study of patients with HIV/AIDS was carried out at the Instituto da Criança (ICr), which is a pediatric referral hospital in Sao Paulo, Brazil. All 124 patients aged 10 to 19 years old in follow-up at this institute were considered eligible. Three patients were excluded due to illnesses that affect food intake. All eligible patients with medical appointments scheduled between April and September of 2010 were invited by their physicians to participate in the study. However, eight had not attended any scheduled appointment in the previous six months, ten were not reached by telephone, and ten missed the scheduled appointment. Thus, 90 adolescents (74.4%) were initially evaluated. One adolescent was excluded for having an energy intake below the first percentile and one was excluded for having an energy intake above the 99th percentile.6 Thus, the final study population was made up of 88 adolescents (71.0%).
Information on disease history and medication use was obtained from medical records. Diseases were defined based on the criteria of the Brazilian Ministry of Health.7 Parents/legal guardians signed an informed consent and answered a questionnaire on socioeconomic aspects.
Weight, height, and waist circumference were measured twice by a trained dietitian. Z-scores for height-for-age and body mass index (BMI)-for-age were calculated using Anthroplus software, version 1.0.3 (WHO AnthroPlus software, USA). The participants were classified with regard to nutritional status based on the cutoff values proposed by the WHO.8 Two 24-hour diet recalls were administered by a trained dietitian. The participants were asked to report all food and beverages and respective amounts consumed in the previous day. The first recall was obtained through a face-to-face interview. To facilitate the report of the amount consumed, a photo book with pictures of different portion sizes was shown.9 The second 24-hour food recall was obtained through telephone contact on non-consecutive days after approximately one week, in order to correct for personal variation.10 The telephone interview was employed to minimize possible losses.
Dietary data were entered into NutWin software, version 1.5. 2003 (Department of Computer Science in Health, Brazil). The Brazilian Food Composition Table11 was used to estimate nutrient intake. Foods were classified into groups based on the Guidelines for the Brazilian Population.12 For the quantification of the intake of each food group, recipes were analyzed by ingredient, and each was entered separately.
Information on trans fatty acids and added sugar content were obtained from the USDA food composition table,13 since this information is not available in Brazil. The foods from the USDA table most similar to those of the Brazilian table in terms of macronutrient composition were chosen. The Multiple Source Method online platform14 was used to estimate the habitual ingestion of nutrients and food groups, using regression models based on the information provided by the two 24 hour-food recalls.
The data were then analyzed using the HEI-2005 adapted to the Brazilian population. The adapted version contains the same 12 items, but the cutoff values differ from those of the American version, and can be found elsewhere.15 For the components total fruit; whole fruit; total vegetables; dark green vegetables, orange vegetables, and legumes; total grains; whole grains; milk; meat and beans; and oils, minimum scores represent the absence of such food group in one's diet, whereas, maximum scores indicate that recommendations were met. As for saturated fat, sodium, calories from solid fats, alcoholic beverages, and added sugars, the minimum scores are assigned to those who have intakes higher than the recommendation, since their consumption in excess is related to health problems. The opposite is true for the maximum scores.15
The final score (sum of all items) ranged from zero to 100 points, with higher scores denoting better diet quality. In the present study, the HEI-2005 was analyzed as a continuous variable. Percentages of minimum and maximal scores were also calculated.
The analyses were stratified by sex and place of residence (living in foster home versus living with family).
For the characterization of the sample, descriptive analysis involved the determination of central tendency and dispersion, as well as absolute and relative frequencies. The Kolmogorov-Smirnov test was employed to determine the adherence of the quantitative variables to normal distribution. HEI-2005 was the dependent variable. Socio-demographic, clinical and anthropometric data constituted the independent variables. Pearson's correlation coefficients were calculated for continuous variables. The Student's t-test and the Mann-Whitney test were used to compare mean HEI-2005 scores between groups. All statistical analyses were carried out using SPSS software (SPSS Inc., version 15.0. Chicago, USA).
This study received approval from the Institutional Review Boards of the School of Public Health and School of Medicine (University of São Paulo, Brazil). All participants and parents/guardians provided written informed consent.
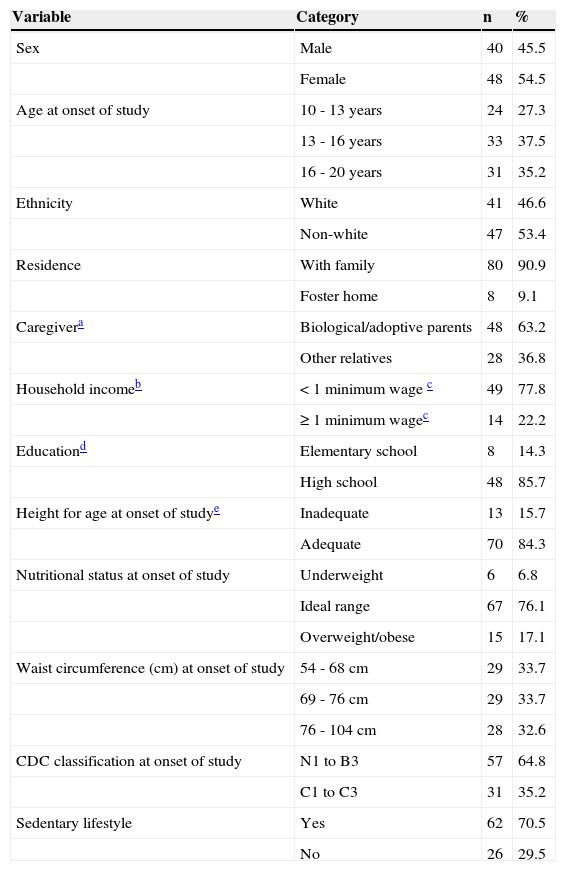
ResultsTable 1 displays the demographic and anthropometric characteristics of the sample. Most interviewees were female (54.4%), non-white (53.4%), and attending high school at the time of the interview (63.6%). Eleven (12.5%) lived in foster homes and the others lived with family members. Among those who lived with family, 63.2% had at least one of their biological parents and 25% had their grandparents as caregivers. Other family members were also cited: adoptive parents (10.5%), aunt/godmother (10.5%), and sister (2.6%). Thirty families lived on less than US$ 500/month. Most participants’ families (77.8%) lived on US$250/month (the Brazilian minimum wage) or less. Eight participants (9.1%) were overweight, seven were obese (8.0%), and thirteen (15.7%) had height-for-age deficit. Most participants had a sedentary lifestyle (70.5%).
Demographic and anthropometric characteristics of sample (absolute and relative frequencies), Instituto da Criança, São Paulo, Brazil, 2010.
| Variable | Category | n | % |
|---|---|---|---|
| Sex | Male | 40 | 45.5 |
| Female | 48 | 54.5 | |
| Age at onset of study | 10 - 13 years | 24 | 27.3 |
| 13 - 16 years | 33 | 37.5 | |
| 16 - 20 years | 31 | 35.2 | |
| Ethnicity | White | 41 | 46.6 |
| Non-white | 47 | 53.4 | |
| Residence | With family | 80 | 90.9 |
| Foster home | 8 | 9.1 | |
| Caregivera | Biological/adoptive parents | 48 | 63.2 |
| Other relatives | 28 | 36.8 | |
| Household incomeb | < 1 minimum wage c | 49 | 77.8 |
| ≥ 1 minimum wagec | 14 | 22.2 | |
| Educationd | Elementary school | 8 | 14.3 |
| High school | 48 | 85.7 | |
| Height for age at onset of studye | Inadequate | 13 | 15.7 |
| Adequate | 70 | 84.3 | |
| Nutritional status at onset of study | Underweight | 6 | 6.8 |
| Ideal range | 67 | 76.1 | |
| Overweight/obese | 15 | 17.1 | |
| Waist circumference (cm) at onset of study | 54 - 68 cm | 29 | 33.7 |
| 69 - 76 cm | 29 | 33.7 | |
| 76 - 104 cm | 28 | 32.6 | |
| CDC classification at onset of study | N1 to B3 | 57 | 64.8 |
| C1 to C3 | 31 | 35.2 | |
| Sedentary lifestyle | Yes | 62 | 70.5 |
| No | 26 | 29.5 |
Regarding clinical characteristics, more than half were diagnosed with HIV before the age of one year (56.8%) and the vast majority were infected vertically (95.5%). Fifty-five participants (62.5%) had developed AIDS-defining diseases and only three (3.4%) were asymptomatic. The majority of participants had been hospitalized at least once (71.6%).
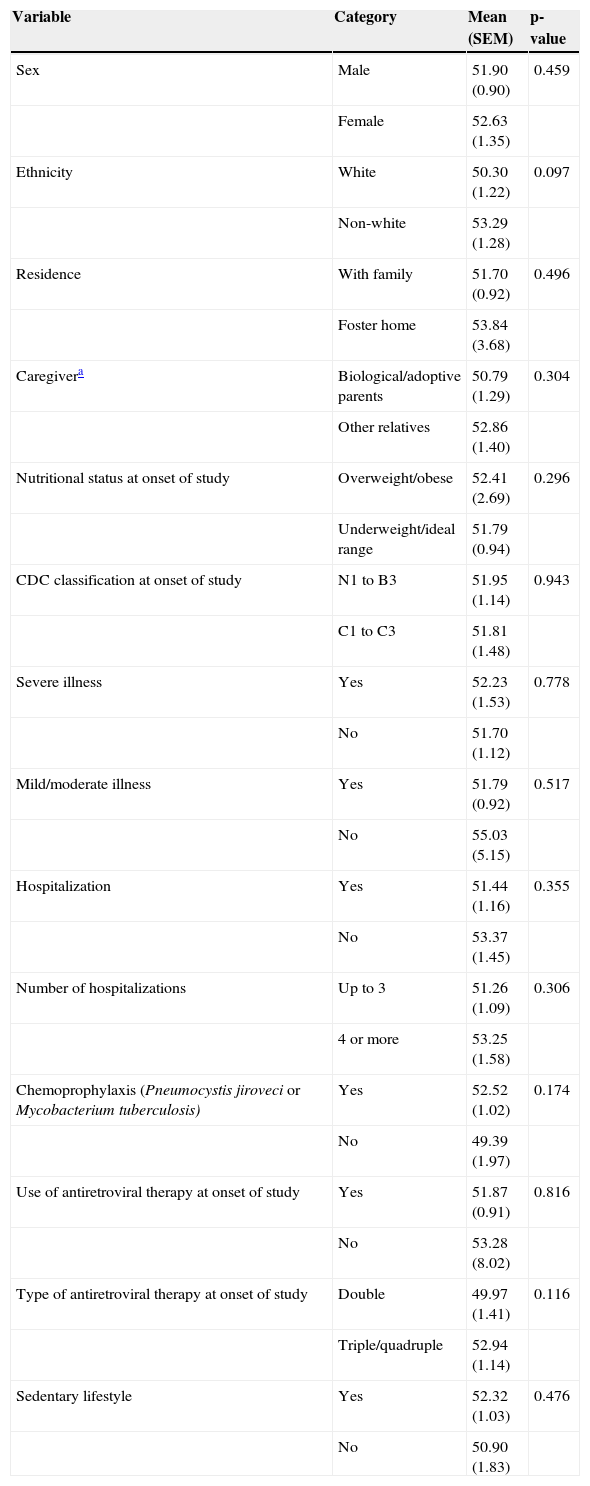
The mean total HEI-2005 score was 51.90 (range: 33.47 to 77.06 points out of the total of 100 points) as Table 2 displays. No significant correlations were found between HEI scores and age at the onset of the study (r=0.06; p=0.546), household income logarithm (r=0.00; p=0.775), Z-score of height-for-age at the onset of the study (r=0.03; p=0.776), or waist circumference (cm) at the onset of the study (r=0.17; p=0.115). Indeed, no statistically significant associations were found between the mean HEI-2005 score and any of the independent variables (Table 2).
Mean HEI-2005 score according to independent variables; Instituto da Criança, São Paulo, Brazil, 2010.
| Variable | Category | Mean (SEM) | p-value |
|---|---|---|---|
| Sex | Male | 51.90 (0.90) | 0.459 |
| Female | 52.63 (1.35) | ||
| Ethnicity | White | 50.30 (1.22) | 0.097 |
| Non-white | 53.29 (1.28) | ||
| Residence | With family | 51.70 (0.92) | 0.496 |
| Foster home | 53.84 (3.68) | ||
| Caregivera | Biological/adoptive parents | 50.79 (1.29) | 0.304 |
| Other relatives | 52.86 (1.40) | ||
| Nutritional status at onset of study | Overweight/obese | 52.41 (2.69) | 0.296 |
| Underweight/ideal range | 51.79 (0.94) | ||
| CDC classification at onset of study | N1 to B3 | 51.95 (1.14) | 0.943 |
| C1 to C3 | 51.81 (1.48) | ||
| Severe illness | Yes | 52.23 (1.53) | 0.778 |
| No | 51.70 (1.12) | ||
| Mild/moderate illness | Yes | 51.79 (0.92) | 0.517 |
| No | 55.03 (5.15) | ||
| Hospitalization | Yes | 51.44 (1.16) | 0.355 |
| No | 53.37 (1.45) | ||
| Number of hospitalizations | Up to 3 | 51.26 (1.09) | 0.306 |
| 4 or more | 53.25 (1.58) | ||
| Chemoprophylaxis (Pneumocystis jiroveci or Mycobacterium tuberculosis) | Yes | 52.52 (1.02) | 0.174 |
| No | 49.39 (1.97) | ||
| Use of antiretroviral therapy at onset of study | Yes | 51.87 (0.91) | 0.816 |
| No | 53.28 (8.02) | ||
| Type of antiretroviral therapy at onset of study | Double | 49.97 (1.41) | 0.116 |
| Triple/quadruple | 52.94 (1.14) | ||
| Sedentary lifestyle | Yes | 52.32 (1.03) | 0.476 |
| No | 50.90 (1.83) |
SEM, standard error of the mean.
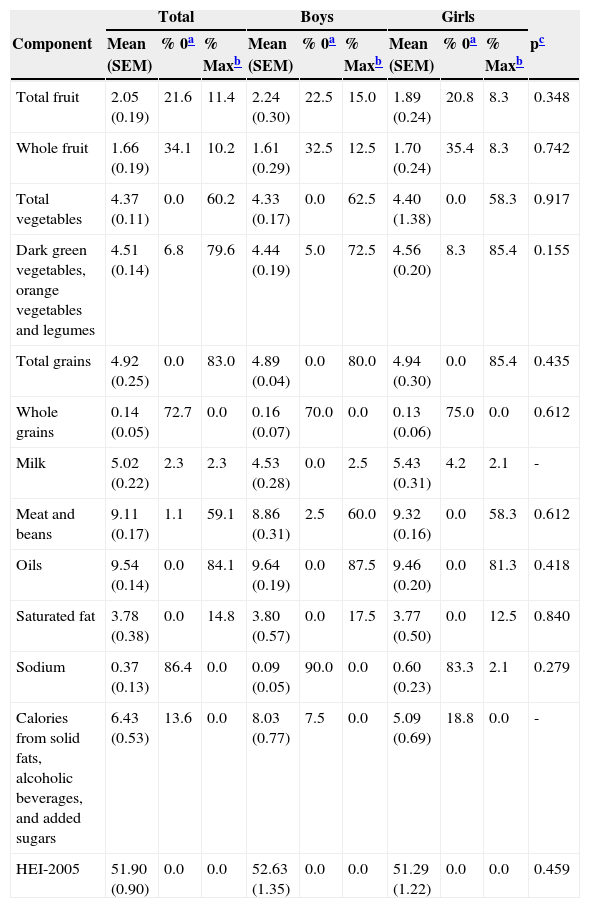
Table 3 displays mean HEI-2005 scores according to sex. Means were high for the following components: total grains, oils, meat and beans, total vegetables, and dark green and orange vegetables and legumes. The highest proportion of the maximum score was found for oils (84.1%); followed by total grains (83.0%); and dark green vegetables, orange vegetables, and legumes (79.6%). In contrast, the lowest means were found for whole grains, sodium, and whole fruit, and calories from solid fats, alcoholic beverages, and added sugars. The components with the highest proportion of the minimum score (zero) were sodium (86.4%) and whole grains (72.7%). No significant differences were found between sexes, except with regard to milk and dairy, for which girls had higher scores (p=0.038), and calories from solid fats, alcoholic beverages, and added sugars, for which boys had higher scores (p=0.005).
Descriptive statistics of the Healthy Eating Index score and its components; Instituto da Criança, São Paulo, Brazil, 2010.
| Total | Boys | Girls | ||||||||
|---|---|---|---|---|---|---|---|---|---|---|
| Component | Mean (SEM) | % 0a | % Maxb | Mean (SEM) | % 0a | % Maxb | Mean (SEM) | % 0a | % Maxb | pc |
| Total fruit | 2.05 (0.19) | 21.6 | 11.4 | 2.24 (0.30) | 22.5 | 15.0 | 1.89 (0.24) | 20.8 | 8.3 | 0.348 |
| Whole fruit | 1.66 (0.19) | 34.1 | 10.2 | 1.61 (0.29) | 32.5 | 12.5 | 1.70 (0.24) | 35.4 | 8.3 | 0.742 |
| Total vegetables | 4.37 (0.11) | 0.0 | 60.2 | 4.33 (0.17) | 0.0 | 62.5 | 4.40 (1.38) | 0.0 | 58.3 | 0.917 |
| Dark green vegetables, orange vegetables and legumes | 4.51 (0.14) | 6.8 | 79.6 | 4.44 (0.19) | 5.0 | 72.5 | 4.56 (0.20) | 8.3 | 85.4 | 0.155 |
| Total grains | 4.92 (0.25) | 0.0 | 83.0 | 4.89 (0.04) | 0.0 | 80.0 | 4.94 (0.30) | 0.0 | 85.4 | 0.435 |
| Whole grains | 0.14 (0.05) | 72.7 | 0.0 | 0.16 (0.07) | 70.0 | 0.0 | 0.13 (0.06) | 75.0 | 0.0 | 0.612 |
| Milk | 5.02 (0.22) | 2.3 | 2.3 | 4.53 (0.28) | 0.0 | 2.5 | 5.43 (0.31) | 4.2 | 2.1 | - |
| Meat and beans | 9.11 (0.17) | 1.1 | 59.1 | 8.86 (0.31) | 2.5 | 60.0 | 9.32 (0.16) | 0.0 | 58.3 | 0.612 |
| Oils | 9.54 (0.14) | 0.0 | 84.1 | 9.64 (0.19) | 0.0 | 87.5 | 9.46 (0.20) | 0.0 | 81.3 | 0.418 |
| Saturated fat | 3.78 (0.38) | 0.0 | 14.8 | 3.80 (0.57) | 0.0 | 17.5 | 3.77 (0.50) | 0.0 | 12.5 | 0.840 |
| Sodium | 0.37 (0.13) | 86.4 | 0.0 | 0.09 (0.05) | 90.0 | 0.0 | 0.60 (0.23) | 83.3 | 2.1 | 0.279 |
| Calories from solid fats, alcoholic beverages, and added sugars | 6.43 (0.53) | 13.6 | 0.0 | 8.03 (0.77) | 7.5 | 0.0 | 5.09 (0.69) | 18.8 | 0.0 | - |
| HEI-2005 | 51.90 (0.90) | 0.0 | 0.0 | 52.63 (1.35) | 0.0 | 0.0 | 51.29 (1.22) | 0.0 | 0.0 | 0.459 |
SEM, standard error of the mean.
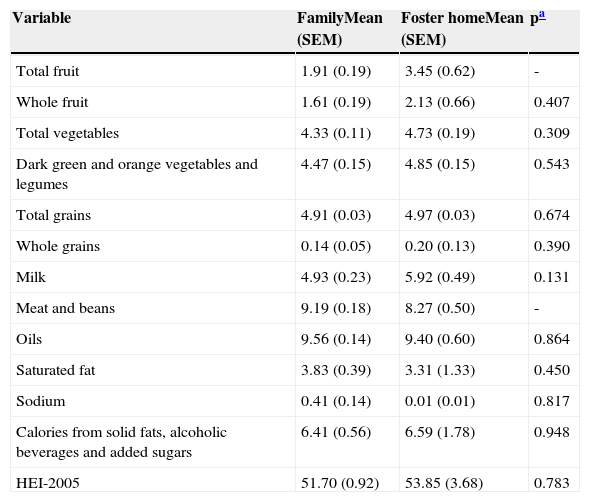
Two significant differences were identified in the analyses based on place of residence: higher means for fruit consumption (p=0.015) and lower means for meat and beans consumption (p=0.026) among adolescents living in foster care in comparison to those living with their families (Table 4).
Comparison of component means according place of residence; Instituto da Criança, São Paulo, Brazil, 2010.
| Variable | FamilyMean (SEM) | Foster homeMean (SEM) | pa |
|---|---|---|---|
| Total fruit | 1.91 (0.19) | 3.45 (0.62) | - |
| Whole fruit | 1.61 (0.19) | 2.13 (0.66) | 0.407 |
| Total vegetables | 4.33 (0.11) | 4.73 (0.19) | 0.309 |
| Dark green and orange vegetables and legumes | 4.47 (0.15) | 4.85 (0.15) | 0.543 |
| Total grains | 4.91 (0.03) | 4.97 (0.03) | 0.674 |
| Whole grains | 0.14 (0.05) | 0.20 (0.13) | 0.390 |
| Milk | 4.93 (0.23) | 5.92 (0.49) | 0.131 |
| Meat and beans | 9.19 (0.18) | 8.27 (0.50) | - |
| Oils | 9.56 (0.14) | 9.40 (0.60) | 0.864 |
| Saturated fat | 3.83 (0.39) | 3.31 (1.33) | 0.450 |
| Sodium | 0.41 (0.14) | 0.01 (0.01) | 0.817 |
| Calories from solid fats, alcoholic beverages and added sugars | 6.41 (0.56) | 6.59 (1.78) | 0.948 |
| HEI-2005 | 51.70 (0.92) | 53.85 (3.68) | 0.783 |
SEM, standard error of the mean.
In the present study, the mean HEI-2005 score was low among adolescents with HIV/AIDS and no associations were found between HEI-2005 scores and the independent variables analyzed, except in the stratified analyses.
A number of studies have employed the HEI/HEI-2005 to assess the diet quality of adolescents in the general population.16–19 However, only one study was found evaluating the diet of adolescents with HIV/AIDS.13 Kruzich et al.20 used a HEI containing nine items rather than ten, with the total ranging from 0 to 100 points, and found a mean score of 55.2 points, which is similar to that found in the present study. The components with the lowest means were sodium, cholesterol, fruits, and total fat. However, it is not possible to compare cholesterol and total fat, since these two items are not part of the HEI 2005. Regarding sodium, this item had the lowest of all scores in both studies. Kruzich et al. found high means for meat and total grains.20 In the present study, the means for these groups were among the highest. These findings indicate that adolescents with HIV in both Brazil and the United States have adequate meat and total grain consumption, as well as inadequate fruit and sodium intake.
Studies worldwide have assessed diet quality among adolescents not infected with HIV.16–19 Population-based studies conducted in Butantã (a district in the city of São Paulo) and the state of São Paulo used the HEI to evaluate diet quality among adolescents, reporting means of 58.2 and 59.7 points, respectively,16,17 which are comparable to the mean HEI-2005 score found for adolescents with HIV/AIDS in the present study.
Data on food consumption from the Third National Health and Nutrition Examination (NHANES III) carried out in the USA employing the HEI-2005 found a mean score of 54.8 points for adolescents aged 12 to 19 years.18 A study employing the same method assessed 1,104 Turkish adolescents aged 14 to 18 years and found similar results (HEI-2005 score: 51.5 points).19 Both studies offer evidence that low HEI/HEI-2005 scores are a global phenomenon, regardless of HIV infection.
The individual analysis of components allows for the identification of the main dietary inadequacies of a given population. In the present investigation, the components with the lowest means were whole grains, sodium, whole fruit, total fruit, calories from solid fats, alcoholic beverages, and added sugars and saturated fat, which is in agreement with findings described in previous studies.18–20 Data from the 2009 Brazilian Family Budget Survey (POF 2009) revealed low fruit intake by the Brazilian population. Even individuals in the 90th percentile for fruits and vegetables consumption fail to reach the WHO recommendation of 400g/day21 and only 6.4% of adolescents in the city of Sao Paulo meet this recommendation.22 Studies conducted worldwide also report insufficient intake regarding these two food groups.16–20,23
The second lowest mean intake regarded sodium. However, one should interpret this finding with caution, considering the complexity of the quantification of this micronutrient.24 Standardized recipes were used in the present study, which may have introduced measurement errors. However, a study conducted by Sarno et al., based on data from the 2003 Brazilian Family Budget Survey, points out that the availability of sodium in Brazilian households is twofold greater than the recommended intake.25 Other studies involving the HEI also found important sodium intake, reporting low to intermediate means for this item (ranging from 3.7 to 6.2 points).16–18 Moreover, the use of different cutoff points is a plausible hypothesis for divergences across studies.
The adolescents in the present study had low scores regarding calories from solid fats, alcoholic beverages, and added sugars, which were comparable to scores among American adolescents, as reported in NHANES III.26 This finding may be partially explained by the high consumption of carbonated soda and sandwich cookies, both rich in sugar. Data from the 2009 Brazilian Family Budget Survey revealed that sugar accounted for nearly 20% of total energy among individuals who consumed sandwich cookies; this survey also reports a high intake of sugary drinks (median consumption exceeding 120 grams/day),21 which is in agreement with the present findings. In another study, 50.9% of ninth grade adolescents reported having consumed sweets, 37.2% reported having consumed carbonated soda, and 36.2% reported having consumed cookies five or more days in the previous week.27 The consumption of carbonated soda, salty and sweet snacks, and pizza is a marker of unhealthy diets related to insufficient fiber ingestion regardless of HIV-infection status.
In contrast to findings from previous studies,16–20,26 high means were found for total vegetables, as well as dark green vegetables, orange vegetables, and legumes. These findings may be mainly attributed to the high consumption of beans in this population. In the HEI-2005, beans are included in total vegetables and dark green vegetables, orange vegetables, and legumes, simultaneously, if meat and beans recommendations are met.15 As meat consumption was adequate for many adolescents, beans were often attributed in both groups.
Two components differed significantly in the analyses stratified by place of residence. Among adolescents living in foster homes, higher fruit intake and lower intake of meat and beans were found in comparison to adolescents who lived with their families. Many foster homes in Brazil receive support from dietitians to plan menus and operate with government funding, donations from companies, and volunteer work.26 In contrast, no differences in means were found for the remaining items. It is known that foster institutions face adversities, such as high turnover of volunteers and employees due to low salaries and excessive workloads,28 which exert an impact on the quality of the service offered to residents.
No significant differences were found in the stratification by sex. Conflicting results are reported in previous studies. Analyzing adolescents in the state of São Paulo (Brazil), de Andrade et al.17 found higher mean scores among boys (about two points higher in comparison to girls). Analyzing American adolescents with HIV, Kruzich et al.20 found higher mean scores among girls (nearly two points higher). Akar Tek et al.19 found no differences between sexes among Turkish adolescents, which is in agreement with the present findings.
However, the analysis of diet components according to sex identified two differences, namely, milk and calories from solid fats, alcoholic beverages, and added sugars. The lower means among girls for calories from solid fats, alcoholic beverages, and added sugars is due to a greater ingestion of highly processed foods, which are generally rich in fat and sugar. A similar phenomenon was observed among school children evaluated during the 2009 Brazilian National Adolescent School-Based Health Survey (PeNSE 2009), as the consumption of sweets (58.3%) and snacks (38.2%) was greater among girls. According to this survey, 42.6% of girls had consumed sweets five days in the week prior to the inquiry.27 The inverse occurred with milk, for which boys had lower means. This finding differs from the results of the aforementioned survey, in which a greater proportion of boys (58.3% versus 49.4%) consumed milk at least five days a week.27
The HEI-2005 was not associated with any of the variables analyzed in the present study and there is no consensus in the literature regarding which variables correlate to this index. Like other instruments, the HEI/HEI-2005 is greatly influenced by the composition and characteristics of the study population. Moreover, food consumption is difficult to measure due to the influence of different individual and environmental factors.29 Despite this difficulty, other studies have found associations with housing type (shanty versus house/apartment),17 low level of parental education,19 and overweight/obesity.23,30
It is important to take into account some limitations of this study. The first is the study design. Cross sectional studies provide weaker evidence when compared to other study designs. However, in this case, the design was useful to describe the diet quality of adolescents with HIV/AIDS in follow up at a referral hospital. Though no sampling procedures were performed, a study population recruited in a hospital such as Instituto da Criança (ICr), which has been treating HIV/AIDS in a significant number of pediatric patients from all social strata and even from other states since the beginning of the AIDS epidemic in Brazil, is a reasonable alternative.
In conclusion, the assessment of diet quality among adolescents with HIV/AIDS using the HEI revealed similar results to those found in the general adolescent population: high intake of sugar, saturated fat, and sodium, and insufficient intake of whole grains and fruits. Therefore, despite representing part of a population that requires special attention, adolescents with HIV/AIDS exhibit a similar eating pattern to that of non-infected adolescents. Nonetheless, most adolescents under treatment for HIV/AIDS are exposed to another risk factor for the development of chronic diseases, namely, HAART. Thus, this population needs to maintain an adequate diet. In order to achieve this goal, periodical in-depth dietary assessments of adolescents with HIV/AIDS are recommended, so that dietitians can identify and address inadequate eating practices. Pediatricians and other health professionals of the multidisciplinary team should reinforce to patients the importance of a healthy diet to help preserve the immune function and to mitigate the risks imposed by both the disease and its treatment.
FundingThis study was funded by Fundação de Amparo à Pesquisa do Estado de São Paulo (FAPESP), Conselho Nacional de Desenvolvimento Científico e Tecnológico (CNPq), and Coordenação de Aperfeiçoamento de Pessoal de Nível Superior (CAPES).
Conflicts of interestAline M Silva has worked for Janssen Pharmaceutical Companies of Johnson & Johnson since May of 2012.
The authors would like to thank the medical team of the Infectious Diseases Unit of Instituto da Criança: Dra Samatha Brasil Andrade, Cláudia Menezes, Vera Lúcia Moyses Borelli, Maria de Fátima Carvalho, and Nádia Litvinov for all their support. They also thank Sofia de Fátima da Silva Barbosa de Oliveira, Flávia Monique Santos, and Elissa Caroline Mendes for assisting with data collection.
Please cite this article as: Tanaka LF, Latorre MR, Silva AM, Konstantyner TC, Mendes EC, Marques HH. Poor diet quality among Brazilian adolescents with HIV/AIDS. J Pediatr (Rio J). 2015;91:152–9.


