
To describe the dietary patterns of children inside and outside school and investigate their associations with sociodemographic factors and nutritional status.
MethodsThis was a multicenter cross-sectional study in which children of both sexes, aged 1–6 years, attending private and public daycare centers and preschools in Brazil, were evaluated (n=2979). Demographic, socioeconomic and dietary data (weighed food records and estimated food records) were collected. Dietary patterns were derived by factor analysis from 36 food groups.
ResultsFour dietary patterns were identified inside school, and three outside. Inside school, the “traditional” pattern was associated to low income and presented high nutritional quality. The “dual” pattern was associated with low income and with high intake of added sugar and glycemic load. The “snack” pattern was associated with children enrolled at private schools and with high intake of added sugar and glycemic load. The “bread and butter” pattern was associated with high intake of added sugar and trans fat. Outside school, the “traditional” pattern was associated with high intake of saturated fat, trans fats, sodium, and total fiber. The “bread and butter” pattern was associated with high intake of trans fats and glycemic load, whereas the “snack” pattern was associated with overweight, private schools, high income, and high intake of trans fats, sodium, and total fiber.
ConclusionThere are differences in the nutritional quality of dietary patterns inside and outside school, and heterogeneity in adherence to these patterns were observed across regions and socioeconomic classes.
Descrever os padrões alimentares de crianças dentro e fora da escola e investigar a sua associação com fatores sociodemográficos e estado nutricional.
MétodosTrata-se de um estudo multicêntrico transversal, no qual foram avaliadas crianças de 1 a 6 anos de ambos os sexos, atendidas em creches públicas e privadas e pré-escolas no Brasil (n=2979). Foram coletados dados demográficos, socioeconômicos e dietéticos. Os padrões alimentares foram derivados por análise fatorial a partir de 36 grupos de alimentos.
ResultadosQuatro padrões alimentares foram identificados dentro da creche e três fora da creche. Dentro da creche, o padrão “tradicional” foi associado a menor renda e apresentou melhor qualidade nutricional. O padrão “dual” associou-se a menor renda e maior ingestão de açúcar de adição e carga glicêmica. O padrão “lanches” foi associado a crianças matriculadas em escolas privadas e com maior ingestão de açúcar de adição e carga glicêmica. O padrão “pão com manteiga” associou-se a maior ingestão de açúcar de adição e gordura trans. Fora da creche, o padrão “tradicional” foi associado a maior ingestão de gordura saturada, trans, sódio e fibra. O padrão “pão com manteiga” associou-se a maior ingestão de gordura trans e carga glicêmica, enquanto o padrão “lanches” associou-se às crianças com excesso de peso, de creches privadas, maior renda e com maior ingestão de gordura trans, sódio e fibra.
ConclusãoHouve diferença na qualidade nutricional dos padrões dentro e fora da escola e a aderência a esses ocorreu de forma heterogênea nas regiões e classes socioeconômicas.
The investigation of dietary patterns can help elucidate the complex relationship between diet and health by considering the simultaneous effect of multiple foods and dietetic components, as well as their interactions, on the occurrence of one or more outcomes of interest.1
In the past decades, transitions in dietary intake among children have been observed and characterized by a higher intake of foods rich in fats, sodium, and sugar and by lower intakes of nutrient dense foods such as fruit and vegetables.2,3 These changes in food intake have had a major impact on the development of obesity and nutritional deficits. In addition, studies have suggested the role of childhood nutrition on the development of morbidity in further life cycles, such as in adulthood.4,5
Therefore, identifying the dietary patterns experienced by children in different environment settings is essential to guide public policies and educational actions regarding health and nutrition in the early stages of life. Thus, the objective of the present study was to describe the dietary patterns inside and outside the school setting and to investigate their associations with demographic, socioeconomic, and nutritional status of children in Brazil.
2Methods2.1Study populationData were gathered from a multicenter cross-sectional study conducted in 2007 among children aged 1–6 years who attended private and public daycare centers and preschools. A total of 85 primary schools (54 public and 31 private) were included from nine Brazilian cities (Manaus, Recife, Natal, Brasília, Cuiabá, Caxias do Sul, Viçosa, Rio de Janeiro, and São Paulo) located in five regions. The eligibility criteria for inclusion of the schools in the study were: be located in the urban area of the city, full-day attendance, and have a conventional serving system for meals.6
In each city, 350 children were assessed, of whom 250 were from public and 100 from private schools. The proportion of interviews in public and private schools in each city was based on the number of enrolments in daycare centers and preschools according to data from the National School Census conducted in 2005 by the Brazilian Ministry of Education. The sample size for each city was estimated at 350 subjects based on the estimated prevalence of inadequate nutritional intake (approximately 65%), with a margin of error of 5% and a confidence level of 95%. All children whose parents or guardians authorized data collection by signing an informed consent were assessed, comprising a total sample of 3058 preschoolers. For the present study, 79 children were excluded from the analysis due to incomplete food intake data, leading to a final sample of 2979 children of both genders.
Data was collected between February and December of 2007 by undergraduate nutrition students, trained and supervised by nutrition researchers in each city. In order to standardize data collection, structured forms and manuals with specific guidelines for the study were developed and used.6
This study was approved by the Research Ethics Committee at the Federal University of São Paulo, in accordance with the principles of the Declaration of Helsinki for research involving human subjects. An informed consent was obtained from the parents or guardians of the children evaluated.
2.2Socioeconomic dataSocioeconomic data were collected from parents or guardians using the structured questionnaire published in 2003 by the Associação Brasileira de Empresas de Pesquisa (APEP). This questionnaire was designed to estimate the purchasing power of families. The economic classes and mean family income were defined by applying the cut-off scores of the Brazilian Economic Classification Criterion,7 which is used by ABEP and takes into account the number of consumer goods available in the household, such as TVs, refrigerators, and cars, among others, and the level of education of the head of the household.
2.3Anthropometric dataData on weight and height were measured in duplicate by the study team. Weight was measured in kilograms using a calibrated digital scale, model Glass-6, accuracy: 100g (G-Tech®, USA), whereas height was measured in centimeters using a portable wall-mounted stadiometer affixed to a smooth wall without base board model 206, accuracy: 1mm (Seca®, USA).
Height data for children younger than 2 years was corrected by adding 0.7cm to the measurement,8 since children in this age group should be measured in the recumbent position. The classification of nutritional status was determined based on z-score values of body mass index (BMI)-for-age and cutoffs proposed by the World Health Organization8 (<−2 SD; ≥−2 SD and ≤+1 SD; >+1 SD and ≤+2 SD; >+2 SD); children were then categorized as underweight, normal weight, overweight, or obese, respectively.
2.4Dietary dataAt schools, dietary data were obtained using the weighed food records (WFRs). For this, three samples of each food and beverage were portioned out by the food service attendant and weighed by the undergraduate nutrition student on a calibrated electronic scale, model MEA06030, maximum capacity: 3kg, accurate to 1g (Plenna®, SP, Brazil). The arithmetic means of the three samples were calculated and considered as the amount of food and beverages offered to all children.
All leftovers from each plate were collected in individual bags and weighed. The beverages were weighed separately. A proportional estimate of the contribution of individual foods to the total plate waste was calculated for each child. The amounts of foods and beverages eaten at school mealtime were estimated by the difference between the portion offered and the individual plate waste of each child.
Dietary intake outside the school environment was evaluated using the estimated food record (EFR) method, completed by parents or guardians on the same day of the WFR completion, in order to determine the total food intake of one day.
Food questionnaires were entered into the software Nutrition Data System for Research (Nutrition Coordinating Center, 2007 version – University of Minnesota, USA), which uses the American food composition database developed by the United States Department of Agriculture (USDA).
A second dietary measurement was performed on non-consecutive days in about 25% of the sample. In each city, a maximum of 87 children were randomly selected for reevaluation.
2.5Statistical analysisIn order to identify the dietary patterns inside and outside the school environment, 828 different foods were collapsed into 36 groups, according to their nutritional value, culinary usage, and dietary habits.
Food groups were submitted to exploratory factor analysis, in order to derive the dietary patterns inside and outside school. Initially, factors with Eigenvalues greater than or equal to 1.25 were retained, yielding nine factors to represent the dietary pattern inside school versus five factors outside school. In the second stage, the screen plot was visually inspected, suggesting the retention of four factors inside and three factors outside school. Varimax orthogonal rotation was applied to improve the interpretability of the matrix of factor loadings. Factor loadings greater than or equal to |0.30| were considered to contribute to the pattern.
Factor scores were estimated in order to investigate the association of the adherence to the dietary patterns with demographic and socioeconomic variables as well as with nutritional status. For this, the Mann–Whitney U-test and Kruskal–Wallis were performed in Stata software (StataCorp. 2011, Stata Statistical Software: Release 12, College Station, USA).
Aiming to evaluate the association between adherence to dietary patterns and usual intake of nutritional quality markers, namely saturated fat, trans fats, salt, added sugar, total fiber, and glycemic load, the statistical modeling techniques incorporated in the multiple source method online platform were applied. Individual usual nutrient intakes were expressed in grams or micrograms per 1000kcal of energy, and their associations with adherence to dietary patterns was evaluated using the Kruskal–Wallis.
3ResultsThe sample consisted of 2979 children, most of whom were boys (51.16%), with normal weight (63.48%), aged between 3 and 6 years (69.22%), living in the Southeast region (36.93%), and from low-income families (73.83%; family income under 520.77 dollars per month).
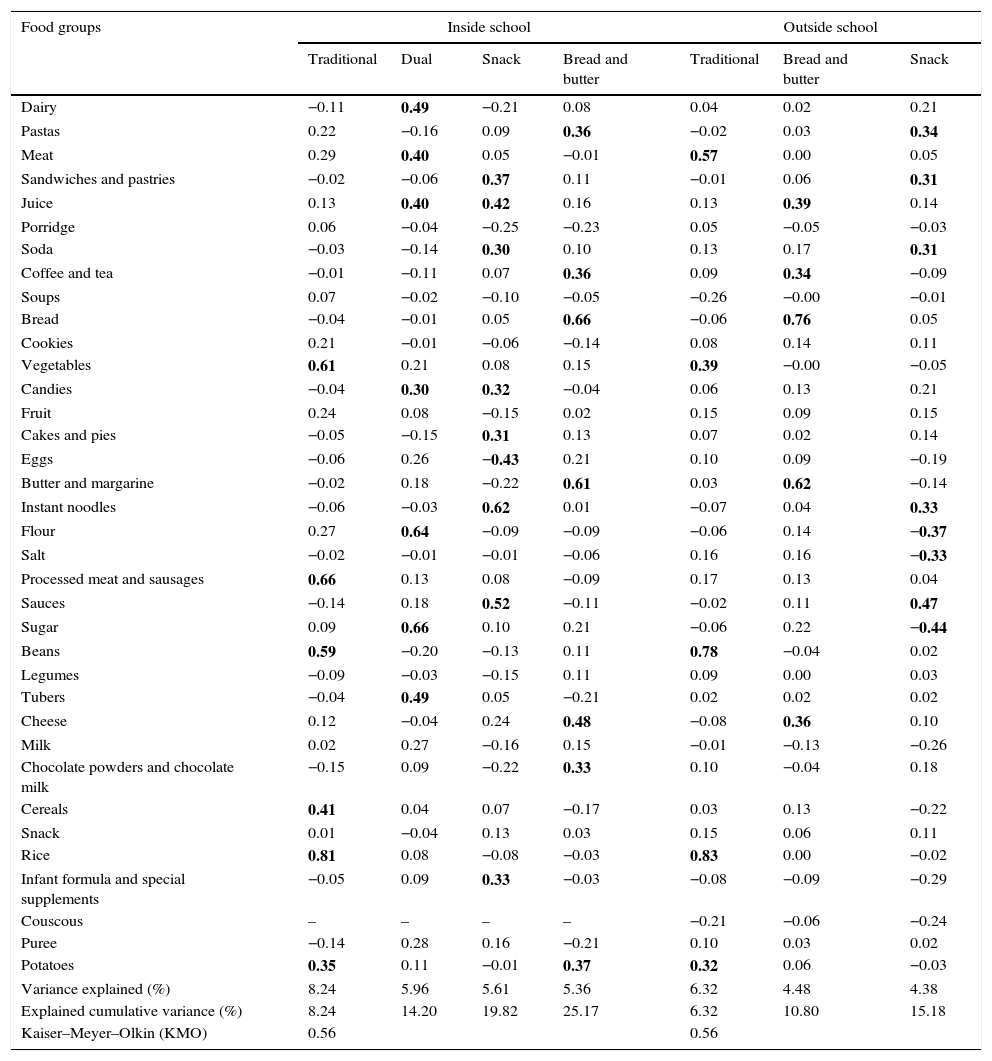
Exploratory factor analysis allowed for the identification of four dietary patterns inside school, termed “traditional,” “dual,” “snack,” and “bread and butter”. These patterns explained 25.17% of the total variance of the data. The “traditional” pattern comprised rice, beans, processed meat and sausages, vegetables, potatoes, and cereals (positive loadings); “dual” pattern comprised flour, meat, juice, sugar, dairy, candies, and tubers (positive loadings); “snack” pattern comprised instant noodles, sauces, sandwiches and pastries, soda, juice, cakes and pies, candies, and infant formula and special supplements (positive loadings), and eggs (negative loading); and the “bread and butter” pattern comprised bread, butter and margarine, coffee and tea, chocolate powders and chocolate milk, cheese, and pastas (positive loadings). The assessment of dietary pattern outside school also identified three patterns, labeled “traditional,” “bread and butter,” and “snack,” which explained 15.18% of the total variance of the data. The “traditional” pattern comprised rice, beans, meat, vegetables, and potatoes (positive loadings); “bread and butter” comprised bread, butter and margarine, cheese, juice, and coffee and tea (positive loadings); and “snack” pattern comprised instant noodles, pastas, sauces, sandwiches and pastries, and soda (positive loadings) and sugar, salt, and flour (negative loadings; Table 1).
Factor loading for dietary patterns inside and outside the school of preschoolers in a multicenter study conducted in Brazil (n=2979), Brazil, 2007.
| Food groups | Inside school | Outside school | |||||
|---|---|---|---|---|---|---|---|
| Traditional | Dual | Snack | Bread and butter | Traditional | Bread and butter | Snack | |
| Dairy | −0.11 | 0.49 | −0.21 | 0.08 | 0.04 | 0.02 | 0.21 |
| Pastas | 0.22 | −0.16 | 0.09 | 0.36 | −0.02 | 0.03 | 0.34 |
| Meat | 0.29 | 0.40 | 0.05 | −0.01 | 0.57 | 0.00 | 0.05 |
| Sandwiches and pastries | −0.02 | −0.06 | 0.37 | 0.11 | −0.01 | 0.06 | 0.31 |
| Juice | 0.13 | 0.40 | 0.42 | 0.16 | 0.13 | 0.39 | 0.14 |
| Porridge | 0.06 | −0.04 | −0.25 | −0.23 | 0.05 | −0.05 | −0.03 |
| Soda | −0.03 | −0.14 | 0.30 | 0.10 | 0.13 | 0.17 | 0.31 |
| Coffee and tea | −0.01 | −0.11 | 0.07 | 0.36 | 0.09 | 0.34 | −0.09 |
| Soups | 0.07 | −0.02 | −0.10 | −0.05 | −0.26 | −0.00 | −0.01 |
| Bread | −0.04 | −0.01 | 0.05 | 0.66 | −0.06 | 0.76 | 0.05 |
| Cookies | 0.21 | −0.01 | −0.06 | −0.14 | 0.08 | 0.14 | 0.11 |
| Vegetables | 0.61 | 0.21 | 0.08 | 0.15 | 0.39 | −0.00 | −0.05 |
| Candies | −0.04 | 0.30 | 0.32 | −0.04 | 0.06 | 0.13 | 0.21 |
| Fruit | 0.24 | 0.08 | −0.15 | 0.02 | 0.15 | 0.09 | 0.15 |
| Cakes and pies | −0.05 | −0.15 | 0.31 | 0.13 | 0.07 | 0.02 | 0.14 |
| Eggs | −0.06 | 0.26 | −0.43 | 0.21 | 0.10 | 0.09 | −0.19 |
| Butter and margarine | −0.02 | 0.18 | −0.22 | 0.61 | 0.03 | 0.62 | −0.14 |
| Instant noodles | −0.06 | −0.03 | 0.62 | 0.01 | −0.07 | 0.04 | 0.33 |
| Flour | 0.27 | 0.64 | −0.09 | −0.09 | −0.06 | 0.14 | −0.37 |
| Salt | −0.02 | −0.01 | −0.01 | −0.06 | 0.16 | 0.16 | −0.33 |
| Processed meat and sausages | 0.66 | 0.13 | 0.08 | −0.09 | 0.17 | 0.13 | 0.04 |
| Sauces | −0.14 | 0.18 | 0.52 | −0.11 | −0.02 | 0.11 | 0.47 |
| Sugar | 0.09 | 0.66 | 0.10 | 0.21 | −0.06 | 0.22 | −0.44 |
| Beans | 0.59 | −0.20 | −0.13 | 0.11 | 0.78 | −0.04 | 0.02 |
| Legumes | −0.09 | −0.03 | −0.15 | 0.11 | 0.09 | 0.00 | 0.03 |
| Tubers | −0.04 | 0.49 | 0.05 | −0.21 | 0.02 | 0.02 | 0.02 |
| Cheese | 0.12 | −0.04 | 0.24 | 0.48 | −0.08 | 0.36 | 0.10 |
| Milk | 0.02 | 0.27 | −0.16 | 0.15 | −0.01 | −0.13 | −0.26 |
| Chocolate powders and chocolate milk | −0.15 | 0.09 | −0.22 | 0.33 | 0.10 | −0.04 | 0.18 |
| Cereals | 0.41 | 0.04 | 0.07 | −0.17 | 0.03 | 0.13 | −0.22 |
| Snack | 0.01 | −0.04 | 0.13 | 0.03 | 0.15 | 0.06 | 0.11 |
| Rice | 0.81 | 0.08 | −0.08 | −0.03 | 0.83 | 0.00 | −0.02 |
| Infant formula and special supplements | −0.05 | 0.09 | 0.33 | −0.03 | −0.08 | −0.09 | −0.29 |
| Couscous | – | – | – | – | −0.21 | −0.06 | −0.24 |
| Puree | −0.14 | 0.28 | 0.16 | −0.21 | 0.10 | 0.03 | 0.02 |
| Potatoes | 0.35 | 0.11 | −0.01 | 0.37 | 0.32 | 0.06 | −0.03 |
| Variance explained (%) | 8.24 | 5.96 | 5.61 | 5.36 | 6.32 | 4.48 | 4.38 |
| Explained cumulative variance (%) | 8.24 | 14.20 | 19.82 | 25.17 | 6.32 | 10.80 | 15.18 |
| Kaiser–Meyer–Olkin (KMO) | 0.56 | 0.56 | |||||
The bold values are food groups with factor loadings greater than or equal to −0.30 or +0.30.
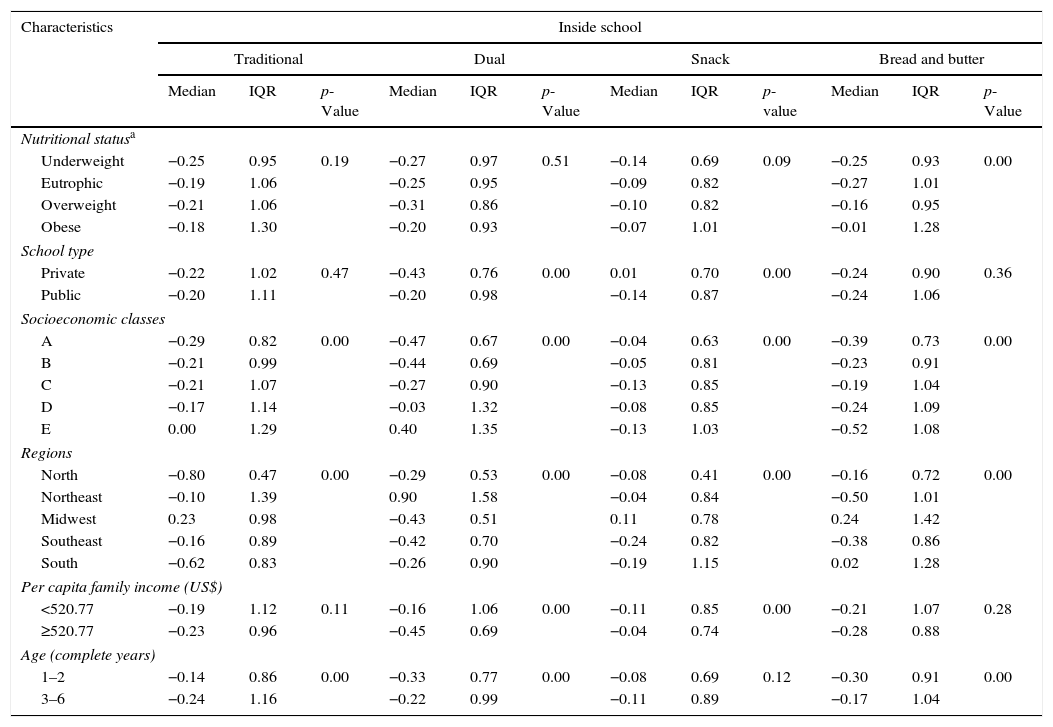
Table 2 presents the median scores for dietary patterns identified inside school and their relationship with sociodemographic variables and nutritional status. A greater adherence to the “traditional” pattern was observed in children from socioeconomic class E than in those from class A, living in the Midwest region. The adherence to the “dual” pattern was higher in children from socioeconomic class E than in those from class A and those who lived in the Northeast region. The adherence to the “snack” pattern was higher in children enrolled at private schools and living in Midwest region, while adherence to the “bread and butter” pattern was higher in children living in the Midwest and South regions.
Median score of each dietary pattern inside school according to socio-demographic characteristics and nutritional status of preschoolers in a multicenter study conducted in Brazil (n=2979), Brazil, 2007.
| Characteristics | Inside school | |||||||||||
|---|---|---|---|---|---|---|---|---|---|---|---|---|
| Traditional | Dual | Snack | Bread and butter | |||||||||
| Median | IQR | p-Value | Median | IQR | p-Value | Median | IQR | p-value | Median | IQR | p-Value | |
| Nutritional statusa | ||||||||||||
| Underweight | −0.25 | 0.95 | 0.19 | −0.27 | 0.97 | 0.51 | −0.14 | 0.69 | 0.09 | −0.25 | 0.93 | 0.00 |
| Eutrophic | −0.19 | 1.06 | −0.25 | 0.95 | −0.09 | 0.82 | −0.27 | 1.01 | ||||
| Overweight | −0.21 | 1.06 | −0.31 | 0.86 | −0.10 | 0.82 | −0.16 | 0.95 | ||||
| Obese | −0.18 | 1.30 | −0.20 | 0.93 | −0.07 | 1.01 | −0.01 | 1.28 | ||||
| School type | ||||||||||||
| Private | −0.22 | 1.02 | 0.47 | −0.43 | 0.76 | 0.00 | 0.01 | 0.70 | 0.00 | −0.24 | 0.90 | 0.36 |
| Public | −0.20 | 1.11 | −0.20 | 0.98 | −0.14 | 0.87 | −0.24 | 1.06 | ||||
| Socioeconomic classes | ||||||||||||
| A | −0.29 | 0.82 | 0.00 | −0.47 | 0.67 | 0.00 | −0.04 | 0.63 | 0.00 | −0.39 | 0.73 | 0.00 |
| B | −0.21 | 0.99 | −0.44 | 0.69 | −0.05 | 0.81 | −0.23 | 0.91 | ||||
| C | −0.21 | 1.07 | −0.27 | 0.90 | −0.13 | 0.85 | −0.19 | 1.04 | ||||
| D | −0.17 | 1.14 | −0.03 | 1.32 | −0.08 | 0.85 | −0.24 | 1.09 | ||||
| E | 0.00 | 1.29 | 0.40 | 1.35 | −0.13 | 1.03 | −0.52 | 1.08 | ||||
| Regions | ||||||||||||
| North | −0.80 | 0.47 | 0.00 | −0.29 | 0.53 | 0.00 | −0.08 | 0.41 | 0.00 | −0.16 | 0.72 | 0.00 |
| Northeast | −0.10 | 1.39 | 0.90 | 1.58 | −0.04 | 0.84 | −0.50 | 1.01 | ||||
| Midwest | 0.23 | 0.98 | −0.43 | 0.51 | 0.11 | 0.78 | 0.24 | 1.42 | ||||
| Southeast | −0.16 | 0.89 | −0.42 | 0.70 | −0.24 | 0.82 | −0.38 | 0.86 | ||||
| South | −0.62 | 0.83 | −0.26 | 0.90 | −0.19 | 1.15 | 0.02 | 1.28 | ||||
| Per capita family income (US$) | ||||||||||||
| <520.77 | −0.19 | 1.12 | 0.11 | −0.16 | 1.06 | 0.00 | −0.11 | 0.85 | 0.00 | −0.21 | 1.07 | 0.28 |
| ≥520.77 | −0.23 | 0.96 | −0.45 | 0.69 | −0.04 | 0.74 | −0.28 | 0.88 | ||||
| Age (complete years) | ||||||||||||
| 1–2 | −0.14 | 0.86 | 0.00 | −0.33 | 0.77 | 0.00 | −0.08 | 0.69 | 0.12 | −0.30 | 0.91 | 0.00 |
| 3–6 | −0.24 | 1.16 | −0.22 | 0.99 | −0.11 | 0.89 | −0.17 | 1.04 | ||||
According to the body mass index (BMI) cutoff points for age and sex proposed by the World Health Organization (WHO).8
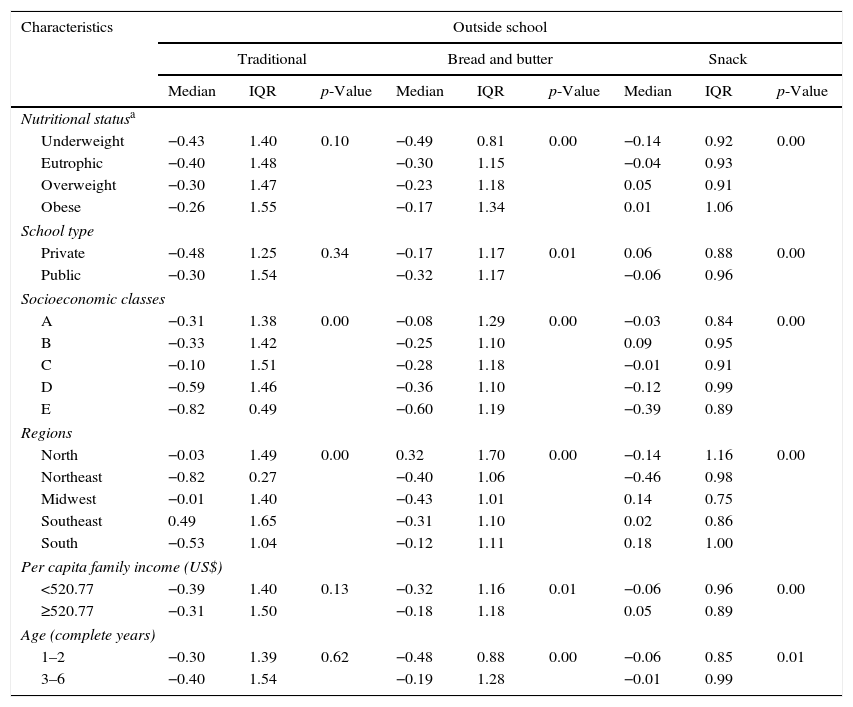
Considering the dietary patterns identified outside school, adherence to the “traditional” was higher in children from Southeast region, while adherence to the “bread and butter” pattern was higher in children from North region. The adherence to the “snack” pattern was higher in overweight and obese children, enrolled at private schools, from socioeconomic class B than from class E, from Midwest, Southeast and South regions and with per capita family income ≥520.77US$ (Table 3).
Median score of each dietary pattern outside school according to socio-demographic characteristics and nutritional status of preschoolers in a multicenter study conducted in Brazil (n=2979), Brazil, 2007.
| Characteristics | Outside school | ||||||||
|---|---|---|---|---|---|---|---|---|---|
| Traditional | Bread and butter | Snack | |||||||
| Median | IQR | p-Value | Median | IQR | p-Value | Median | IQR | p-Value | |
| Nutritional statusa | |||||||||
| Underweight | −0.43 | 1.40 | 0.10 | −0.49 | 0.81 | 0.00 | −0.14 | 0.92 | 0.00 |
| Eutrophic | −0.40 | 1.48 | −0.30 | 1.15 | −0.04 | 0.93 | |||
| Overweight | −0.30 | 1.47 | −0.23 | 1.18 | 0.05 | 0.91 | |||
| Obese | −0.26 | 1.55 | −0.17 | 1.34 | 0.01 | 1.06 | |||
| School type | |||||||||
| Private | −0.48 | 1.25 | 0.34 | −0.17 | 1.17 | 0.01 | 0.06 | 0.88 | 0.00 |
| Public | −0.30 | 1.54 | −0.32 | 1.17 | −0.06 | 0.96 | |||
| Socioeconomic classes | |||||||||
| A | −0.31 | 1.38 | 0.00 | −0.08 | 1.29 | 0.00 | −0.03 | 0.84 | 0.00 |
| B | −0.33 | 1.42 | −0.25 | 1.10 | 0.09 | 0.95 | |||
| C | −0.10 | 1.51 | −0.28 | 1.18 | −0.01 | 0.91 | |||
| D | −0.59 | 1.46 | −0.36 | 1.10 | −0.12 | 0.99 | |||
| E | −0.82 | 0.49 | −0.60 | 1.19 | −0.39 | 0.89 | |||
| Regions | |||||||||
| North | −0.03 | 1.49 | 0.00 | 0.32 | 1.70 | 0.00 | −0.14 | 1.16 | 0.00 |
| Northeast | −0.82 | 0.27 | −0.40 | 1.06 | −0.46 | 0.98 | |||
| Midwest | −0.01 | 1.40 | −0.43 | 1.01 | 0.14 | 0.75 | |||
| Southeast | 0.49 | 1.65 | −0.31 | 1.10 | 0.02 | 0.86 | |||
| South | −0.53 | 1.04 | −0.12 | 1.11 | 0.18 | 1.00 | |||
| Per capita family income (US$) | |||||||||
| <520.77 | −0.39 | 1.40 | 0.13 | −0.32 | 1.16 | 0.01 | −0.06 | 0.96 | 0.00 |
| ≥520.77 | −0.31 | 1.50 | −0.18 | 1.18 | 0.05 | 0.89 | |||
| Age (complete years) | |||||||||
| 1–2 | −0.30 | 1.39 | 0.62 | −0.48 | 0.88 | 0.00 | −0.06 | 0.85 | 0.01 |
| 3–6 | −0.40 | 1.54 | −0.19 | 1.28 | −0.01 | 0.99 | |||
According to the body mass index (BMI) cutoff points for age and sex proposed by the World Health Organization (WHO).8
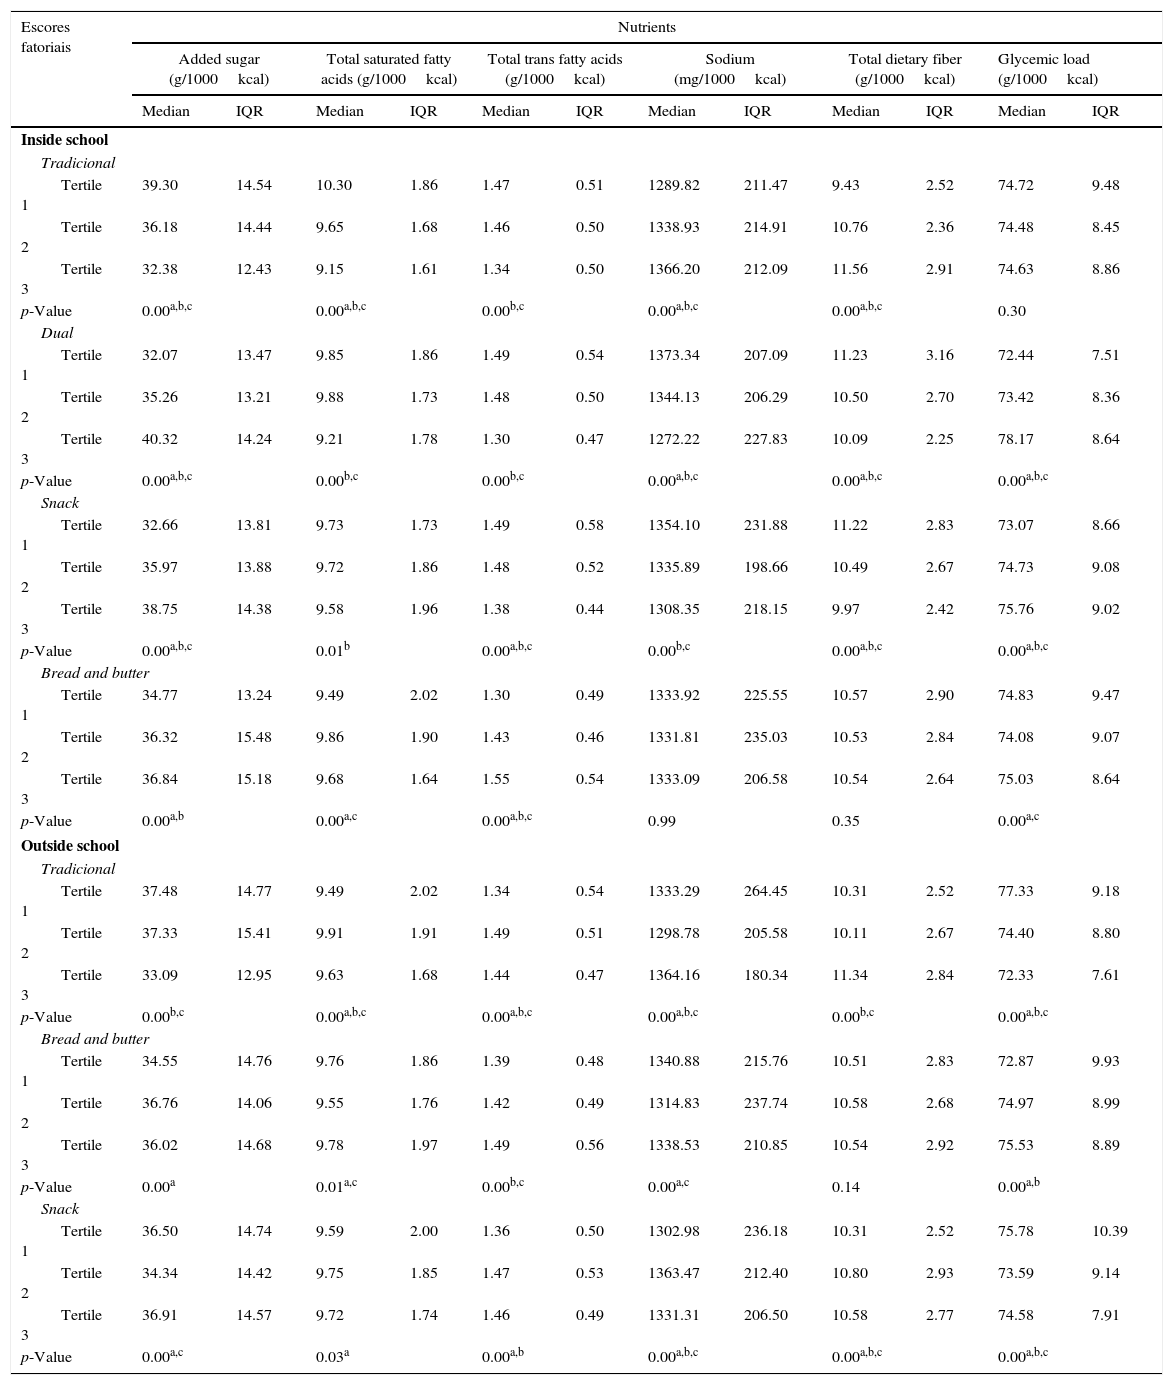
The association between nutrient intake and the factor scores of the dietary patterns inside and outside school was described in Table 4. The comparison of children with higher adherence (third tertile) with those who showed lower adherence (first tertile) to the dietary pattern indicated that in the “traditional” (school) pattern, there was a lower intake of added sugar, saturated fat, trans fat, along with a higher total fiber and sodium intake. In the “dual” pattern, there was a higher intake of added sugar and glycemic load and lower intake of saturated fat, trans fat, sodium, and total dietary fiber. In the “snack” pattern, there was a higher intake of added sugar and glycemic load and lower intake of saturated fat, trans fat, sodium, and total fiber. In the “bread and butter” pattern, there was a higher intake of added sugar and trans fat. Regarding the patterns outside school, the “traditional” was associated with higher intakes of saturated fat, trans fat, sodium, and total dietary fiber, along with lower intakes of added sugar and glycemic load. In the “bread and butter” pattern, there was a higher intake of trans fat and glycemic load. The “snack” pattern was associated with a higher intake of trans fat, sodium, and total dietary fiber and lower intake of glycemic load.
Median nutrient intake according to tertiles of adherence to dietary patterns inside and outside school of preschoolers in a multicenter study conducted in Brazil (n=2979), Brazil, 2007.
| Escores fatoriais | Nutrients | |||||||||||
|---|---|---|---|---|---|---|---|---|---|---|---|---|
| Added sugar (g/1000kcal) | Total saturated fatty acids (g/1000kcal) | Total trans fatty acids (g/1000kcal) | Sodium (mg/1000kcal) | Total dietary fiber (g/1000kcal) | Glycemic load (g/1000kcal) | |||||||
| Median | IQR | Median | IQR | Median | IQR | Median | IQR | Median | IQR | Median | IQR | |
| Inside school | ||||||||||||
| Tradicional | ||||||||||||
| Tertile 1 | 39.30 | 14.54 | 10.30 | 1.86 | 1.47 | 0.51 | 1289.82 | 211.47 | 9.43 | 2.52 | 74.72 | 9.48 |
| Tertile 2 | 36.18 | 14.44 | 9.65 | 1.68 | 1.46 | 0.50 | 1338.93 | 214.91 | 10.76 | 2.36 | 74.48 | 8.45 |
| Tertile 3 | 32.38 | 12.43 | 9.15 | 1.61 | 1.34 | 0.50 | 1366.20 | 212.09 | 11.56 | 2.91 | 74.63 | 8.86 |
| p-Value | 0.00a,b,c | 0.00a,b,c | 0.00b,c | 0.00a,b,c | 0.00a,b,c | 0.30 | ||||||
| Dual | ||||||||||||
| Tertile 1 | 32.07 | 13.47 | 9.85 | 1.86 | 1.49 | 0.54 | 1373.34 | 207.09 | 11.23 | 3.16 | 72.44 | 7.51 |
| Tertile 2 | 35.26 | 13.21 | 9.88 | 1.73 | 1.48 | 0.50 | 1344.13 | 206.29 | 10.50 | 2.70 | 73.42 | 8.36 |
| Tertile 3 | 40.32 | 14.24 | 9.21 | 1.78 | 1.30 | 0.47 | 1272.22 | 227.83 | 10.09 | 2.25 | 78.17 | 8.64 |
| p-Value | 0.00a,b,c | 0.00b,c | 0.00b,c | 0.00a,b,c | 0.00a,b,c | 0.00a,b,c | ||||||
| Snack | ||||||||||||
| Tertile 1 | 32.66 | 13.81 | 9.73 | 1.73 | 1.49 | 0.58 | 1354.10 | 231.88 | 11.22 | 2.83 | 73.07 | 8.66 |
| Tertile 2 | 35.97 | 13.88 | 9.72 | 1.86 | 1.48 | 0.52 | 1335.89 | 198.66 | 10.49 | 2.67 | 74.73 | 9.08 |
| Tertile 3 | 38.75 | 14.38 | 9.58 | 1.96 | 1.38 | 0.44 | 1308.35 | 218.15 | 9.97 | 2.42 | 75.76 | 9.02 |
| p-Value | 0.00a,b,c | 0.01b | 0.00a,b,c | 0.00b,c | 0.00a,b,c | 0.00a,b,c | ||||||
| Bread and butter | ||||||||||||
| Tertile 1 | 34.77 | 13.24 | 9.49 | 2.02 | 1.30 | 0.49 | 1333.92 | 225.55 | 10.57 | 2.90 | 74.83 | 9.47 |
| Tertile 2 | 36.32 | 15.48 | 9.86 | 1.90 | 1.43 | 0.46 | 1331.81 | 235.03 | 10.53 | 2.84 | 74.08 | 9.07 |
| Tertile 3 | 36.84 | 15.18 | 9.68 | 1.64 | 1.55 | 0.54 | 1333.09 | 206.58 | 10.54 | 2.64 | 75.03 | 8.64 |
| p-Value | 0.00a,b | 0.00a,c | 0.00a,b,c | 0.99 | 0.35 | 0.00a,c | ||||||
| Outside school | ||||||||||||
| Tradicional | ||||||||||||
| Tertile 1 | 37.48 | 14.77 | 9.49 | 2.02 | 1.34 | 0.54 | 1333.29 | 264.45 | 10.31 | 2.52 | 77.33 | 9.18 |
| Tertile 2 | 37.33 | 15.41 | 9.91 | 1.91 | 1.49 | 0.51 | 1298.78 | 205.58 | 10.11 | 2.67 | 74.40 | 8.80 |
| Tertile 3 | 33.09 | 12.95 | 9.63 | 1.68 | 1.44 | 0.47 | 1364.16 | 180.34 | 11.34 | 2.84 | 72.33 | 7.61 |
| p-Value | 0.00b,c | 0.00a,b,c | 0.00a,b,c | 0.00a,b,c | 0.00b,c | 0.00a,b,c | ||||||
| Bread and butter | ||||||||||||
| Tertile 1 | 34.55 | 14.76 | 9.76 | 1.86 | 1.39 | 0.48 | 1340.88 | 215.76 | 10.51 | 2.83 | 72.87 | 9.93 |
| Tertile 2 | 36.76 | 14.06 | 9.55 | 1.76 | 1.42 | 0.49 | 1314.83 | 237.74 | 10.58 | 2.68 | 74.97 | 8.99 |
| Tertile 3 | 36.02 | 14.68 | 9.78 | 1.97 | 1.49 | 0.56 | 1338.53 | 210.85 | 10.54 | 2.92 | 75.53 | 8.89 |
| p-Value | 0.00a | 0.01a,c | 0.00b,c | 0.00a,c | 0.14 | 0.00a,b | ||||||
| Snack | ||||||||||||
| Tertile 1 | 36.50 | 14.74 | 9.59 | 2.00 | 1.36 | 0.50 | 1302.98 | 236.18 | 10.31 | 2.52 | 75.78 | 10.39 |
| Tertile 2 | 34.34 | 14.42 | 9.75 | 1.85 | 1.47 | 0.53 | 1363.47 | 212.40 | 10.80 | 2.93 | 73.59 | 9.14 |
| Tertile 3 | 36.91 | 14.57 | 9.72 | 1.74 | 1.46 | 0.49 | 1331.31 | 206.50 | 10.58 | 2.77 | 74.58 | 7.91 |
| p-Value | 0.00a,c | 0.03a | 0.00a,b | 0.00a,b,c | 0.00a,b,c | 0.00a,b,c | ||||||
IQR, interquartile range.
In the present study, conducted among children from different regions of Brazil, disparities between dietary patterns inside and outside school were observed. In addition, associations of these patterns with sociodemographic variables and nutritional status were also detected.
4.1Dietary patterns inside schoolThe “traditional” pattern identified inside school essentially comprised the typical foods from Brazilian cuisine, such as rice and beans, and foods rich in fiber, vitamins, and minerals, such as vegetables and cereals, in addition to the presence of foods, such as processed meat and sausages. Children with higher adherence to this pattern had a higher nutritional quality than those with lower adherence to this pattern, as they consumed less added sugar, saturated, and trans fats and had a higher intake of total dietary fiber. This pattern was associated with children from low-income families living in the Midwest region. Similar results were reported in the study by Nobre et al.3 assessing preschoolers, in which they identified a dietary pattern comprising the typical foods consumed in the Brazilian diet.
The second pattern, “dual,” was characterized by the presence of foods of low nutritional quality, with the exception of the dairy group, which are important sources of calcium, and tubers group (cassava, sweet potato, and yam) – typical foods from the Northeast of Brazil that are sources of complex carbohydrates. This pattern was associated with higher intake of added sugar and glycemic load and lower intake of saturated fat, trans fat, sodium, and total fiber intake. In addition, there was greater adherence to this pattern among low-income children from the Northeast region.
The third pattern, “snack,” was composed by easy-to-prepare or ready-to-eat foods with low nutritional quality, such as instant noodles, sandwiches, soda, pies, and candies. This pattern had greater adherence among children enrolled at private schools from the Midwest region. Adherence to this pattern was associated with higher intake of added sugar and glycemic load.
Ford, Slining, and Popkin2 assessed trends in the dietary intake among children from the United States aged between 2 and 6 years; over a twenty-year period, they identified an increase in 148kcal/day in the per capita intake of foods rich in sugars and solid fats.
However, it is noteworthy that nutrient-rich foods such as dairy, tubers, and cereals were featured only in patterns described inside school. These foods are sources of nutrients whose adequate intake can help promote bone growth and development, as well as prevent a number of non-communicable diseases, such as cardiovascular diseases and some types of cancer.9–15 It should be mentioned that the adherence to the dietary pattern composed by foods rich in fat, sodium, and added sugar was lower among children enrolled in public schools than among those enrolled in private schools. These results can be ascribed to the Brazilian National School Feeding Program (Programa Nacional de Alimentação Escolar [PNAE]), implemented in Brazil in 1955, which has as core principles the provision of healthy food and meals, respecting local eating habits in accordance with age and health status.16 This program covers all students enrolled in basic education in public schools, providing up to 70% of the recommended daily nutrient intake. The PNAE has also released a recommendation for reducing processed foods that are high in fat, sodium, and sugar in school meals of Brazilian children.
The school plays a key role in the dietary intake of children, by creating opportunities to them to expand the repertoire of foods consumed and create a reference of healthy eating, as they are exposed to a wide variety of nutrient-rich foods at school meals. Moreover, schools support the nutrition education and public policies for ensuring the quality of school meals.
4.2Dietary patterns outside schoolThe “traditional” pattern identified outside school comprised traditional foods from Brazilian culture such as rice, bean, meat, vegetables, potatoes, and it was similar to the patterns identified inside school. Similar results were also described by Matos et al.17 in a population-based study that assessed the dietary patterns of children, where a dietary pattern consisting of rice, beans, and meat in children aged 2–5 years was identified. This pattern was associated with a higher intake of saturated fat, trans fat, sodium, and total dietary fiber, as well as with a lower intake of added sugar and glycemic load. Furthermore, the “traditional” pattern was associated with children from the Southeast region.
Higher adherence to the “bread and butter” pattern was observed among children from North region. This pattern was associated with a higher intake of trans fat and glycemic load. Souza et al.,18 who evaluated the dietary patterns of children aged 1–6 years from Southern Brazil, identified a similar dietary pattern, characterized by the presence of bread, butter/margarine, rice/pastas, coffee, and sugar.
Conversely, a “snack” pattern was characterized by easy-to-prepare or ready-to-eat foods and showed greater adherence among children enrolled at private schools, from high-income families from the Midwest, Southeast, and South regions, and with overweight and obesity.
In this regard, Romani19 observed that post-modern families have a deconstruction of the classic role of the family in relation to feeding practices, and noted an increase in the consumption of easy-to-prepare foods in Italian families. Several factors may influence the increase of the consumption of these foods, including women's participation in the labor market, convenience in preparation, and availability of these products. Osman et al.20 evaluated factors influencing the consumption of easy-to-prepare foods among working women and identified that time has significant positive impact on consumption of this type of food. They also observed that factors such as health awareness, price, and family influence did not have a significant effect on consumption of easy-to-prepare foods.
Adherence to the “snack” pattern was associated with a higher intake of trans fat, which may play a role in the risk of obesity.21 Similar patterns have been described in other studies conducted in children.22–25 The positive relationship of the “snack” and similar patterns with overweight among children has been previously observed in other studies with cross-sectional25 and longitudinal24 designs. However, in the literature, there is no consensus yet on the contribution of foods consumed in the “snack” dietary pattern to the trend in overweight among children.26
Although some dietary patterns identified inside and outside schools were similar, they differ in terms of nutritional quality. It was noted that children from private schools showed greater adherence to patterns with worse nutritional quality, such as the “snack” pattern.
The present study has some limitations that must be outlined. Exploratory factor analysis is a multivariate statistical method involving decision-making by researchers at various stages of the modeling process, such as during food grouping, choosing factor rotation method, defining criteria for retention of factors, and establishing a cut-off point to factor loadings. However, aiming to ensure methodological strictness, the authors applied analytical procedures widely established in nutritional epidemiology for the study of dietary patterns. Furthermore, the cross-sectional nature does not allow for establishing causal inference. Another limitation of the study is that data collection occurred during 2007, and changes in economic, food, and health policies have taken place in recent years in Brazil. However, this study was the first multicenter study of dietary patterns inside and outside the school, showing the relevance of public policies to the nutritional quality of infant feeding. Moreover, this study is innovative with regard to the issue investigated and is relevant to public health and policymakers.
In conclusion, there are differences in the nutritional quality of dietary patterns inside and outside school. Also, heterogeneity in adherence to these patterns was observed across regions and socioeconomic classes. The present study reinforces the importance of nutrition education actions and more effective public policies for promoting healthier food choices in childhood.
5Conflicts of interestThe authors declare no conflicts of interest.
To the institutions that collaborated with the data collection and to the São Paulo Research Foundation (FAPESP) for granting a scholarship to the first author (Procedural N° 2013/06979-9).
Please cite this article as: Vieira DA, Castro MA, Fisberg M, Fisberg RM. Nutritional quality of dietary patterns of children: are there differences inside and outside school? J Pediatr (Rio J). 2017;93:47–57.


