


To evaluate the sensitivity and specificity of different cutoff points of body mass index for predicting overweight/obesity according to body fat values estimated by DEXA among Brazilian adolescents.
MethodsCross-sectional study including 229 male adolescents aged 10–15 years, in which body adiposity and anthropometric measures were assessed. Nutritional status was classified by BMI according to cutoff points described in scientific literature.
ResultsModerate agreements were observed between body fat estimated by DEXA and cutoffs proposed by Cole et al. (K=0.61), Conde and Monteiro (K=0.65), Must et al. (K=0.61) and WHO (K=0.63). The BMI in continuous form showed good agreement with the Dexa (ICC=0.72). The highest sensitivity was observed for cutoff by Conde and Monteiro (0.74 [0.62, 0.84]) and the highest specificity by Cole et al. (0.98 [0.94, 0.99]). For the areas under the ROC curve of cutoff points analyzed, significant difference comparing the cutoff points by Cole et al. and Conde and Monteiro (0.0449 [0.00294, 0.0927]) was observed.
ConclusionsThe cutoff proposed by Conde and Monteiro was more sensitive in identifying overweight and obesity when compared to the reference method, and the cutoff proposed by Cole et al. presented the highest specificity for such outcomes.
Avaliar a sensibilidade e a especificidade de diferentes pontos de corte do índice de massa corporal para o prognóstico de sobrepeso/obesidade de acordo com os valores de gordura corporal estimados por DEXA entre adolescentes brasileiros.
MétodosEstudo transversal que inclui 229 adolescentes do sexo masculino com idade entre 10-15 anos, no qual foram avaliadas a adiposidade corporal e medidas antropométricas. A situação nutricional foi classificada pelo IMC de acordo com os pontos de corte descritos na literatura científica.
ResultadosForam observadas concordâncias moderadas entre a gordura corporal estimada por DEXA e os cortes propostos por Cole et al. [K=0,61], Conde e Monteiro [K=0,65], Must et al. [K=0,61] e a OMS [K=0,63]. O IMC de forma contínua mostrou uma boa concordância com a Dexa [CCI=0,72]. A maior sensibilidade foi observada em cortes por Conde e Monteiro [0,74 (0,62, 0,84)] e a maior especificidade por Cole et al. [0,98 (0,94, 0,99)]. Nas áreas abaixo da curva de ROC de pontos de corte analisados, foi observada uma diferença significativa ao comparar os pontos de corte de Cole et al. e Conde e Monteiro [0,0449 (0,00294, 0,0927)].
ConclusõesO corte proposto por Conde e Monteiro foi mais sensível na identificação de sobrepeso e obesidade em comparação ao método de referência, e o corte proposto por Cole et al. apresentou a maior especificidade para esses resultados.
Obesity is a multifactorial disease whose increasing prevalence has been the focus of numerous investigations in both high-income1,2 and middle-income countries3 such as Brazil.4 This fact is of increasing concern due to the high incidence of this disease in the pediatric population.5
In this context, different strategies to prevent and fight childhood obesity have been outlined in order to assess nutritional status6,7 from body mass scores. Various methods, such as skinfold thickness, waist-hip ratio, waist circumference, and body mass index (BMI), can be used as nutritional status indicators.8
These anthropometric indicators have limitations in their measurements, but still show good predictive body fat values,8 and findings in literature have indicated that BMI is an appropriate tool for cardiometabolic risk screening in the pediatric population,9 although some differences point to other assessment methods as better body fat indicators.10 BMI has become a useful tool because it is considered to be low cost and easy to apply, being widely used in epidemiological studies to diagnose excess body adiposity.11
There is no consensus in literature regarding the cutoffs to stratify BMI values into underweight, overweight, and obesity in the pediatric population; different cutoff points have been developed for this purpose.12–15 This lack of consensus in cutoff points to classify the nutritional status of this population makes the comparison between studies conducted in different locations difficult, as with data from a single sample, different overweight and obesity prevalence can be found, depending on the cutoff point used.16
One of the techniques that are more precise than anthropometric measurements to estimate body fat and other body composition components is the dual energy X-ray absorptiometry (DEXA), which consists of “scanning” the body through X-rays that, after passing through the organism, are measured by an energy-discriminating detector. DEXA performs transverse analysis of the body and is a noninvasive technique considered safe that can measure three body components: fat mass, free fat mass, and bone mass.17
This study aimed to analyze the sensitivity and specificity of different BMI cutoff points for predicting overweight/obesity according to the body fat values estimated by DEXA among Brazilian male adolescents.
MethodsThis descriptive/analytical cross-sectional study was conducted in a city in the state of São Paulo. This city has 210,000 inhabitants and is located in southeastern Brazil (human development index=0.806). The sample consisted of 229 male adolescents participating in the university extension project in partnership with philanthropic institutions of that city. The following inclusion criteria were adopted: (i) informed consent form signed by parents or guardians; and (ii) age from 10 to 15 years at the assessment date. This study was approved by the Research Ethics Committee involving humans of the University responsible for this study.
Total body fat was measured by the DEXA technique using a Lunar DPX-MD device, by General Electric (General Electric Company, model Lunar DPX-MD, USA), examining the entire body, with technique applied by a single trained evaluator. Initially, after testing the scanning quality, the volunteers were positioned in supine position without the use of metal objects and shoes, and during this test, they remained still for a period of approximately 15min. Total body fat was expressed in percentages values by the GE Medical Systems Lunar software (GE Healthcare Life Sciences, Lunar®, version 4.7., USA). Overweight and obesity classification by bone densitometry followed the recommendations of Williams et al.18 (overweight/obesity ≥25% body fat).
Body weight was measured using an electronic scale Filizola® (modelo Filizola, Personal Line 200, Brazil) with precision of 0.1kg and height was estimated using wooden stadiometer fixed to the wall model Sanny (Sanny®, Profissional model, Brazil), with accuracy of 0.1cm and maximum height of 2m. These anthropometric values were used to calculate BMI by body weight in kilograms divided by the height, squared, in meters.
Nutritional status was assessed by BMI according to the following cutoffs described in literature: (i) Must et al.,14 established for the U.S. population aged from 6 to 74 years; (ii) Conde and Monteiro,15 Brazilian classification for children and adolescents aged 2–19 years; (iii) Cole et al.,12 a multicenter survey (Brazil, Great Britain, Hong Kong, Netherlands, Singapore, and the United States), established for the population aged 0–25 years; (iv) and the World Health Organization (WHO)13 for children and adolescentes aged 5–19 years.
As the sample was composed of male adolescents aged 10–15 years, the exact values of the different cutoff points were: Must et al.14 (10 years=22.60; 11 years=23.73; 12 years=24.89; 13 years=25.93; 14 years=26.93; 15 years=27.76); Conde & Monteiro15 (10 years=13.09; 11 years=13.32; 12 years=13.63; 13 years=14.02; 14 years=14.49; 15 years=15.01); Cole et al.12 (10 years=19.84; 11 years=20.55; 12 years=21.22; 13 years=21.91; 14 years=22.62; 15 years=23.29); and WHO13 (10 years=18.60; 11 years=19.30; 12 years=20.10; 13 years=20.09; 14 years=21.9; 15 years=22.80).
Sample characteristics were presented as mean and standard deviation. Spearman correction (r) was applied to assess the relationship between percentage body fat estimated by the reference method and the BMI, and the agreement of these values was verified by the Kappa test for categorical variables and intra-class coefficient correlation (ICC) for continuous variables. The comparison between the classification of overweight by DEXA and the cutoff points tested in the present study was performed using the McNemar test. The parameters of the ROC curve (sensitivity, specificity, area under the curve [AUC], negative predictive value [NPV], and positive predictive value [PPV]) were used to verify the ability of cutoff points in predicting overweight and obesity. The statistical significance adopted was equal to or less than 5% and the confidence interval was 95%. Statistical analysis was performed using the SPSS (SPSS Inc. Released 2007. SPSS for Windows, version 15.0, USA) and MedCalc (MedCalc®, version 11.1, Belgium).
ResultsThe sample consisted of 229 male adolescents aged 10–15 years. The mean characteristics of the sample were as follows: age, 12.31(±1.78) years; weight, 47.52 (±13.77) kg; height, 155.18 (±13.41) cm; and BMI, 19.41 (±13.66) kg/m2.
Seventy young subjects (n=30.5%) were classified as having excess body fat by DEXA. The prevalence of overweight when analyzing the various cutoff points used in this study was shown in Fig. 1. No significant differences were observed between the overweight classification by DEXA compared to the cutoff points proposed by Conde and Monteiro15 and by the WHO.13 Significant differences were observed using the cutoff points by Cole et al.12 and by Must et al.14
 and body mass index (BMI) cutoff points.")
When the relationship between body fat values identified by the reference method adopted in this study and BMI, good correlation was observed between these methods (r=0.78). The agreement of measurements performed by the different cutoff points was determined by the Kappa test, and the following values were observed: K=0.61 for Cole et al.12; K=0.65 for Conde and Monteiro15; K=0.61 for Must et al.14; and K=0.63 for WHO.13 When considering the agreement between continuous variables, fat percentage by DEXA and BMI, good agreement was observed (ICC=0.72).
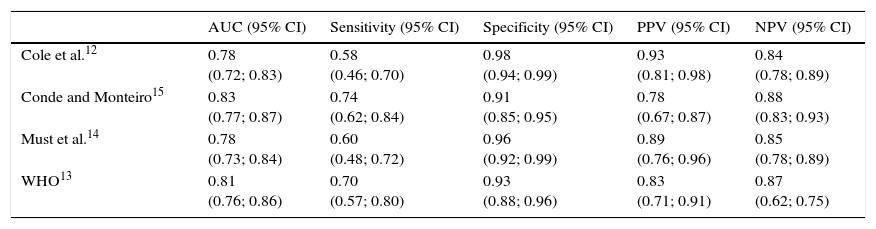
Table 1 shows information on the area under the curve, sensitivity, specificity, PPV, and NPV. The highest sensitivity among the proposed criteria was verified for the cutoff of Conde and Monteiro15 and the highest specificity for the cutoff of Cole et al.,12 as well as the highest PPV. The highest NPV was observed for the cutoff of Conde and Monteiro.15
Diagnostic properties of different cutoff points of body mass index to identify overweight according to body fat values estimated by dual energy X-ray absorptiometry (DEXA).
| AUC (95% CI) | Sensitivity (95% CI) | Specificity (95% CI) | PPV (95% CI) | NPV (95% CI) | |
|---|---|---|---|---|---|
| Cole et al.12 | 0.78 (0.72; 0.83) | 0.58 (0.46; 0.70) | 0.98 (0.94; 0.99) | 0.93 (0.81; 0.98) | 0.84 (0.78; 0.89) |
| Conde and Monteiro15 | 0.83 (0.77; 0.87) | 0.74 (0.62; 0.84) | 0.91 (0.85; 0.95) | 0.78 (0.67; 0.87) | 0.88 (0.83; 0.93) |
| Must et al.14 | 0.78 (0.73; 0.84) | 0.60 (0.48; 0.72) | 0.96 (0.92; 0.99) | 0.89 (0.76; 0.96) | 0.85 (0.78; 0.89) |
| WHO13 | 0.81 (0.76; 0.86) | 0.70 (0.57; 0.80) | 0.93 (0.88; 0.96) | 0.83 (0.71; 0.91) | 0.87 (0.62; 0.75) |
AUC, area under the curve; 95% CI, 95% confidence interval; PPV, positive predictive value; NPV, negative predictive value; WHO, World Health Organization.
The ability of BMI has also been analyzed in this study (as a continuous variable) predicting overweight estimated by DEXA. High values of AUC, sensitivity, and specificity were observed, as shown in Fig. 2.
 curve for body mass index (BMI) ability to predict overweight estimated by dual energy X-ray absorptiometry (DEXA).")
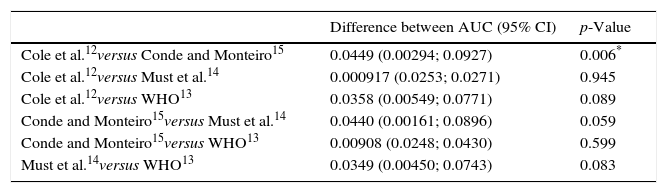
Table 2 shows the comparisons between different areas under the ROC curves and their respective confidence intervals of different cutoff points analyzed in this study. Statistically significant differences were observed when the cutoff points of Cole et al.12 and Conde and Monteiro15 were compared.
Comparison between ROC curves of different cutoff points.
| Difference between AUC (95% CI) | p-Value | |
|---|---|---|
| Cole et al.12versus Conde and Monteiro15 | 0.0449 (0.00294; 0.0927) | 0.006* |
| Cole et al.12versus Must et al.14 | 0.000917 (0.0253; 0.0271) | 0.945 |
| Cole et al.12versus WHO13 | 0.0358 (0.00549; 0.0771) | 0.089 |
| Conde and Monteiro15versus Must et al.14 | 0.0440 (0.00161; 0.0896) | 0.059 |
| Conde and Monteiro15versus WHO13 | 0.00908 (0.0248; 0.0430) | 0.599 |
| Must et al.14versus WHO13 | 0.0349 (0.00450; 0.0743) | 0.083 |
ROC, receiver operating characteristic, AUC, area under the curve; WHO, World Health Organization.
The present findings indicate that the cutoff established by Conde and Monteiro15 showed higher AUC and sensitivity, which helps identifying more efficiently the presence of overweight and obesity among children and adolescents. Conversely, Cole et al.12 showed higher specificity when compared to the other outcomes.
In this study, the results showed that the cutoff points proposed by Conde and Monteiro15 are more suitable, as they provide higher AUC, NPV, and a prognosis of greater sensitivity to excess adiposity in the assessed population. These results have already been disclosed in the literature.19 This result probably occurred due to the fact that these cutoff points proposed by Conde and Monteiro15 have only been applied to Brazilian adolescents when compared to international standards,12–14 as the cutoff points used for the assessment of excess body weight built with features of other nations in the prevalence of overweight is greater, and may underestimate or be less sensitive when applied to populations in which the prevalence of overweight is lower.20
The overweight indicators assessed by DEXA showed positive correlation with the cutoff points analyzed. Other studies also found similar positive correlations,21,22 which suggests that all these indexes are able to identify the nutritional status of children and adolescents. Moreover, with regard to the values proposed by Must et al.14 and by Cole et al.,12 it was observed that such multicenter surveys were conducted in countries where the prevalence of overweight/obesity is high,23 which may explain the lower sensitivity levels and the tendency of such indexes to underestimate overweight and obesity in the Brazilian population.
The cutoff point proposed by the WHO13 shows large amplitude when compared with the other references, which may have provided lower sensitivity to the prognosis of overweight and obesity. Similar findings were reported by Veiga et al.24 However, when the ROC curves of cutoff points were observed, it was observed that those by Conde and Monteiro15 showed more sensitive critical values in the identification of excess body fat compared to those by Cole et al.12 This occurred because the model was built based on data obtained from young Brazilians a few years ago, when obesity rates were not similar to the worrisome current reality.25 Another factor is that the values recommended for each age group by Conde and Monteiro15 were lower than the other cutoff points analyzed in this study.
Although the sensitivity and specificity results were significant, when analyzing the misclassification of cutoff points compared with DEXA, statistically significant differences were observed in the cutoff points by Cole et al.12 and by Must et al.,14 may note that there may be erroneous ratings on the body fat index in certain populations, so the cutoff points established by Conde and Monteiro15 and WHO,13 are less likely to body fat misclassification. Moreover Neovius et al.26 examined the misclassification of some cutoffs in Swedish adolescents and found a better system of excess fat classification through the cutoff points of Cole et al.12 and WHO.13 The difference between the findings may be related the characteristics analyzed population.
To use the different types of cutoff points, healthcare professionals should be aware of the strengths and limitations of each cutoff point. For example, among those analyzed in the present study, that by Conde and Monteiro15 was more sensitive, but also has the greatest chance of detecting false positives, i.e., to classify as overweight individuals who are not. Unlike more specific cutoff points, those by Cole et al.,12 by Must et al.,14 and by the WHO13 may classify some adolescents who are overweight as normal weight.
Furthermore, a limitation to be considered is that these different cutoff points should be tested against a number of cardiovascular risk factors in adolescents such as hypertension, diabetes, cholesterol, and triglycerides to assess their efficiency in detecting cardiovascular risks.
As Neouvis et al.,26 the present study also tested the accuracy, sensitivity and specificity of BMI on a continuous basis in predicting overweight observable good AUC (Fig. 2). These results show that the higher the BMI, the greater are the chances of the subject presenting a high fat percentage based on BMI analysis versus body fat obtained by DEXA. Thus, the use of BMI by healthcare professionals should be encouraged, as it correlates well with body fat. Moreover, BMI is a simple and inexpensive technique.
The following limitations of this study should be highlighted: (i) the cross-sectional design, which did not allow for the establishment of a causal relationship between outcomes; (ii) the sample, which consisted of male volunteers only; (iii) the use of DEXA as reference method, as previous results have shown that this technique tends to overestimate the percentage of body fat in individuals with high body fat levels and to underestimate it in those with low fat levels27; thus, for adolescents with extreme BMI values, DEXA results may not be as accurate. Nonetheless, this technique is more accurate than anthropometric measurements to estimate body fat. Further studies should be carried out using more accurate methods to estimate body fat and to verify the possible relationship between cutoff points.
A practical application for obesity screening in the young population could be the use of different cutoff points simultaneously; for example, in the case of this study, the most sensitive and specific, because if an adolescent is classified as overweight by two cutoff points, he/she should be closely monitored. From these assessments, health promotion could be better prepared in the school environment. Referral of young overweight subjects assessed at different cutoff points to a Basic Healthcare Unit could be carried out with the purpose of performing routine tests to prevent cardiovascular problems typically associated with overweight.
Thus, it can be concluded that the cutoff points proposed by Conde and Monteiro15 was more sensitive in identifying overweight and obesity when compared to the reference method, and the cutoff points by Cole et al.12 showed higher specificity for such outcomes.
Conflicts of interestThe authors declare no conflicts of interest.
Please cite this article as: Anzolin CC, Silva DA, Zanuto EF, Cayres SU, Codogno JS, Costa Junior P, et al. Accuracy of different cutoff points of body mass index to identify overweight according to body fat values estimated by DEXA. J Pediatr (Rio J). 2017;93:58–63.


