
To evaluate the nutritional status of children with persistent cholestasis and to compare the anthropometric indices between children with and without liver cirrhosis and children with and without jaundice.
MethodsChildren with persistent cholestasis, i.e. increased direct bilirrubin or changes in the canalicular enzyme gamma-glutamyl transferase (GGT), were included. The anthropometric measures were weight (W), height or length (H), arm circumference (AC), triceps skinfold thickness (TST), arm muscle circumference (AMC), and body mass index (BMI).
ResultsNinety-one children with cholestasis, with current median age of 12 months, were evaluated. W/age (A) and H/A indices below −2 Z-scores were observed in 33% and 30.8% of patients, respectively. Concerning the W/H index and BMI, only 12% and 16% of patients, respectively, were below −2 Z-scores. Regarding AC, 43.8% of 89 evaluated patients had some depletion. Observing the TST, 64% of patients had depletion, and 71.1% of the 45 evaluated patients had some degree of depletion regarding the ACM index.
ConclusionEvaluation using weight in patients with chronic liver diseases may overestimate the nutritional status due to visceromegaly, subclinical edema, or ascites. Indices that correlate weight and height, such as W/H and BMI, may also not show depletion because of the chronic condition in which there are depletion of both weight and height. TST, AC, and ACM are parameters that better estimate nutritional status and should be part of the management of patients with liver diseases and cholestasis.
Avaliar a situação nutricional de crianças com colestase persistente e comparar os índices antropométricos entre crianças com e sem cirrose hepática e crianças com e sem icterícia.
MétodosForam incluídas crianças com colestase persistente, ou seja, aumento da bilirrubina direta ou alterações na enzima canalicular, gamaglutamiltransferase (GGT). As medidas antropométricas foram peso (P), estatura ou altura (A), circunferência do braço (CB), espessura da prega cutânea do tríceps (TST), circunferência muscular do braço (CMB) e índice de massa corporal (IMC).
ResultadosForam avaliadas noventa e uma crianças com colestase, com idade média de 12 meses. 33% e 30,8% dos pacientes apresentaram índices P/I e A/I com escore Z abaixo de -2, respectivamente. Com relação ao índice P/A e IMC, somente 12% e 16% dos pacientes, respectivamente, apresentaram escore Z abaixo de -2. Com relação à CB, 43,8% de 89 pacientes avaliados apresentaram alguma depleção. Observando a TST, 64% dos pacientes apresentaram depleção, e 71,1% dos 45 pacientes avaliados apresentaram algum grau de depleção com relação ao índice de CMB.
ConclusãoA avaliação do peso em pacientes com doenças hepáticas crônicas poderá superestimar a situação nutricional devido a visceromegalia, edema subclínico ou ascite. Os índices que correlacionam peso e altura, como P/A e IMC, também podem não mostrar depleção devido à doença crônica em que há depleção tanto do peso quanto da altura. A TST, BC e CMB são parâmetros que estimam melhor a situação nutricional e devem fazer parte do manejo de pacientes com doenças hepáticas e colestase.
Cholestasis is a common manifestation of liver disease in children, which occurs in approximately 65% of these patients. It is the impairment of bile flow due to biliary tract obstruction or impairment of bile acid uptake, conjugation, or excretion.1,2 Cholestasis impairs the nutritional status of these children.3 Malnutrition leads to increased morbidity and mortality in patients with chronic liver disease. Barches et al.4 reported that malnutrition in the pre-transplant period is associated with longer hospital stay and spending. Besides, Moukarzel et al.5 showed a narrow correlation between nutritional status and outcomes of liver transplant in children. In that study, children with Z-score below −2 standard deviations had a higher incidence of infection in the post-transplant period, more surgical complications, and higher mortality.
Approximately 60% of children with chronic liver disease are under the expected weight and height for their age.6,7 An appropriate nutritional support could prevent the fast progression of the underlying disease, with improvement of the immune function.6,8,9 Nutritional evaluation of these children is essential, but the weight can be overestimated in cases of visceromegaly, ascites, and peripheral edema; therefore, when considered separately, this evaluation is not a good parameter to identify malnutrition. The most sensitive measures to determine the nutritional status in chronic liver disease are arm circumference (AC) and triceps skinfold (TST).10 A meticulous physical exam, several physical anthropometric measures, and individualized complementary tests are indispensable. Because malnutrition is a consequence of chronic cholestasis, knowledge on the impact of this condition in committed children may help in recommending early nutritional intervention.
This study aimed to evaluate the nutritional status of children diagnosed with cholestasis followed at the Pediatric Hepatology Unit of this institution and to correlate the food intake with nutritional status. In addition, anthropometric indices were compared between patients with and without liver cirrhosis and children with and without jaundice.
Patients and methodsThis case series study was carried out at the Pediatric Hepatology Unit of the Hospital das Clínicas, Universidade Federal de Minas Gerais (UFMG), Brazil, from January of 2009 to December of 2013. Children with clinical and/or laboratory persistent cholestasis were included. Persistent cholestasis was defined as increased direct bilirubin (direct bilirubin of more than 20% of the total bilirubin or more than 2mg/dL, when the levels are higher than 5mg/dL; or direct bilirubin greater than 1mg/dL when total bilirubin is less than 5mg/dL) or the raise of the canalicular enzyme, gamma-glutamyl transferase (GGT), above the reference value for age.11 All patients underwent liver biopsy, which was indicated on the patient initial evaluation for differential diagnosis of cholestasis and/or during the course of the disease for monitoring histopathological findings.
The study was approved by the Ethics Committee of the institution (protocol number ETIC 310/08).
Anthropometric measures collected were weight (W), length or height (H), arm circumference (AC), triceps skinfold thickness (TST), arm muscle circumference (AMC), and body mass index (BMI). The analyzed variables were: gender, age in months at the time of clinical evaluation, classification as having cirrhosis or not (based on histopathology), classification of cirrhosis by the Child–Pugh criteria, laboratory tests (albumin and bilirubin), and the caloric intake through the 72-h food record. Clinical and laboratory data were obtained at the same time of nutritional evaluation, i.e., in a single moment. Food intake was recorded for 72h after nutritional evaluation.
Children younger than 2 years and weighing up to 16kg were measured in horizontal anthropometer (Pediatric Anthropometric Ruler; NutriVida®, São Paulo, Brazil) and weighed, without clothes or diaper, on an electronic, digital, and calibrated scale (Digital Infant Scale; Welmy®, São Paulo, Brazil). The vertical stadiometer (Vertical stadiometer; Physical Nutrivida®, São Paulo, Brazil) and an electronic, digital, and calibrated platform (Digital Scale; Balmak®, São Paulo, Brazil) were used to measure children older than 2 years. Patients were evaluated barefoot and, usually, only with underwear. The equipment was checked before use. These measures were classified through the 2008 SISVAN (Food and Nutrition Surveillance Systems)12 protocol per life phase, adapted from the World Health Organization (WHO)13; the cutoff points used had the WHO charts as reference and were calculated by the WHO Anthro, version 3.2.2.14
An inelastic tape was used to measure the AC, and a plicometer was used for the measurement of TST. These parameters were calculated and classified based on WHO standards according to age and height.15 The measures were performed on the right side of the child. Patients younger than 2 years were evaluated in standing position, on the lap of the mother or guardian. AC was measured at midway between the acromion and the inferior border of the olecranon. TST was measured at the same position of AC, i.e., the posterior face of the arm. The measurement was carried out following longitudinal axis of the limb. Three measures were performed at the same position, with a difference of three seconds between each other, and the mean of the values was calculated to avoid possible errors, as recommended by the literature.12
Patients were classified based on WHO Anthro14 calculation by using the following values: severe depletion (less than 70%), moderate depletion (between 70% and 80%), mild depletion (between 80% and 90%), eutrophy (between 90% and 110%), overweight (between 110% and 120%), and obesity (more than 120%). The formulas for these calculations were: adequacy of AC (%)=[obtained AC (cm)/AC50 percentile]×100; adequacy of TST (%)=[obtained TST (cm)/TST 50 percentile]×100; and AMC (cm)=AC (cm)−3.14×TST (cm).
AMC values, according to gender and age, were compared with reference values of the National Health and Nutrition Examination Survey (NHANES), expressed in percentile tables by Frisancho, starting from 1 year of age.16 Patients younger than 1 year were excluded from this analysis due to the lack of reference values for this age group.
After clinical evaluation, the caregiver of the child reported all food ingested by the child for three consecutive days. The number of days, time, kind, and amount of food ingested by the child were informed. For children who were exclusively breast-fed, the mother took note of breast-feeding time to estimate, according to age and suckling time, the volume of milk ingested by the infant.
The calculation of calorie-protein intake was carried out by the software DietPro version 4.0 (Agromídia Softwares®, Minas Gerais, Brazil),17 as well as the Food Composition Table18 and the home measures table,19 including the macronutrients carbohydrates, proteins, and lipids. Then, the daily recommendations of calories were calculated according to age by the FAO/WHO/UN 1985 report, based on calories requirement for total energy consumption plus growth of breast-fed children.20
Data were analyzed by the software Epi Info version 6.04 (Centers for Disease Control and Prevention, Atlanta, USA). Continuous variables with non-Gaussian distribution were shown as medians and interquartile range (IQ 25th–75th) and compared with the nonparametric Kruskal–Wallis test. The distribution of dichotomous variables was compared by the chi-squared test, with Yates correction, or two-tailed Fisher's exact test, if necessary. The probability was considered significant when p<0.05.
ResultsNinety-one children with initial diagnosis of cholestasis were evaluated. The median age was 12 months, and 52.7% were male. The etiologies of cholestasis were: biliary atresia in 31 patients (34.1%), idiopathic neonatal hepatitis in 25 (27.5%), multifactorial cholestasis in eight (8.8%), Alagille syndrome in eight (8.8%), deficiency of alpha-1-antitrypsin in six (6.6%), hypoplasia of bile ducts in four (4.4%), and other diagnoses in six patients (6.6%). Twenty-five patients (27.5%) showed cirrhosis on the histopathological exam (18 with biliary atresia and seven with idiopathic neonatal hepatitis); 11 patients were classified as Child–Pugh class A (44%), 12 as class B (48%), and two as class C (8%). Seventy patients (76.9%) had jaundice with abnormally high levels of bilirubin, GGT, and aminotransferase, while 21 children (23.1%) had normal levels of bilirubin, without jaundice, but with increased levels of GGT.
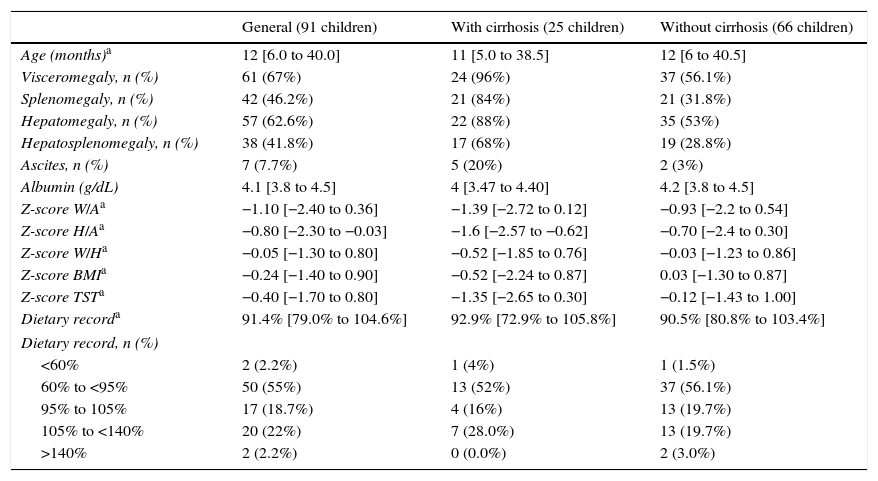
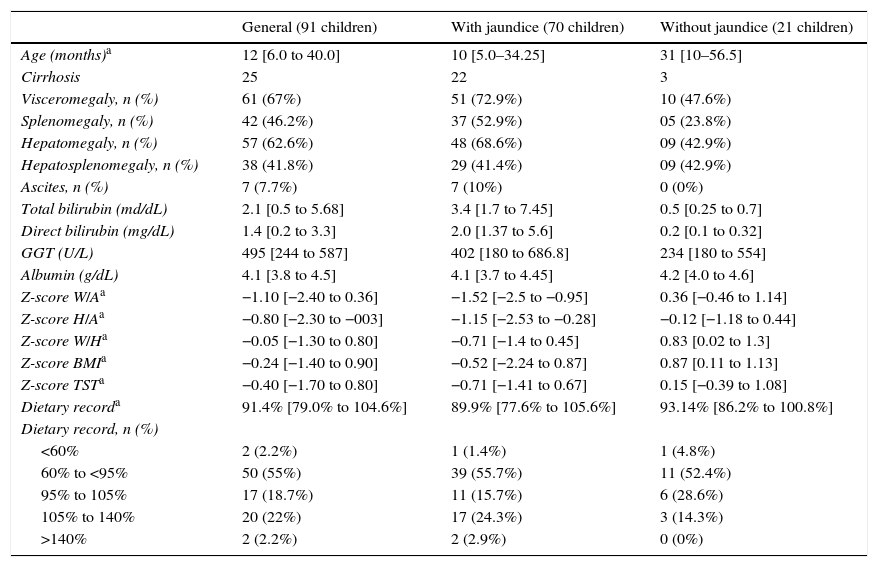
Clinical, laboratory, nutritional, and anthropometric data of the patients are shown in Tables 1 and 2. The following indexes were calculated: weight/age (W/A); height/age index (H/A); weight/height (W/H); body mass index (BMI). For some data, marked with an asterisk, median and interquartile range (IQ 25th–75th) were used. Dietary intake was calculated using the formula (dietary intake record/recommended for age)×100.
Clinical, laboratory, nutritional, and anthropometric data of children diagnosed as neonatal cholestasis in general and divided according to the presence of cirrhosis.
| General (91 children) | With cirrhosis (25 children) | Without cirrhosis (66 children) | |
|---|---|---|---|
| Age (months)a | 12 [6.0 to 40.0] | 11 [5.0 to 38.5] | 12 [6 to 40.5] |
| Visceromegaly, n (%) | 61 (67%) | 24 (96%) | 37 (56.1%) |
| Splenomegaly, n (%) | 42 (46.2%) | 21 (84%) | 21 (31.8%) |
| Hepatomegaly, n (%) | 57 (62.6%) | 22 (88%) | 35 (53%) |
| Hepatosplenomegaly, n (%) | 38 (41.8%) | 17 (68%) | 19 (28.8%) |
| Ascites, n (%) | 7 (7.7%) | 5 (20%) | 2 (3%) |
| Albumin (g/dL) | 4.1 [3.8 to 4.5] | 4 [3.47 to 4.40] | 4.2 [3.8 to 4.5] |
| Z-score W/Aa | −1.10 [−2.40 to 0.36] | −1.39 [−2.72 to 0.12] | −0.93 [−2.2 to 0.54] |
| Z-score H/Aa | −0.80 [−2.30 to −0.03] | −1.6 [−2.57 to −0.62] | −0.70 [−2.4 to 0.30] |
| Z-score W/Ha | −0.05 [−1.30 to 0.80] | −0.52 [−1.85 to 0.76] | −0.03 [−1.23 to 0.86] |
| Z-score BMIa | −0.24 [−1.40 to 0.90] | −0.52 [−2.24 to 0.87] | 0.03 [−1.30 to 0.87] |
| Z-score TSTa | −0.40 [−1.70 to 0.80] | −1.35 [−2.65 to 0.30] | −0.12 [−1.43 to 1.00] |
| Dietary recorda | 91.4% [79.0% to 104.6%] | 92.9% [72.9% to 105.8%] | 90.5% [80.8% to 103.4%] |
| Dietary record, n (%) | |||
| <60% | 2 (2.2%) | 1 (4%) | 1 (1.5%) |
| 60% to <95% | 50 (55%) | 13 (52%) | 37 (56.1%) |
| 95% to 105% | 17 (18.7%) | 4 (16%) | 13 (19.7%) |
| 105% to <140% | 20 (22%) | 7 (28.0%) | 13 (19.7%) |
| >140% | 2 (2.2%) | 0 (0.0%) | 2 (3.0%) |
W/A, weight/age index; H/A, height/age index; W/H, weight/height index; BMI, body mass index; TST, triceps skinfold thickness.
Clinical, laboratory, nutritional, and anthropometric data of children diagnosed as neonatal cholestasis in general and divided according to the presence of jaundice.
| General (91 children) | With jaundice (70 children) | Without jaundice (21 children) | |
|---|---|---|---|
| Age (months)a | 12 [6.0 to 40.0] | 10 [5.0–34.25] | 31 [10–56.5] |
| Cirrhosis | 25 | 22 | 3 |
| Visceromegaly, n (%) | 61 (67%) | 51 (72.9%) | 10 (47.6%) |
| Splenomegaly, n (%) | 42 (46.2%) | 37 (52.9%) | 05 (23.8%) |
| Hepatomegaly, n (%) | 57 (62.6%) | 48 (68.6%) | 09 (42.9%) |
| Hepatosplenomegaly, n (%) | 38 (41.8%) | 29 (41.4%) | 09 (42.9%) |
| Ascites, n (%) | 7 (7.7%) | 7 (10%) | 0 (0%) |
| Total bilirubin (md/dL) | 2.1 [0.5 to 5.68] | 3.4 [1.7 to 7.45] | 0.5 [0.25 to 0.7] |
| Direct bilirubin (mg/dL) | 1.4 [0.2 to 3.3] | 2.0 [1.37 to 5.6] | 0.2 [0.1 to 0.32] |
| GGT (U/L) | 495 [244 to 587] | 402 [180 to 686.8] | 234 [180 to 554] |
| Albumin (g/dL) | 4.1 [3.8 to 4.5] | 4.1 [3.7 to 4.45] | 4.2 [4.0 to 4.6] |
| Z-score W/Aa | −1.10 [−2.40 to 0.36] | −1.52 [−2.5 to −0.95] | 0.36 [−0.46 to 1.14] |
| Z-score H/Aa | −0.80 [−2.30 to −003] | −1.15 [−2.53 to −0.28] | −0.12 [−1.18 to 0.44] |
| Z-score W/Ha | −0.05 [−1.30 to 0.80] | −0.71 [−1.4 to 0.45] | 0.83 [0.02 to 1.3] |
| Z-score BMIa | −0.24 [−1.40 to 0.90] | −0.52 [−2.24 to 0.87] | 0.87 [0.11 to 1.13] |
| Z-score TSTa | −0.40 [−1.70 to 0.80] | −0.71 [−1.41 to 0.67] | 0.15 [−0.39 to 1.08] |
| Dietary recorda | 91.4% [79.0% to 104.6%] | 89.9% [77.6% to 105.6%] | 93.14% [86.2% to 100.8%] |
| Dietary record, n (%) | |||
| <60% | 2 (2.2%) | 1 (1.4%) | 1 (4.8%) |
| 60% to <95% | 50 (55%) | 39 (55.7%) | 11 (52.4%) |
| 95% to 105% | 17 (18.7%) | 11 (15.7%) | 6 (28.6%) |
| 105% to 140% | 20 (22%) | 17 (24.3%) | 3 (14.3%) |
| >140% | 2 (2.2%) | 2 (2.9%) | 0 (0%) |
W/A, weight/age index; H/A, height/age index; W/H, weight/height index; BMI, body mass index; TST, triceps skinfold thickness.
Regarding nutritional intake, 57.2% of the 91 patients were below 95% of the recommended calories, with no statistically significant difference between those with and without cirrhosis (p=0.32) and between children with and without jaundice (p=0.80). When comparing patients with ingestion below 95% of the recommended with patients with nutritional depletion, no statistically significant differences were observed on AC (p=0.14), TST (p=0.09), and AMC (p=0.09).
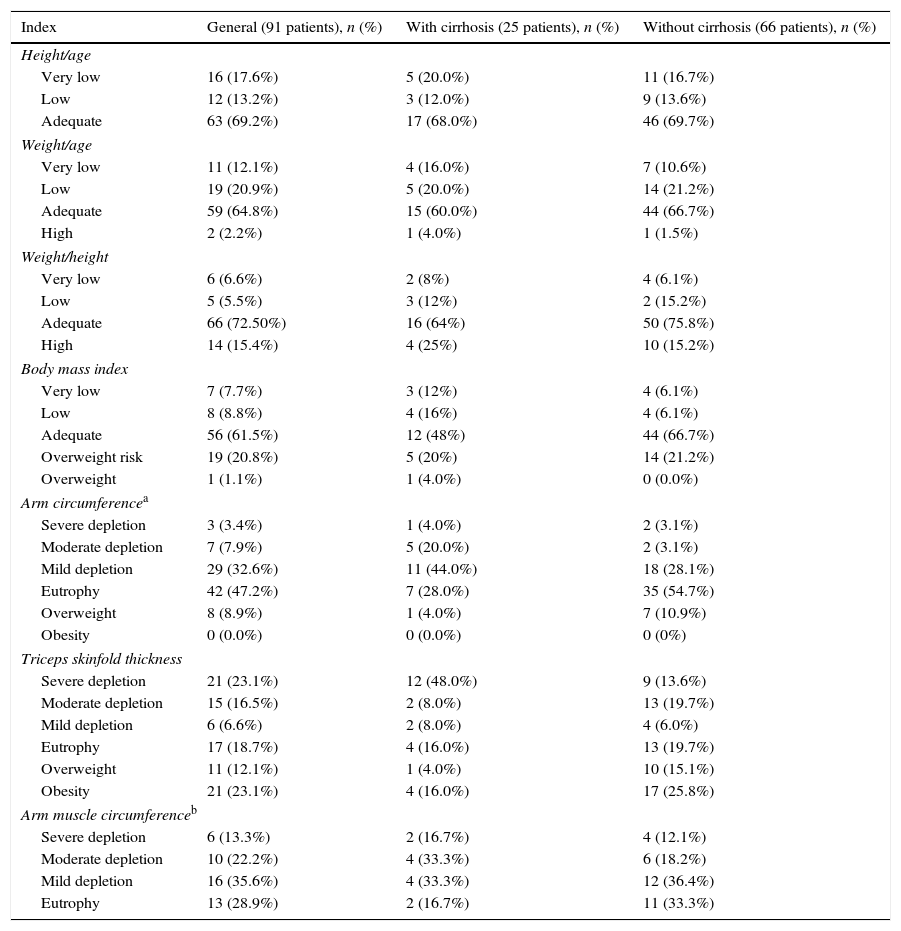
Table 3 presents the nutritional classification based on anthropometric indices in the entire group and in patients stratified according to the presence of cirrhosis. There was no statistically significant difference between patients with and without cirrhosis for the W/A (p=0.48), H/A (p=0.92), W/H (p=0.28), and BMI (p=0.07) indices, as well as for TST and AMC (p=0.07 for TST; and 83.3% vs. 66.7%, p=0.24 for AMC). Regarding AC, there was a statistically significant difference between patients with and without cirrhosis (p=0.006).
Nutritional classification based on anthropometric indices in the whole group patients and stratified according to the presence of cirrhosis.
| Index | General (91 patients), n (%) | With cirrhosis (25 patients), n (%) | Without cirrhosis (66 patients), n (%) |
|---|---|---|---|
| Height/age | |||
| Very low | 16 (17.6%) | 5 (20.0%) | 11 (16.7%) |
| Low | 12 (13.2%) | 3 (12.0%) | 9 (13.6%) |
| Adequate | 63 (69.2%) | 17 (68.0%) | 46 (69.7%) |
| Weight/age | |||
| Very low | 11 (12.1%) | 4 (16.0%) | 7 (10.6%) |
| Low | 19 (20.9%) | 5 (20.0%) | 14 (21.2%) |
| Adequate | 59 (64.8%) | 15 (60.0%) | 44 (66.7%) |
| High | 2 (2.2%) | 1 (4.0%) | 1 (1.5%) |
| Weight/height | |||
| Very low | 6 (6.6%) | 2 (8%) | 4 (6.1%) |
| Low | 5 (5.5%) | 3 (12%) | 2 (15.2%) |
| Adequate | 66 (72.50%) | 16 (64%) | 50 (75.8%) |
| High | 14 (15.4%) | 4 (25%) | 10 (15.2%) |
| Body mass index | |||
| Very low | 7 (7.7%) | 3 (12%) | 4 (6.1%) |
| Low | 8 (8.8%) | 4 (16%) | 4 (6.1%) |
| Adequate | 56 (61.5%) | 12 (48%) | 44 (66.7%) |
| Overweight risk | 19 (20.8%) | 5 (20%) | 14 (21.2%) |
| Overweight | 1 (1.1%) | 1 (4.0%) | 0 (0.0%) |
| Arm circumferencea | |||
| Severe depletion | 3 (3.4%) | 1 (4.0%) | 2 (3.1%) |
| Moderate depletion | 7 (7.9%) | 5 (20.0%) | 2 (3.1%) |
| Mild depletion | 29 (32.6%) | 11 (44.0%) | 18 (28.1%) |
| Eutrophy | 42 (47.2%) | 7 (28.0%) | 35 (54.7%) |
| Overweight | 8 (8.9%) | 1 (4.0%) | 7 (10.9%) |
| Obesity | 0 (0.0%) | 0 (0.0%) | 0 (0%) |
| Triceps skinfold thickness | |||
| Severe depletion | 21 (23.1%) | 12 (48.0%) | 9 (13.6%) |
| Moderate depletion | 15 (16.5%) | 2 (8.0%) | 13 (19.7%) |
| Mild depletion | 6 (6.6%) | 2 (8.0%) | 4 (6.0%) |
| Eutrophy | 17 (18.7%) | 4 (16.0%) | 13 (19.7%) |
| Overweight | 11 (12.1%) | 1 (4.0%) | 10 (15.1%) |
| Obesity | 21 (23.1%) | 4 (16.0%) | 17 (25.8%) |
| Arm muscle circumferenceb | |||
| Severe depletion | 6 (13.3%) | 2 (16.7%) | 4 (12.1%) |
| Moderate depletion | 10 (22.2%) | 4 (33.3%) | 6 (18.2%) |
| Mild depletion | 16 (35.6%) | 4 (33.3%) | 12 (36.4%) |
| Eutrophy | 13 (28.9%) | 2 (16.7%) | 11 (33.3%) |
Note: For evaluation of height/age index, Z-score was categorized as very low (Z-score<−3); low (Z-score≥−3 and <−2); adequate (Z-score≥−2). For the weight/age index, as very low (Z-score<−3); low (Z-score≥−3 and <−2); adequate (Z-score≥−2 and ≤+2); high (Z-score>+2). For weight/height, as very low (Z-score<−3); low (Z-score≥−3 and <−2); adequate (Z-score≥−2 and ≤+1); high (Z-score>+1). For body mass index, Z-score was categorized as very low (Z-score<−3); low (Z-score≥−3 and <−2); adequate (Z-score≥−2 and ≤+1); overweight risk (>Z-score +1 and ≤Z-score +2) and (Z-score>+2 and <+3). For arm circumference, triceps skinfold thickness, and arm muscle circumference, the used classification was severe depletion: <70% of expected; moderate depletion: ≥70% and <80% of expected; mild depletion: ≥80% and <90% of expected; eutrophy: ≥90% and ≤110% of expected; overweight: >110% and ≤120% of expected; and obesity: >120% of expected.
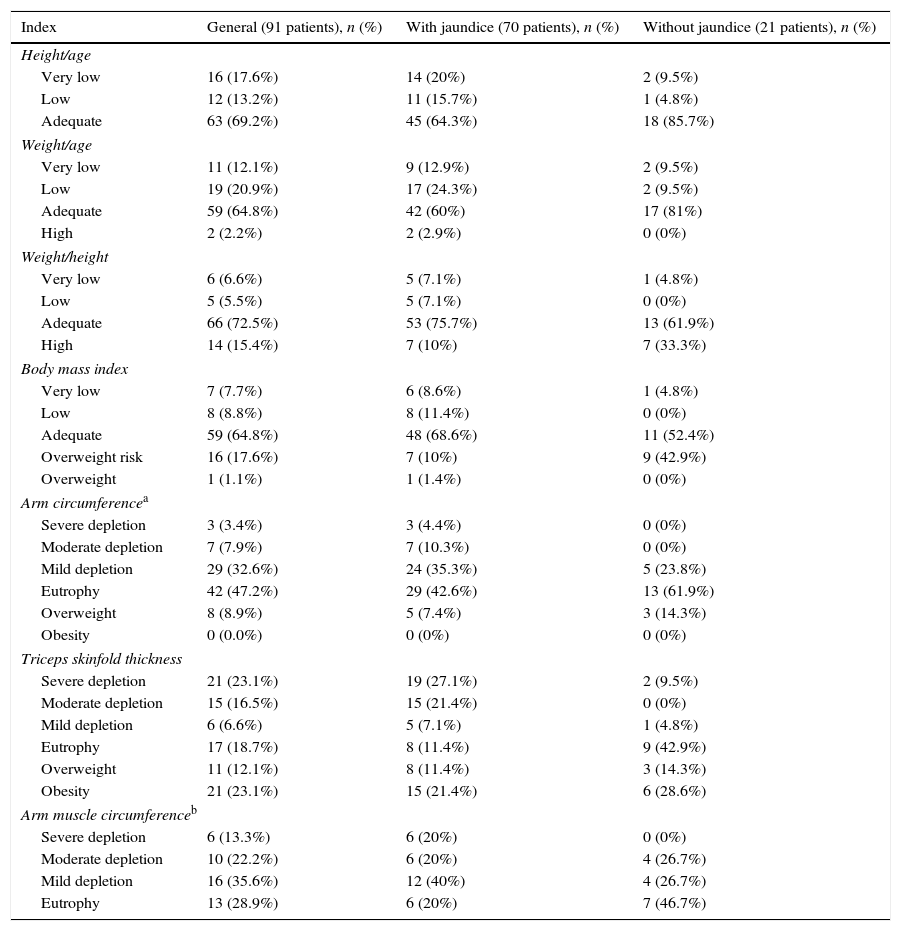
Table 4 shows the nutritional classification based on anthropometric indices in the entire group and in patients stratified according to the presence of jaundice. No differences were observed in the comparison between the data of children with and without jaundice for W/A (p=0.18), H/A (p=0.92), W/H (p=0.45), BMI (p=0.07), and AMC (p=0.08). Regarding the presence of any degree of depletion in AC and TST, patients with jaundice had significantly higher frequency of depletion in both parameters than those without jaundice (p=0.045 and p=0.001, respectively). When comparing patients with nutritional depletion by TST with those with low weight for height or age, a statistically significant difference was observed for both parameters (p=0.000).
Nutritional classification based on anthropometric indices in the whole group patients and stratified according to the presence of jaundice.
| Index | General (91 patients), n (%) | With jaundice (70 patients), n (%) | Without jaundice (21 patients), n (%) |
|---|---|---|---|
| Height/age | |||
| Very low | 16 (17.6%) | 14 (20%) | 2 (9.5%) |
| Low | 12 (13.2%) | 11 (15.7%) | 1 (4.8%) |
| Adequate | 63 (69.2%) | 45 (64.3%) | 18 (85.7%) |
| Weight/age | |||
| Very low | 11 (12.1%) | 9 (12.9%) | 2 (9.5%) |
| Low | 19 (20.9%) | 17 (24.3%) | 2 (9.5%) |
| Adequate | 59 (64.8%) | 42 (60%) | 17 (81%) |
| High | 2 (2.2%) | 2 (2.9%) | 0 (0%) |
| Weight/height | |||
| Very low | 6 (6.6%) | 5 (7.1%) | 1 (4.8%) |
| Low | 5 (5.5%) | 5 (7.1%) | 0 (0%) |
| Adequate | 66 (72.5%) | 53 (75.7%) | 13 (61.9%) |
| High | 14 (15.4%) | 7 (10%) | 7 (33.3%) |
| Body mass index | |||
| Very low | 7 (7.7%) | 6 (8.6%) | 1 (4.8%) |
| Low | 8 (8.8%) | 8 (11.4%) | 0 (0%) |
| Adequate | 59 (64.8%) | 48 (68.6%) | 11 (52.4%) |
| Overweight risk | 16 (17.6%) | 7 (10%) | 9 (42.9%) |
| Overweight | 1 (1.1%) | 1 (1.4%) | 0 (0%) |
| Arm circumferencea | |||
| Severe depletion | 3 (3.4%) | 3 (4.4%) | 0 (0%) |
| Moderate depletion | 7 (7.9%) | 7 (10.3%) | 0 (0%) |
| Mild depletion | 29 (32.6%) | 24 (35.3%) | 5 (23.8%) |
| Eutrophy | 42 (47.2%) | 29 (42.6%) | 13 (61.9%) |
| Overweight | 8 (8.9%) | 5 (7.4%) | 3 (14.3%) |
| Obesity | 0 (0.0%) | 0 (0%) | 0 (0%) |
| Triceps skinfold thickness | |||
| Severe depletion | 21 (23.1%) | 19 (27.1%) | 2 (9.5%) |
| Moderate depletion | 15 (16.5%) | 15 (21.4%) | 0 (0%) |
| Mild depletion | 6 (6.6%) | 5 (7.1%) | 1 (4.8%) |
| Eutrophy | 17 (18.7%) | 8 (11.4%) | 9 (42.9%) |
| Overweight | 11 (12.1%) | 8 (11.4%) | 3 (14.3%) |
| Obesity | 21 (23.1%) | 15 (21.4%) | 6 (28.6%) |
| Arm muscle circumferenceb | |||
| Severe depletion | 6 (13.3%) | 6 (20%) | 0 (0%) |
| Moderate depletion | 10 (22.2%) | 6 (20%) | 4 (26.7%) |
| Mild depletion | 16 (35.6%) | 12 (40%) | 4 (26.7%) |
| Eutrophy | 13 (28.9%) | 6 (20%) | 7 (46.7%) |
Note: For evaluation of height/age index, Z-score was categorized as very low (Z-score<−3); low (Z-score ≥−3 and <−2); adequate (Z-score≥−2). For weight/age index, as very low (Z-score<−3); low (Z-score ≥−3 and <−2); adequate (Z-score ≥−2 and ≤+2); high (Z-score>+2). For weight/height, as very low (Z-score<−3); low (Z-score ≥−3 and <−2); adequate (Z-score ≥−2 and ≤+1); high (Z-score >+1). For body mass index, Z-score was categorized as very low (Z-score<−3); low (Z-score ≥−3 and <−2); adequate (Z-score ≥−2 and ≤+1); overweight risk (>Z-score +1 and ≤Z-score +2) and (Z-score >+2 and <+3). For arm circumference, triceps skinfold thickness and arm muscle circumference, the used classification was severe depletion: <70% of expected; moderate depletion: ≥70% and <80% of expected; mild depletion: ≥80% and <90% of expected; eutrophy: ≥90% and ≤110% of expected; overweight: >110% and ≤120% of expected; and obesity: >120% of expected.
Regarding the evaluation of AC, 39 (43.8%) of 89 patients had some degree of depletion. Conversely, only 11 (12.3%) of 89 patients had low W/H (p=0.001) and only 28 (31.5%) had low W/A (p=0.000).
Similarly, when assessing AMC, 32 (71.1%) of 45 patients had some degree of depletion, while only two (4.4%) had low W/H (p=0.000) and only seven (15.6%) of 45 patients had low W/A (p=0.000).
DiscussionNutritional evaluation of these children is essential, but it has several challenges. The presence of visceromegaly, ascites, and peripheral edema can limit the use of weight, the most common index for nutritional evaluation. Therefore, a meticulous physical exam, several anthropometric measures, and individualized complementary tests are indispensible for a reliable nutritional evaluation of these patients. TST and AC measures are more reliable, as these parameters do not consider the weight and could be extremely important in clinical practice, allowing for an early diagnosis of nutritional deficits. The estimate of fat deposits through TST and of protein content by AMC and AC are complementary data that allow for an accurate nutritional evaluation of these patients.3,21,22
In the present study, one-third of patients showed W/A and H/A indices under −2 Z-scores. Considering the W/H index, only 12.1% of patients had Z-score lower than −2; in relation to the BMI, the percentage was 16.5%. This demonstrates that W/H should always be used in combination with H/A, since the proportional deficits in weight and height are not identified by this first method. It also shows that BMI is not a good measure of body composition in this population.
Similarly, in another Brazilian study with 22 children and adolescents with cholestasis, 23.8% and 33.3% of patients were malnourished according to W/A and H/A criteria, respectively, and none of them was under −2 Z-scores in relation to W/H index.23
Nutritional inadequacy was higher when AC, TST, and AMC indices were used. Regarding AC, 43.9% of patients had some degree of depletion; TST, 46.2%; and AMC, 71.1%. Although the W/A and H/A indices revealed that almost one-third of patients had nutritional depletion, AC, TST, and AMC indicated a higher frequency of malnutrition.
AMC probably showed a greater proportion of patients with inadequate nutritional when compared with AC and TST, due to the age of the evaluated patients in this study. AMC had only been reported in patients older than 1 year, i.e., with a longer time of evolution of cholestatic disease.
Schneider et al.24 reported in their study on children with cirrhosis that the index that best reflected the nutritional risk was TST, confirming that it can measure the body fat mass, showing the length and severity of malnutrition. Therefore, this measure is very important in the nutritional evaluation of these patients. Sokol et al.25 emphasized the importance of TST and AC measures as more accurate methods to evaluate fat deposits and protein content in patients with chronic liver disease.
Regarding W/H and BMI, an important flaw occurs, which can be explained at least in part by the chronic pattern of nutritional impairment observed in these patients when both weight and height are involved. This reinforces that the use of conventional anthropometric indices, such as W/A, H/A, W/H, and BMI, may overestimate the nutritional status of patients with cholestasis, even when edema and ascites are not evident. In addition, visceromegaly contributes to weight increase of these patients, which compromises the use of indices that include weight.2
The inadequacy of these indices can also be noticed when comparing patients with and without jaundice, and with and without liver cirrhosis. No statistical differences were detected between these subgroups for W/A, H/A, W/H or BMI. On the other hand, the evaluation of AC showed statistically significant difference between patients with and without cirrhosis and between children with and without jaundice.
The evaluation of TST and AMC has not shown statistical difference between patients with and without cirrhosis. This can be explained by the fact that the patient assessment has been performed in a single moment. Summing up, in the majority of cases, malnutrition was only detected when the evaluation was not restricted to weight and height measures.
The frequency of nutritional depletion based on AC and TST evaluation was similar, indicating similar depletion of fat and lean mass. This finding differed from the results reported by Cardoso et al.,21 who observed higher initial loss of fat. This difference can be attributed to patients’ age, since in the study of Cardoso et al.21 patients were younger with mean age of nine months. AMC seemed to overestimate malnutrition, since 71.1% of patients had some degree of depletion, with 83.3% among patients with cirrhosis and 66.7% among the group without cirrhosis. The AMC evaluation performed only in patients older than one year of age can explain these results.
Regarding dietary intake, 57.2% of 91 patients ingested lower than 95% of diet recommendations, without significant differences between patients with and without cirrhosis (p=0.32) and between children with and without jaundice (p=0.80); this finding could be related to the fact that nutritional evaluation was done in a single moment. When comparing the patients with low intake of calories to those with some degree of nutritional depletion identified through the AC, TST, or AMC, there was no statistical difference. These methods proved to be similar and important in the nutritional assessment of patients with chronic cholestatic liver disease. Accordingly, Cardoso et al.21 showed even higher indices of inadequate diet (90%) when food intake was evaluated qualitatively and quantitatively. This is even more worrying, since caloric intake should be optimized to up 140% of the expected. Considering this recommendation, only 2.2% of patients had appropriate caloric intake. After this evaluation, the families were orientated regarding food intake and dietetic needs, but the results of the interventions have not been studied yet.
The authors are aware of the limitations of the present study. The most important of them is that nutritional assessment was performed in a single moment, which makes comparisons between patients with or without cirrhosis and with or without jaundice difficult, since the patients were at different stages in the disease course. Another limitation was related to the dietary record, because, even if data collection is strict, this record can always be faulty, since it depends on patient's memory and cooperation. In addition, an important issue is that the nutritional assessment was performed by the same dietitian; ideally, it would be performed by two dietitians with a subsequent comparison of the results. Nevertheless, the authors believe these limitations do not decrease the importance of the present findings.
In conclusion, the use of weight for nutritional evaluation may underestimate the detection of malnutrition in patients with chronic liver diseases due to visceromegaly, subclinical edema, and/or ascites.21 The anthropometric indices that consider weight and height, such as W/H and BMI, may also not reveal the real degree of depletion attributable to chronic clinical condition of these patients, in which both weight and height are impaired. TST and AC measures appear to be more accurate parameters for nutritional evaluation of patients with liver diseases and cholestasis.
Conflicts of interestThe authors declare no conflicts of interest.
This study was partially supported by the National Council of Scientific and Technological Development (CNPq, Brazil), Foundation of Support to Research of the State of Minas Gerais (FAPEMIG, Brazil) and by the Grant INCT-MM (from National Institute of Science and Technology of Molecular Medicine, FAPEMIG/CBB-APQ-00075-09 and CNPq/573646/2008-2).
Please cite this article as: Silva FV, Ferri PM, Queiroz TC, Barbosa PS, Oliveira MC, Pereira LJ, et al. Nutritional evaluation of children with chronic cholestatic disease. J Pediatr (Rio J). 2016;92:197–205.


