
To examine the associations between food insecurity (IA) and social support in families of children with sickle-cell disease (DF).
MethodsThis cross-sectional study in families of 190 children from five to nine years old in follow-up at a hematology referral hospital in Rio de Janeiro State. IA was measured using the Brazilian food insecurity scale and social support was measured using the Brazilian version of the MOS social support survey instrument. The relation between IA and social support was analyzed by way of a multinomial logistic model.
ResultsThere was IA in 62.2% of the families, in moderate and severe form in, respectively, 11.1% and 7.9% of cases. In families of children with DF, levels of mild and severe food insecurity (IALe and IAGr) were found to relate inversely to levels of social support in the following dimensions: informational support (IALe OR=0.98; 95% CI 0.96–0.99 and IAGr OR=0.95; 95% CI 0.92–0.98); social interaction (IALe OR=0.98; 95% CI 0.96–0.99 and IAGr OR=0.96; 95% CI 0.93–0.99) and tangible social support (IALe OR=0.97; 95% CI 0.96–0.99 and IAGr OR=0.97; 95% CI 0.94–0.99).
ConclusionConsidering the positive effects of social support on IA, public policies should be encouraged to assure food and nutritional security and social assistance for care for people with DF. Also, social support groups for people with DF should be strengthened.
Avaliar as associações entre insegurança alimentar (IA) e apoio social em famílias de crianças com doença falciforme (DF).
MétodosEstudo transversal feito com as famílias de 190 crianças, com idades de cinco a nove anos, atendidas em um hospital de referência em hematologia no Estado do Rio de Janeiro. A IA foi medida com a escala brasileira de insegurança alimentar, e o apoio social foi medido com a versão brasileira do instrumento de pesquisa de apoio social MOS. A relação entre IA e o apoio social foi analisada por meio de um modelo logístico multinomial.
ResultadosHavia IA em 62,2% das famílias, nas formas moderada e grave em 11,1% e 7,9% dos casos, respectivamente. Em famílias de crianças com DF, os níveis de insegurança alimentar leve e grave (IAL e IAG) apresentaram relação inversa com os níveis de apoio social nas seguintes dimensões: apoio informativo (IAL OR = 0,98; IC 95%: 0,96-0,99 e IAG OR = 0,95; IC 95%: 0,92-0,98); interação social (IAL OR = 0,98; IC 95%: 0,96-0,99 e IAG OR = 0,96; IC 95%: 0,93-0,99) e material (apoio social tangível) (IAL OR = 0,97; IC 95%: 0,96-0,99 e IAG OR = 0,97; 95% CI 0,94-0,99).
ConclusãoConsiderando os efeitos positivos do apoio social na IA, as políticas públicas devem ser encorajadas a garantir segurança alimentar e nutricional e assistência social para o atendimento de pessoas com DF. Além disso, os grupos de apoio social para pessoas com DF devem ser fortalecidos.
Sickle-cell disease (SCD), a group of hematological diseases characterized by the presence of hemoglobin S (HbS), is highly prevalent and a recognized public health problem worldwide and in Brazil.1 Brazil's national neonatal screening program estimates that 3500 babies are born with SCD each year. Anyone can be born with the disease, which is hereditary, providing their parents have the HbS gene.2 However, SCD is still acknowledged to be a racial/ethnic disease, primarily affecting individuals of black and mixed-race ethnicity.3,4
In Brazil, differences are observed in the results for certain birth, mortality, and morbidity indicators when stratified by ethnicity.5 Individuals of black and mixed-race ethnicity generally presents worse results for these indicators, including higher prevalence of FI, when compared with households whose residents’ race is white.6,7
Prevalences of FI have been steadily decreasing in Brazilian households, from 34.9% in 2004 to 30.2% in 20096 and then 22.6% in 2013.7 Despite that decline, FI is still alarming, given that it is a violation of human rights that can have direct and indirect effects on people's health.
People with chronic illness in situations of greater social vulnerability and FI may have a worsening of living conditions, aggravating their health.8 Therefore, it is important to study of FI in a group of people with high biological, clinical, and social vulnerability, such as in SCD.
Studies9–11 have found an inverse relation between FI and social support, indicating that the latter can lessen the situation of food insecurity, because it influences resource availability (for example, food donations or barter, or even someone to do the cooking) or yields the beneficial effects of feeling cared for, loved, and having people to turn to.11 Nonetheless, Davis et al.12 highlight the mixed effects between FI and social support; qualitative studies of these phenomena can provide a stronger understanding of how specific strategies and context factors determine how social support is used and what effects it produces on food security.
Social support can be described as a buffer (on a buffer-effect model), moderating the impact of stressful situations, or as a main effect, on a model in which social networks are considered to foster positive experiences, stability, positive affect, and self-esteem, with the potential to help avert adverse situations.13 Lastly, it can also be described in terms of how interpersonal relations associate with the emotional, instrumental/tangible, informational, affectionate, and positive social interaction dimensions of social support.14
Based on the hypotheses that families of children with SCD belong to groups more prone to experiencing situations of FI and that social support has some effect on that relationship, this study proposed to examine the association between FI and social support for children with SCD in follow-up at a hematology referral hospital.
MethodsStudy design and participantsThis cross-sectional study examined a sample of children aged 5–9 years with SCD registered in a hematology referral hospital, residents in the metropolitan area of Rio de Janeiro.
The sample was calculated considering: (a) the population of children with SCD aged 5–9 years, 11 months and 29 days registered in hospital; (b) 50% estimated prevalence of FI, since the estimates of food insecurity in this group are unknown, and (c) 95% confidence level. Sample size was calculated at 202 children. This sample was selected randomly from the listing of 427 children provided by the hospital, without replacement; all the children had the same likelihood of being selected.
The 190 interviews were conducted, achieving 94% coverage. Data were collected between June 2015 and April 2016. Structured interviews of parents and guardians were conducted by applying a standard questionnaire eliciting information on FI, social support, and SCD-related variables, as well as socio-demographic data, in addition to other questions.
MeasuresFood insecurityFI was measured on the Brazilian food insecurity scale (Escala Brasileira de Insegurança Alimentar [EBIA]), which consists of a questionnaire of 14 yes–no type questions put directly to a family member, with a view to ascertaining FI in the household over the prior 90 days. The scale has a severity gradient reflecting the number of affirmative responses. Households were classified as: food security – no affirmative responses; mild food insecurity (MiFI) – one to five affirmative responses; moderate food insecurity (MoFI) – six to nine affirmative responses; and severe food insecurity (SeFI) – 10–14 affirmative responses.15
Social supportInterviewees’ perceptions of the social support available to them were measured on the Brazilian version of the MOS (Medical Outcomes Study) Social Support Scale. This instrument comprises 19 questions grouped into five dimensions: affectionate (three questions), emotional (four questions), informational (four questions), positive social interaction (four questions), and tangible (four questions). In each of the dimensions, the scores of the items were added; the total score was divided by the maximum possible score for the dimension and multiplied by 100. Total support was obtained by adding together all the scale items and dividing by 95, the maximum possible social support score.16
CovariablesThe SCD-related covariables were the severity of SCD in the children, whether others members of the family had the disease (yes or no) and, if yes, whether they lived with the child (yes or no). The criteria used to classify severity of SCD were the occurrence of “sickle cell disease-related complications” such as cerebrovascular accident, recurrent vaso-occlusive crises in the prior year, acute chest syndrome, three hospital admissions in the prior year and, among boys, frequent priapism (involuntary penile erection). From this set of criteria, SCD was classified as mild or severe.17
The covariables relating to the parent or guardian interviewed were: (i) years of schooling (continuous); (ii) self-declared ethnicity, classified into three categories (1 – white, Asian, and Native Brazilian; 2 – mixed-race; and 3 – black); (iii) information about the head of the family, defined as the person paying most toward household expenses, number of heads of household (one resident or two or more residents), sex (male and female), age (numerical variable), and occupational status (working or not working).
The household-related variables were: (iv) household density (continuous); (v) number of residents under 18 years in the household (continuous); (vi) ownership of domicile (owned or not-owned by a resident), (vii) number of government social benefits (none, one, or more than one), (viii) per capita household income (continuous – obtained by dividing the sum of all incomes by the number of persons in the household).
Data analysisSimple analyses were performed to describe the means (SD) and frequencies for the categorical variables. A multinomial logistic model was used to estimate the association between FI and social support, and was adjusted for possible confounders. The association was tested for the three levels of FI (mild, moderate, and severe), and food security was used as reference category. Social support was analyzed by dimensions and by total support score.
Of the covariables used in this study, only those that were associated with FI after analysis of the crude odds ratios were included in the multiple models. All statistically significant variables were included simultaneously in the adjusted models.
Three models were used in the data analysis: the first estimated associations between FI and each support dimension, adjusted for selected covariables (Model 1). The second model estimated the association between FI and the set of all the support dimensions (Model 2) and, lastly, the third model proposed (Model 3) estimated the association between FI and total support, also adjusted for the covariables.
The study was approved by the Hemorio research ethics committee (No. 366/14). The data were analyzed using R Studio version 3.13 (RStudio: Integrated Development for R. RStudio, Inc., MA, USA).
ResultsMost of the interviews were of one of the child's parents (90.2%; mothers=79.5%) and, in 96.5% of cases, the child lived with the interviewee. The children were predominantly male (54.2%) and mean age was 7.9 years (SD=1.46).
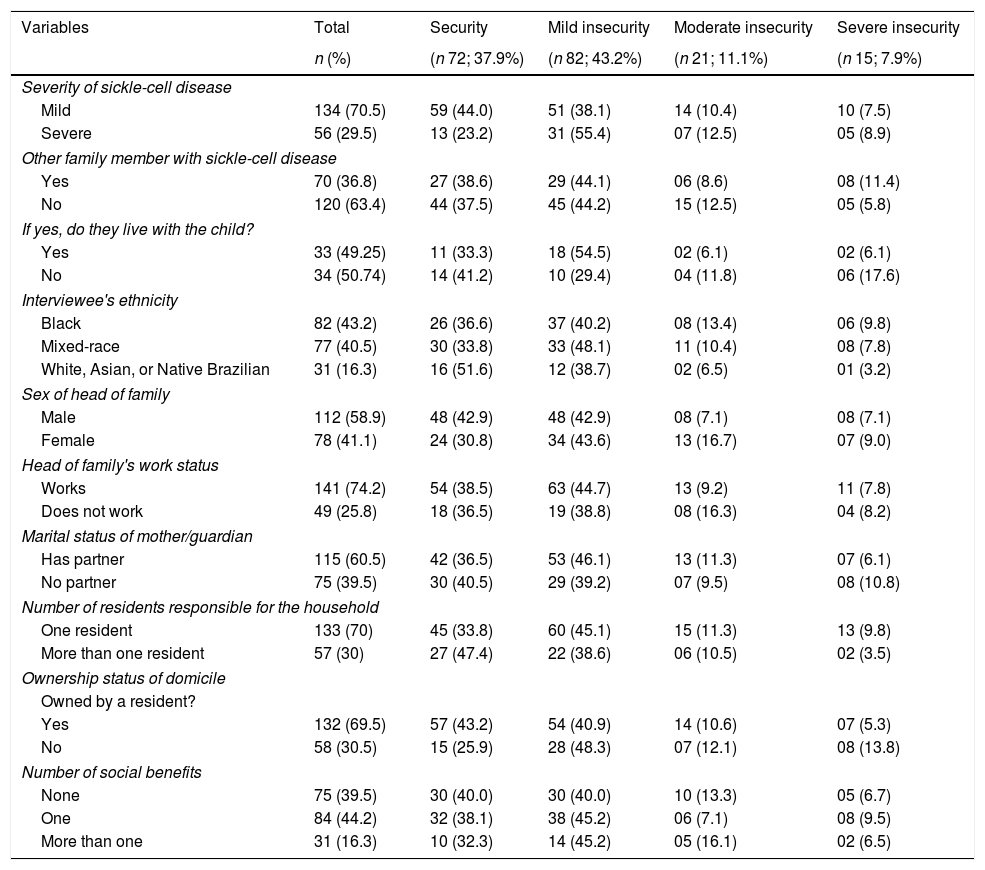
There was FI in 62.2% of the families, in moderate and severe form in, respectively, 11.1% and 7.9% of cases (Table 1). As regards the SCD-related variables, the disease was observed to be mild in 70.5% of the children and 36.8% of the families had other members with SCD.
Prevalence of food insecurity in families of children with sickle-cell disease in follow-up at a state referral center, Rio de Janeiro, Brazil, 2016.
| Variables | Total | Security | Mild insecurity | Moderate insecurity | Severe insecurity |
|---|---|---|---|---|---|
| n (%) | (n 72; 37.9%) | (n 82; 43.2%) | (n 21; 11.1%) | (n 15; 7.9%) | |
| Severity of sickle-cell disease | |||||
| Mild | 134 (70.5) | 59 (44.0) | 51 (38.1) | 14 (10.4) | 10 (7.5) |
| Severe | 56 (29.5) | 13 (23.2) | 31 (55.4) | 07 (12.5) | 05 (8.9) |
| Other family member with sickle-cell disease | |||||
| Yes | 70 (36.8) | 27 (38.6) | 29 (44.1) | 06 (8.6) | 08 (11.4) |
| No | 120 (63.4) | 44 (37.5) | 45 (44.2) | 15 (12.5) | 05 (5.8) |
| If yes, do they live with the child? | |||||
| Yes | 33 (49.25) | 11 (33.3) | 18 (54.5) | 02 (6.1) | 02 (6.1) |
| No | 34 (50.74) | 14 (41.2) | 10 (29.4) | 04 (11.8) | 06 (17.6) |
| Interviewee's ethnicity | |||||
| Black | 82 (43.2) | 26 (36.6) | 37 (40.2) | 08 (13.4) | 06 (9.8) |
| Mixed-race | 77 (40.5) | 30 (33.8) | 33 (48.1) | 11 (10.4) | 08 (7.8) |
| White, Asian, or Native Brazilian | 31 (16.3) | 16 (51.6) | 12 (38.7) | 02 (6.5) | 01 (3.2) |
| Sex of head of family | |||||
| Male | 112 (58.9) | 48 (42.9) | 48 (42.9) | 08 (7.1) | 08 (7.1) |
| Female | 78 (41.1) | 24 (30.8) | 34 (43.6) | 13 (16.7) | 07 (9.0) |
| Head of family's work status | |||||
| Works | 141 (74.2) | 54 (38.5) | 63 (44.7) | 13 (9.2) | 11 (7.8) |
| Does not work | 49 (25.8) | 18 (36.5) | 19 (38.8) | 08 (16.3) | 04 (8.2) |
| Marital status of mother/guardian | |||||
| Has partner | 115 (60.5) | 42 (36.5) | 53 (46.1) | 13 (11.3) | 07 (6.1) |
| No partner | 75 (39.5) | 30 (40.5) | 29 (39.2) | 07 (9.5) | 08 (10.8) |
| Number of residents responsible for the household | |||||
| One resident | 133 (70) | 45 (33.8) | 60 (45.1) | 15 (11.3) | 13 (9.8) |
| More than one resident | 57 (30) | 27 (47.4) | 22 (38.6) | 06 (10.5) | 02 (3.5) |
| Ownership status of domicile | |||||
| Owned by a resident? | |||||
| Yes | 132 (69.5) | 57 (43.2) | 54 (40.9) | 14 (10.6) | 07 (5.3) |
| No | 58 (30.5) | 15 (25.9) | 28 (48.3) | 07 (12.1) | 08 (13.8) |
| Number of social benefits | |||||
| None | 75 (39.5) | 30 (40.0) | 30 (40.0) | 10 (13.3) | 05 (6.7) |
| One | 84 (44.2) | 32 (38.1) | 38 (45.2) | 06 (7.1) | 08 (9.5) |
| More than one | 31 (16.3) | 10 (32.3) | 14 (45.2) | 05 (16.1) | 02 (6.5) |
The children's parents or guardians self-declared themselves black or mixed-race in 43.2% and 40.5% of cases, respectively. In 70% of the families, most of the expenses were paid by only one resident and, in 74.2%, the head of family was employed. Government social benefits were reported being received in 60.5% of the interviews.
FI reached prevalences in excess of 60% in households whose head of family was a woman, in those where the interviewee's color/race was black or mixed-race, in those where expenses were paid by only one person, where the residence was not owned and in those where the children presented with severe sickle-cell disease.
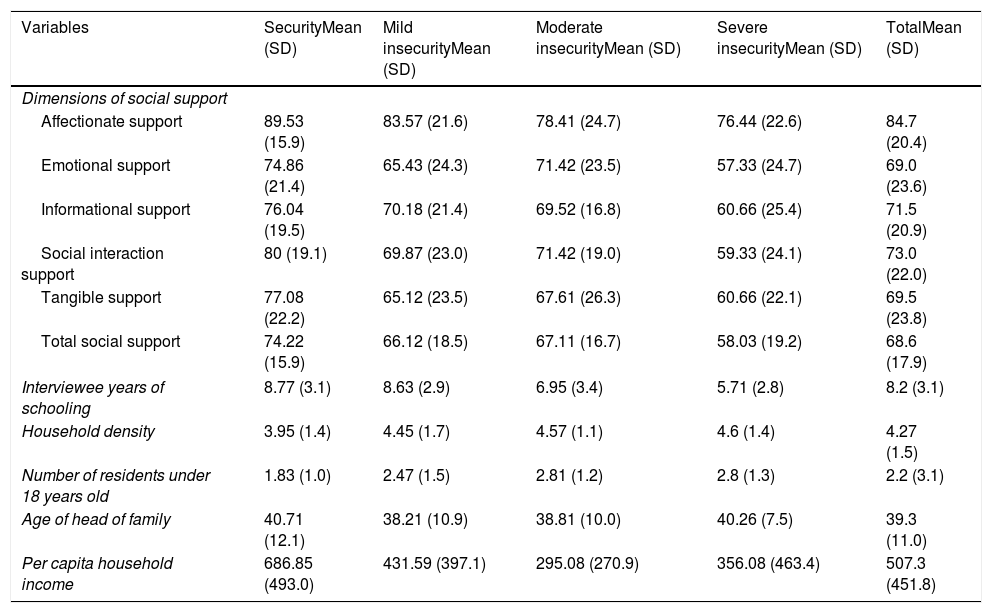
Interviewees perceived social support in 68.68% of cases (SD=17.99) and, by dimensions, the highest mean – 84.70% (SD=20.43) – was returned by affectionate support and the lowest – 69.05% (SD=23.69) – by emotional support (Table 2). Interviewee's mean years of schooling was 8.28 (SD=3.18) and per capita household income in the month prior to the interview was R$ 507.30 (SD=R$ 451.83). Mean values of social support, years of schooling and per capita household income were lower at the most severe levels of FI. Meanwhile, the largest numbers of persons per household and of children under 18 years old returned the severest levels of FI.
Mean and standard deviation of the support dimensions and socio-demographic variables, by level of food insecurity in families of children with sickle-cell disease in follow-up at a referral center in Rio de Janeiro State, Brazil, 2016.
| Variables | SecurityMean (SD) | Mild insecurityMean (SD) | Moderate insecurityMean (SD) | Severe insecurityMean (SD) | TotalMean (SD) |
|---|---|---|---|---|---|
| Dimensions of social support | |||||
| Affectionate support | 89.53 (15.9) | 83.57 (21.6) | 78.41 (24.7) | 76.44 (22.6) | 84.7 (20.4) |
| Emotional support | 74.86 (21.4) | 65.43 (24.3) | 71.42 (23.5) | 57.33 (24.7) | 69.0 (23.6) |
| Informational support | 76.04 (19.5) | 70.18 (21.4) | 69.52 (16.8) | 60.66 (25.4) | 71.5 (20.9) |
| Social interaction support | 80 (19.1) | 69.87 (23.0) | 71.42 (19.0) | 59.33 (24.1) | 73.0 (22.0) |
| Tangible support | 77.08 (22.2) | 65.12 (23.5) | 67.61 (26.3) | 60.66 (22.1) | 69.5 (23.8) |
| Total social support | 74.22 (15.9) | 66.12 (18.5) | 67.11 (16.7) | 58.03 (19.2) | 68.6 (17.9) |
| Interviewee years of schooling | 8.77 (3.1) | 8.63 (2.9) | 6.95 (3.4) | 5.71 (2.8) | 8.2 (3.1) |
| Household density | 3.95 (1.4) | 4.45 (1.7) | 4.57 (1.1) | 4.6 (1.4) | 4.27 (1.5) |
| Number of residents under 18 years old | 1.83 (1.0) | 2.47 (1.5) | 2.81 (1.2) | 2.8 (1.3) | 2.2 (3.1) |
| Age of head of family | 40.71 (12.1) | 38.21 (10.9) | 38.81 (10.0) | 40.26 (7.5) | 39.3 (11.0) |
| Per capita household income | 686.85 (493.0) | 431.59 (397.1) | 295.08 (270.9) | 356.08 (463.4) | 507.3 (451.8) |
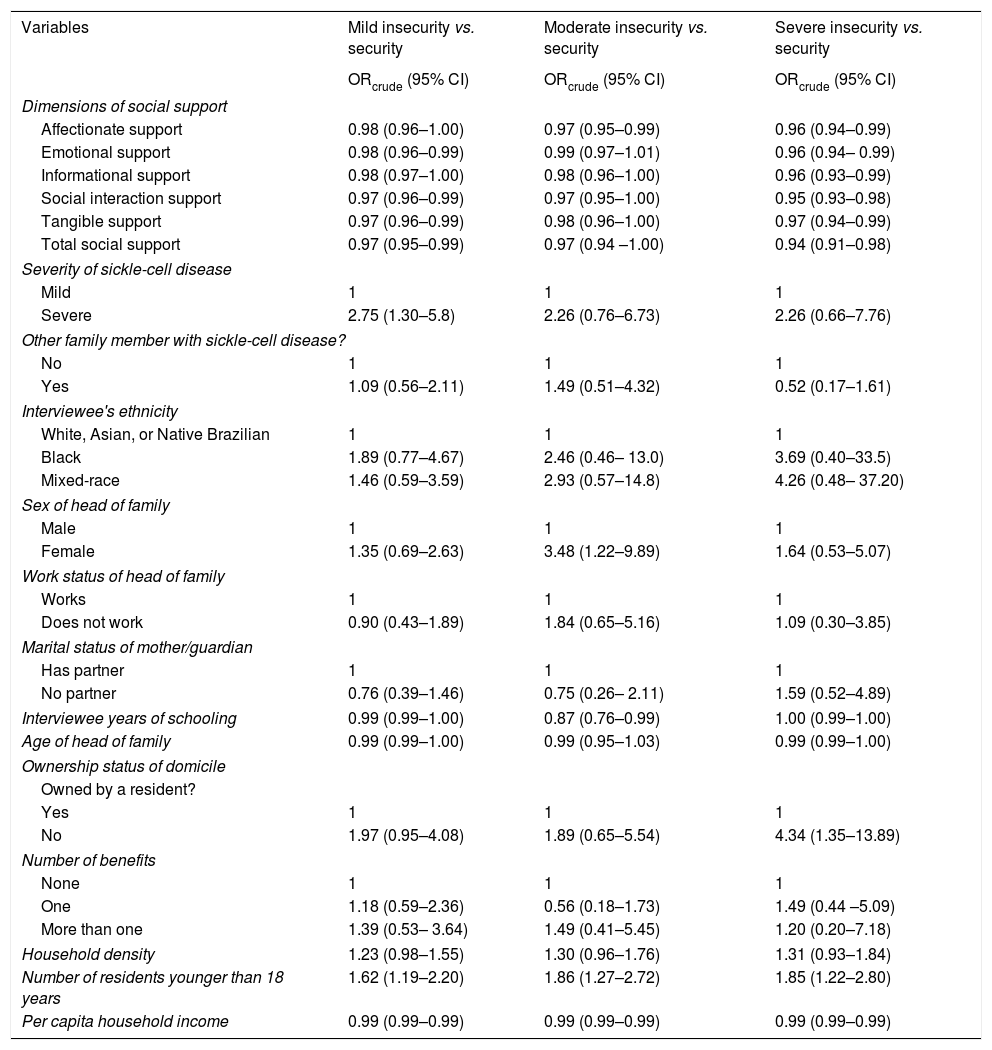
The covariables directly associated with FI were found to be: sex of head of family, ownership status of domicile, presence of residents under 18 years of age and severity of SCD. However, inverse relationships were found for head of household's years of schooling and per capita household income (Table 3).
Crude odds ratios for food insecurity in families of children with sickle-cell disease in follow-up at a referral center in Rio de Janeiro State, Brazil, 2016.
| Variables | Mild insecurity vs. security | Moderate insecurity vs. security | Severe insecurity vs. security |
|---|---|---|---|
| ORcrude (95% CI) | ORcrude (95% CI) | ORcrude (95% CI) | |
| Dimensions of social support | |||
| Affectionate support | 0.98 (0.96–1.00) | 0.97 (0.95–0.99) | 0.96 (0.94–0.99) |
| Emotional support | 0.98 (0.96–0.99) | 0.99 (0.97–1.01) | 0.96 (0.94– 0.99) |
| Informational support | 0.98 (0.97–1.00) | 0.98 (0.96–1.00) | 0.96 (0.93–0.99) |
| Social interaction support | 0.97 (0.96–0.99) | 0.97 (0.95–1.00) | 0.95 (0.93–0.98) |
| Tangible support | 0.97 (0.96–0.99) | 0.98 (0.96–1.00) | 0.97 (0.94–0.99) |
| Total social support | 0.97 (0.95–0.99) | 0.97 (0.94 –1.00) | 0.94 (0.91–0.98) |
| Severity of sickle-cell disease | |||
| Mild | 1 | 1 | 1 |
| Severe | 2.75 (1.30–5.8) | 2.26 (0.76–6.73) | 2.26 (0.66–7.76) |
| Other family member with sickle-cell disease? | |||
| No | 1 | 1 | 1 |
| Yes | 1.09 (0.56–2.11) | 1.49 (0.51–4.32) | 0.52 (0.17–1.61) |
| Interviewee's ethnicity | |||
| White, Asian, or Native Brazilian | 1 | 1 | 1 |
| Black | 1.89 (0.77–4.67) | 2.46 (0.46– 13.0) | 3.69 (0.40–33.5) |
| Mixed-race | 1.46 (0.59–3.59) | 2.93 (0.57–14.8) | 4.26 (0.48– 37.20) |
| Sex of head of family | |||
| Male | 1 | 1 | 1 |
| Female | 1.35 (0.69–2.63) | 3.48 (1.22–9.89) | 1.64 (0.53–5.07) |
| Work status of head of family | |||
| Works | 1 | 1 | 1 |
| Does not work | 0.90 (0.43–1.89) | 1.84 (0.65–5.16) | 1.09 (0.30–3.85) |
| Marital status of mother/guardian | |||
| Has partner | 1 | 1 | 1 |
| No partner | 0.76 (0.39–1.46) | 0.75 (0.26– 2.11) | 1.59 (0.52–4.89) |
| Interviewee years of schooling | 0.99 (0.99–1.00) | 0.87 (0.76–0.99) | 1.00 (0.99–1.00) |
| Age of head of family | 0.99 (0.99–1.00) | 0.99 (0.95–1.03) | 0.99 (0.99–1.00) |
| Ownership status of domicile | |||
| Owned by a resident? | |||
| Yes | 1 | 1 | 1 |
| No | 1.97 (0.95–4.08) | 1.89 (0.65–5.54) | 4.34 (1.35–13.89) |
| Number of benefits | |||
| None | 1 | 1 | 1 |
| One | 1.18 (0.59–2.36) | 0.56 (0.18–1.73) | 1.49 (0.44 –5.09) |
| More than one | 1.39 (0.53– 3.64) | 1.49 (0.41–5.45) | 1.20 (0.20–7.18) |
| Household density | 1.23 (0.98–1.55) | 1.30 (0.96–1.76) | 1.31 (0.93–1.84) |
| Number of residents younger than 18 years | 1.62 (1.19–2.20) | 1.86 (1.27–2.72) | 1.85 (1.22–2.80) |
| Per capita household income | 0.99 (0.99–0.99) | 0.99 (0.99–0.99) | 0.99 (0.99–0.99) |
Families where the heads of household were women were more likely to display MoFI (OR=3.48; 95% CI 1.22–9.89) and domiciles not owned by a resident returned higher likelihoods of SeFI (OR=4.34; 95% CI 1.35–13.89). Families with larger numbers of residents under 18 years old were up to 86% more likely to display FI. Families whose children displayed severe sickle-cell disease behavior were more likely (OR=2.75; 95% CI 1.30–5.8) to suffer from MiFI.
These variables returned statistically significant direct associations with FI.
Meanwhile, an inverse relationship with MoFI was found in families where the head of household's mean years of schooling was higher. Per capita household income was inversely related to all levels of FI.
An inverse relation was found between FI (at the various different levels) and social support. Total social support was found to associate with MiFI (OR=0.97; 95% CI 0.95–0.99) and SeFI (OR=0.94; 95% CI 0.91–0.98), as compared with food security. The emotional, positive social interaction and tangible dimensions of social support were also inversely related to these levels of FI. Emotional support was associated with MoFI and SeFI, while informational support associated only with SeFI.
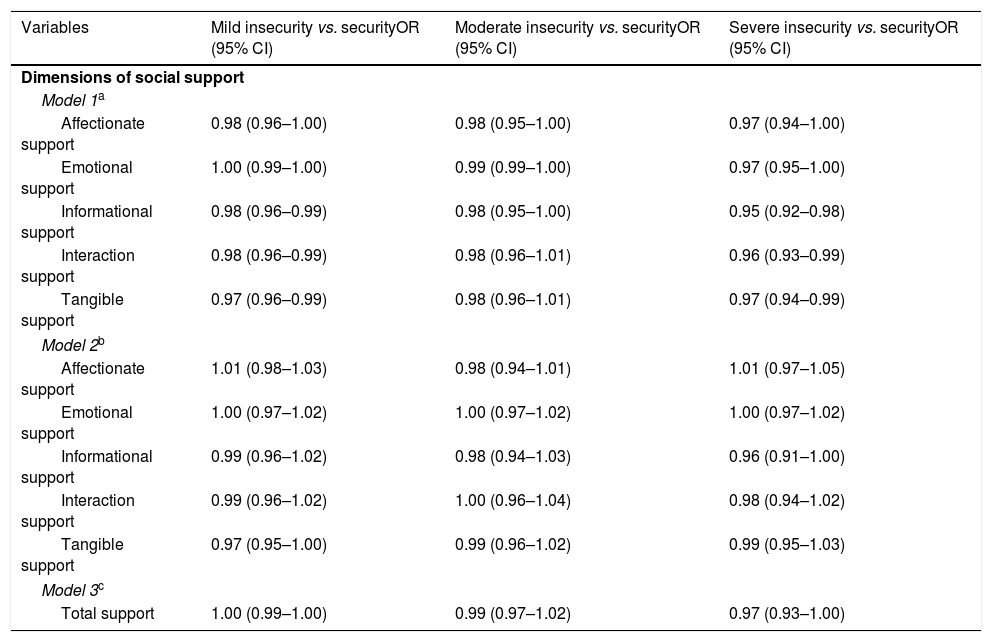
Table 4 shows the results of the multinomial regression models for relations between FI and social support, adjusted for the covariables.
Adjusted odds ratios for food insecurity, by social support dimensions, in families of children with sickle-cell disease in follow-up at a referral center, Rio de Janeiro State, Brazil, 2016.
| Variables | Mild insecurity vs. securityOR (95% CI) | Moderate insecurity vs. securityOR (95% CI) | Severe insecurity vs. securityOR (95% CI) |
|---|---|---|---|
| Dimensions of social support | |||
| Model 1a | |||
| Affectionate support | 0.98 (0.96–1.00) | 0.98 (0.95–1.00) | 0.97 (0.94–1.00) |
| Emotional support | 1.00 (0.99–1.00) | 0.99 (0.99–1.00) | 0.97 (0.95–1.00) |
| Informational support | 0.98 (0.96–0.99) | 0.98 (0.95–1.00) | 0.95 (0.92–0.98) |
| Interaction support | 0.98 (0.96–0.99) | 0.98 (0.96–1.01) | 0.96 (0.93–0.99) |
| Tangible support | 0.97 (0.96–0.99) | 0.98 (0.96–1.01) | 0.97 (0.94–0.99) |
| Model 2b | |||
| Affectionate support | 1.01 (0.98–1.03) | 0.98 (0.94–1.01) | 1.01 (0.97–1.05) |
| Emotional support | 1.00 (0.97–1.02) | 1.00 (0.97–1.02) | 1.00 (0.97–1.02) |
| Informational support | 0.99 (0.96–1.02) | 0.98 (0.94–1.03) | 0.96 (0.91–1.00) |
| Interaction support | 0.99 (0.96–1.02) | 1.00 (0.96–1.04) | 0.98 (0.94–1.02) |
| Tangible support | 0.97 (0.95–1.00) | 0.99 (0.96–1.02) | 0.99 (0.95–1.03) |
| Model 3c | |||
| Total support | 1.00 (0.99–1.00) | 0.99 (0.97–1.02) | 0.97 (0.93–1.00) |
Model 1: Each dimension of support, adjusted for years of schooling, residents younger than 18 years, severity of sickle-cell disease, sex of head of family, ownership status of domicile, and per capita income.
In relation to each dimension of social support (Model 1), a statistically significant inverse association was observed between FI and social support in the informational (MiFI OR=0.98; 95% CI 0.96–0.99 and SeFI OR=0.95; 95% CI:0.92–0.98), social interaction (MiFI OR=0.98; 95% CI 0.96–0.99 and SeFI OR=0.96; 95% CI 0.93–0.99) and tangible (MiFI OR=0.97; 95% CI 0.96–0.99 and SeFI OR=0.97; 95% CI 0.94–0.99) dimensions. The association was observed to lose statistical significance when all the social support dimensions entered the model (Model 2) or when total support was used (Model 3).
DiscussionThis is the first Brazilian study investigating food insecurity in children with SCD and association with social support in families. The prevalence of FI observed was double the national average, which according to the latest survey the prevalence of FI in the Brazilian population was 22.6%.7
One-quarter of the families in which the head of family was unemployed and the children had severe disease were in MoFI or SeFI. Families with a larger number of individuals younger than 18 years were associated with the presence of FI. In this study, the presence of children under 18 contributed to raise SeFI, because of the increase of family density and decrease in per capita family income, since these individuals usually contribute little or nothing to income.
Children with severe SCD are precisely those who require greater clinical and nutritional care, since they present constant hospitalizations and painful crises, factors that reduce food intake. In FI, a decrease or restriction in the amount of food and number of daily meals may also limit the supply of micronutrients food sources. Panepinto et al.18 found worse quality of life in children with severe SCD.
In families of children with SCD, an inverse relation was found between the dimensions of FI and social support, i.e., the greater the social support, the lesser the likelihood of the families experiencing situations of FI, underlining the buffer effect of social support on FI. The findings of this study were similar to those of Interlenghi and Salles-Costa,11 who demonstrated that levels of FI were inversely associated with all dimensions de social support, and the findings of Nagata et al.,19 who also found an association between FI and tangible social support.
The dimensions of tangible, informative, and positive social interaction of social support showed associations with mild and severe FI, confirming the findings of other authors. The dimensions that continued to be associated with FI, after the model was adjusted, were tangible support with MoFI, emotional support with MiFI and MoFI, emotional and informative support with SeFI, and positive social interaction with all FI levels. Interlenghi and Salles-Costa11 suggested that social support contributed to reducing FI.
In this study, the covariables that returned strongest associations with the study phenomenon were severity of the disease, interviewee's ethnicity, ownership status of the domicile, and the presence of children younger than 18 years. This was expected, given that FI, particularly at the most severe levels, occurs more often in families with worse conditions of life.20 In Brazil, monthly family income is the population's main means of access to food, goods, and services, such as housing, clothing, and electricity.21 One literature review that investigated, among other things, the relationship between FI and social indicators, observed that, in the six studies examined, lower income was directly associated with FI.22
Family composition comprising larger numbers of individuals younger than18 years was significantly associated with all levels of FI. Hoffman23 found that the presence of at least one resident younger than 18 years increased the likelihood of households experiencing FI. Of the factors associated with FI, the presence of residents younger than 18 years increased household density, which altered the division of per capita household income, as such individuals generally make little or no contribution to such income.
As these families have children with chronic diseases, the severity of the disease was the differentiating factor in investigating the relationship studied. In families where the child had severe SCD, a statistically significant association was found with MiFI. The severity of SCD could entail increased health spending and influence the families’ food security. In turn, in families of children with severe SCD, the emotional, informational, social interaction, and tangible dimensions of social support associated inversely with severe FI, with odds of similar magnitudes (ranging from 0.80 to 0.96). Panepinto et al.18 found greater likelihood of worse quality of life for children who displayed severe features of SCD.
It is plausible to suppose that parents or guardians with higher mean levels of tangible support can call on such networks in situations of FI, unemployment, hospitalization, and health complications in children with SCD.11 Nagata19 examined only the tangible dimension of the MOS scale, finding that lower levels of tangible support were significantly associated with increased FI (multiple linear regression=−0.81; 95% CI −1.45 to −0.17). The positive effects of social support on FI may be associated with its role as a moderator in stressful situations.
Hadley et al.,24 in a study in Tanzania, evaluated the relationship between FI and tangible support on the basis of three questions regarding how easily the person could ask for loans or food. The results showed an inverse association between tangible support and FI. Tsai et al.9 also observed that tangible support produced greater protective effect than emotional support.
Social support in the informational and social interaction dimensions also exerted a positive effect on FI, in the same direction as tangible support. Having people who can give information and guidance may also help in coping with FI.11
When the set of dimensions and total social support were examined, a loss of statistical significance was observed, which may indicate that the dimensions of social support are not being correctly distinguished, given the very close odds results and short confidence intervals for all dimensions. Those findings would account for the loss of association in the models with all dimensions of social support. Future studies are recommended to conduct additional analyses and apply qualitative methods to identify dimensions of social support for families of people with SCD.
The association between FI and social support is still not very clear in the literature; the differences found can be explained partly by the different instruments used to measure social support and also by the different conceptual and methodological currents that aim to capture the relationship between social support and health outcomes,25 which may render studies difficult to compare.
The limitations of this study were its cross-sectional design, which made it impossible to gauge causality among the phenomena studied, and the sample size, which limited the statistical power of the analyses.
The findings suggest that the informational, social interaction, and tangible dimensions of social support are related to FI. Considering the positive effects of social support on FI, public food and nutritional security policies and social assistance for people with SCD should be encouraged.
FundingBrazilian Ministry of Health (No. 778053/2012).
Conflicts of interestThe authors declare no conflicts of interest.
Please cite this article as: Santos IN, Damião JJ, Fonseca MJ, Cople-Rodrigues CS, Aguiar OB. Food insecurity and social support in families of children with sickle-cell disease. J Pediatr (Rio J). 2019;95:306–13.
Study conducted at Universidade do Estado do Rio de Janeiro (UERJ), Rio de Janeiro, RJ, Brazil.


