
To assess the level of fecal calprotectin in preterm neonates with feeding intolerance, as well as to evaluate it as a marker of feeding intolerance and to determine a cut-off level of fecal calprotectin in feeding intolerance.
MethodsAnalytical, multicenter, case–control study, which was carried out in neonatal intensive care units in Egypt, in a period from August 1, 2014 to March 1, 2015 on 52 preterm neonates. Neonates were classified into two groups; a study group including 26 neonates who met inclusion criteria and a control group including 26 neonates for comparison.
ResultsFecal calprotectin levels ranged from 3.9μg/g to 971.8μg/g, and there was a significant increase in fecal calprotectin in the study group when compared to the control group (334.3±236.6μg/g vs. 42.0±38.2μg/g, respectively) with moderate inverse significant correlation between fecal calprotectin and birth weight. Furthermore, there was moderate, significant correlation between fecal calprotectin and duration of breastfeeding range. On the other hand, there was no correlation between fecal calprotectin and post-natal age, gestational age, or volume of feeding. A cut-off at the 67.0μg/g level, with 100.0% sensitivity and 76.9% specificity, was considered.
ConclusionFecal calprotectin level increased significantly in neonates with feeding intolerance; it can be used to detect early cases with necrotizing enterocolitis in neonates, but this subject still needs more investigations on more patients.
Avaliar o nível de calprotectina fecal em neonatos prematuros com intolerância alimentar, além de avaliá-lo como um indicador de intolerância alimentar e determinar um nível de corte da calprotectina fecal na intolerância alimentar.
MétodosEstudo caso-controle analítico, realizado em um multicentro de unidades de terapia intensiva neonatais no Egito, no período de 1° de agosto de 2014 a 1° de março de 2015, com 52 neonatos prematuros. Os neonatos foram classificados em dois grupos; um grupo de estudo incluindo 26 neonatos que atenderam aos critérios de inclusão e um grupo de controle incluindo 26 neonatos para comparação.
ResultadosOs níveis de calprotectina fecal variaram de 3,9μg/g a 971,8μg/g e houve um aumento significativo da calprotectina fecal no grupo de estudo quando comparado ao grupo de controle (334,3±236,6μg/g em comparação a 42,0±38,2μg/g, respectivamente) com correlação inversa, moderada significativa entre a calprotectina fecal e o peso ao nascer. Adicionalmente, houve correlação moderada significativa entre a calprotectina fecal e a duração do intervalo de amamentação. Por outro lado, não houve correlação entre a calprotectina fecal e a idade pós-natal, a idade gestacional ou o volume de amamentação. Foi considerado um corte nos níveis de 67,0μg/g; com sensibilidade de 100,0% e especificidade de 76,9%.
ConclusãoO nível de calprotectina fecal aumentou significativamente em neonatos com intolerância alimentar e podemos utilizá-lo para detectar casos precoces com enterocolite necrosante em neonatos, porém ainda são necessárias mais investigações em mais pacientes.’
Feeding of preterm neonates is one of the main challenges faced by neonatal practitioners, especially those in the low birth weight groups.1 Preterm neonates have greater mortality and morbidity with long-term disorders.2
Feeding intolerance is known as a difficulty in feeding milk, causing a change in the usual enteral feeding due to the appearance of one or more of the following gastrointestinal clinical symptoms: gastric residuals, vomiting, abdominal distention, distended bowel loops, and change in character of stool. Apnea, bradycardia, and temperature instability are also included as symptoms of feeding intolerance, but only for the reason of nursing judgment, in order to give guidance on detection of progression to more serious complications such as necrotizing enterocolitis (NEC).3
Many risk factors may aggravate feeding intolerance, including poor coordination of sucking and swallowing, weak lower esophageal sphincter, small stomach capacity, delayed stomach emptying time, and intestinal hypomotility4; on the other hand, human milk is the best for neonates and fortifiers derived from human milk act as a good substratum for preterm infant feeding.5
Abnormal bacterial colonization may be a factor in feeding intolerance in neonates, mainly due to dysfunction of the intestinal barrier, the immune responses, and functions of the intestine. Abnormal intestinal colonization, poor balance between microbiota, immune response, and tolerance mechanisms may result in feeding intolerance in postnatal life and also in gastrointestinal disease in childhood.6
In 1970, Fagerhol et al. searched for a marker of leukocyte turnover, and in 1980 they published their discovery of a protein in the cytoplasm of neutrophils, which they termed leukocyte-derived L1 protein, or calprotectin.7 Calprotectin is a member of the S100 family of calcium and zinc binding proteins; it is the heterodimer of S100 A8/A9. It is found in neutrophils, monocytes, and some squamous epithelium cells. The complex accounts for up to 60% of the soluble protein content of the neutrophil cytoplasm. It is released by activation of leucocytes as consequences of inflammatory diseases.8 S100 A8 is also called calgranulin A and myeloid-related protein 8 (MRP8), and S100A9 is called calgranulin B (MRP14). They both are linked to the innate immune system.9
Calprotectin has bacteriostatic and fungistatic actions, as it can isolate manganese and zinc in their cells10; it also has several biological properties including antimicrobic and imunomodulatory activity, and it is released during cell activation (active release) or cell death (passive release).11 It has been suggested as a useful indicator to determine the severity of inflammation in the intestine.12 The most significant factors that affect fecal calprotectin (FCP) excretion include ante- and perinatal antibiotic treatment, volume of enteral feeding, the occurrence of unplanned interruptions of enteral feeding, and the gastrointestinal bacterial colonization.13
Several studies have strongly suggested that a rise in FCP above baseline levels may be a candidate for a noninvasive marker of gastrointestinal diseases.14–17 FCP levels in 6-month-old infants were higher than in children.18
The present study aimed to assess the level of FCP in preterm neonates with feeding intolerance, as well as to confirm it as a marker of feeding intolerance and to determine a cut-off level of FCP that is specific and sensitive to feeding intolerance.
MethodsStudy designAnalytical case–control studyThe study population was classified into two groups: Group 1 (case group) included preterm infants that fulfilled inclusion criteria and showed any sign of feeding intolerance. Group 2 (control group) included postnatal age-, gestation-, and sex-matched control preterm babies who did not show signs of feeding intolerance.
Inclusion criteria: Preterm infants of both genders from birth until the 28th day of life and with 28 to less than 37 weeks of gestation, admitted to the neonatal intensive care unit (NICU), who showed any of the signs of feeding intolerance leading to interruption of the current feeding regime, such as: increased gastric residuals (>50%) of the previous feeding, emesis, abdominal distention (increase in abdominal girth by 2cm or more between feedings), bloody stool, diarrhea, and visible bowel loops.3
Exclusion criteria: Neonates suffering from intestinal congenital anomalies or neonates with sepsis.3
Sample size: The following equation used to determine the required sample size:
where: N=number; Zα=the value of standard normal distribution for type I error probability for one sided test and equal 1.96 for 95% significance; Zβ=the value of standard normal distribution for the desired statistical power of 90% and equal 1.28 for 90% power; P−=(P1+P2)/2; Q−=1−P−; P1=56%, is the estimated proportion of an attribute that is present in the population1; P2=prevalence of neonates expected to have low FCP level equals 5%.
According to the calculation the sample size totaled 52 neonates: 26 neonates from each group who were admitted to the NICU in the period between the 1st of August, 2014 until the 1st of March, 2015.
All the studied neonates were subjected to history taking, full clinical examination, and investigations: C-reactive protein, complete hemogram, and FCP.
FCP was measured in stool using the Ridascreen quantitative enzyme linked immunoassay (Biopharm AG, Darmstadt, Germany)
Statistical analysisThe collected data were organized, tabulated, and statistically analyzed using SPSS version 16 (SPSS, Inc., Chicago, USA), running on an IBM (International Business Machines, New York, USA) compatible computer. Qualitative data (categorical) were represented as relative frequency and percent distribution, and for comparison between groups, chi-squared (X2) was used as a test of comparison. Quantitative data were represented as mean and standard deviation (SD). For comparison between groups, Student's t-test for independent samples was used for normally distributed data; the Mann–Whitney (U) test was used for non-normally distributed data. For correlation, the Pearson's correlation coefficient (r) was used; correlation was proportional if the sign was positive; inverse if the sign was negative; mild if <0.3; moderate if 0.3–0.7; and powerful if >0.7; complete correlation if r=1.0; and no correlation whatsoever if r=0.0. For interpretation of results, p-values<0.05 were considered significant.
Ethical considerationEthical approval of the study was obtained from the research ethics committee of the faculty of medicine of the Suez Canal University in and a written informed parental consent also was obtained.
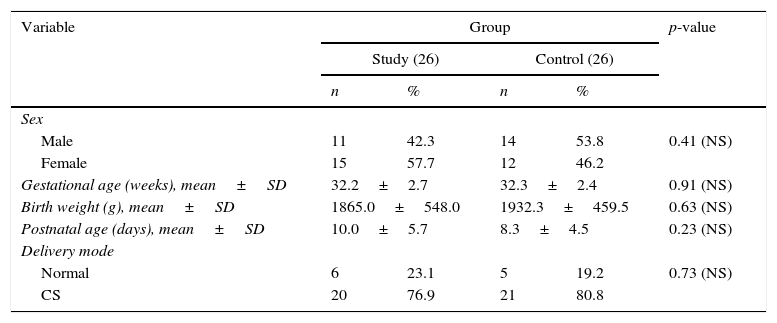
ResultsRegarding demographic characteristics (Table 1)It was found that there was no significant difference between the study group and controls regarding sex distribution. The neonates included ranged from 28 to 36 weeks gestation and there was no significant difference between both groups with regards to gestational age (32.2±2.7 vs. 32.3±2.4 weeks, respectively). Their birth weight ranged from 900g to 2750g and there was no significant difference of birth weight between both groups. Regarding the mode of delivery; 11 cases (21.2%) were delivered by normal vaginal delivery and 41 cases (78.8%) were delivered by cesarean delivery; there was no significant difference for normal vaginal delivery in this study when compared to the control group. Post-natal age ranged from 3rd to 25th days, with a non-significant increase of post-natal days in the study group when compared to the control group.
Demographic characteristics in study and control groups.
| Variable | Group | p-value | |||
|---|---|---|---|---|---|
| Study (26) | Control (26) | ||||
| n | % | n | % | ||
| Sex | |||||
| Male | 11 | 42.3 | 14 | 53.8 | 0.41 (NS) |
| Female | 15 | 57.7 | 12 | 46.2 | |
| Gestational age (weeks), mean±SD | 32.2±2.7 | 32.3±2.4 | 0.91 (NS) | ||
| Birth weight (g), mean±SD | 1865.0±548.0 | 1932.3±459.5 | 0.63 (NS) | ||
| Postnatal age (days), mean±SD | 10.0±5.7 | 8.3±4.5 | 0.23 (NS) | ||
| Delivery mode | |||||
| Normal | 6 | 23.1 | 5 | 19.2 | 0.73 (NS) |
| CS | 20 | 76.9 | 21 | 80.8 | |
CS, cesarean section; NS, non-specific.
The main illness in the study and control groups was respiratory distress in 37 cases (71.2%); respiratory distress syndrome (RDS) in ten cases (19.2%); transient tachypnea of newborn in three cases (5.8%); RDS plus hypoxic ischemic encephalopathy in one case (1.9%); and persistent pulmonary hypertension of newborn (PPHN) in one case (1.9%); there were no significant differences between groups.
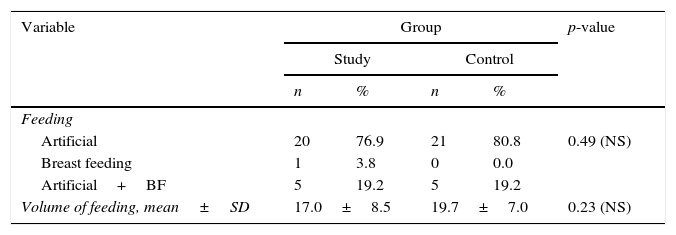
As to type of feeding; it was exclusive artificial feeding in 41 cases (78.8%); exclusive breast feeding in one case (1.9%) and mixed (artificial with breast feeding) in ten cases (19.2%), with no significant difference between groups. Feeding in the study group (volume/3h) ranged from 1mL to 30mL with a mean of 18.4±7.8mL; and there was a non-significant decrease of feeding volume in both groups (Table 2).
The presentation of feeding intolerance ranged from vomiting in six cases (23.2%); vomiting and abdominal distension in five cases (19.2%); residual and abdominal distension in seven cases (26.9%); abdominal distension, vomiting, apnea, and greenish residual in five cases (19.2%); vomiting with residual in two cases (7.7%); and abdominal distension, vomiting, residual, and delayed gastric emptying in one case (3.8%). Altogether five cases (9.6%) with Stage IA reported to have NEC in the study group.
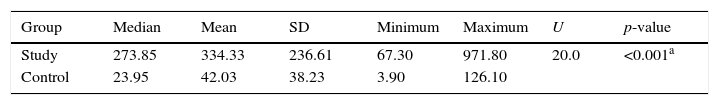
FCP levels ranged from 3.9μg/g to 971.8μg/g, with a significant increase of FCP in the study group when compared to the control group (334.3±236.6μg/g vs. 42.0±38.2μg/g, respectively), and with moderate inverse significant correlation between FCP and birth weight. Furthermore, there was moderate, significant correlation between FCP and stop feeding duration. Conversely, there was no-significant correlation between FCP and post-natal age, GA, or volume of feeding (Table 3).
Fecal calprotectin in study and control groups.
| Group | Median | Mean | SD | Minimum | Maximum | U | p-value |
|---|---|---|---|---|---|---|---|
| Study | 273.85 | 334.33 | 236.61 | 67.30 | 971.80 | 20.0 | <0.001a |
| Control | 23.95 | 42.03 | 38.23 | 3.90 | 126.10 |
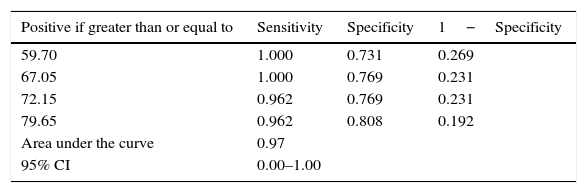
Analysis of ROC curve showed that the area under the curve was 0.97 (this reflected higher sensitivity); for the best cut-off, values with the best sensitivity were chosen; at the level of 67.0μg/g, the sensitivity was 100.0% and specificity was 76.9% (Table 4).
Sensitivity of FCP in diagnosis of feeding intolerance.
| Positive if greater than or equal to | Sensitivity | Specificity | 1−Specificity |
|---|---|---|---|
| 59.70 | 1.000 | 0.731 | 0.269 |
| 67.05 | 1.000 | 0.769 | 0.231 |
| 72.15 | 0.962 | 0.769 | 0.231 |
| 79.65 | 0.962 | 0.808 | 0.192 |
| Area under the curve | 0.97 | ||
| 95% CI | 0.00–1.00 | ||
FCP, fecal calprotectin.
Feeding intolerance is very common among preterm infants on enteral feeds, and may either be a benign sign of reduced GI motility or may be an initial manifestation of necrotizing enterocolitis (NEC). It is one of most common reasons to delay advancement of enteral feeds or for suspension of feeds in preterm infants.19 FCP has been suggested to be a useful marker of gastrointestinal inflammation in neonates, and has also been raised in cases of inflammatory bowel disease.20
The present patients’ gestational age ranged from 28 to 36 weeks, with mean of 32.3±2.6 weeks, mean birth weight of 1898.7±501.9g, and mean postnatal age at time of diagnosis of 10.0±5.7 days. It was found that 11 of the study group were males and 15 were females. In the study by Zoppelli et al.,21 they found that the mean gestational age (GA) was 28.5 weeks and birth weight was 1057g. In the study by Albanna et al.,16 they found a mean GA of 32 weeks, a mean birth weight of 1500g, and a mean age at diagnosis of 9 days; nine were boys and six were girls. Cui and Li14 had a mean GA of 30 weeks, with mean age at diagnosis of 12 days. In the study by Carroll,22 samples were obtained (one at birth and the other on the 3rd day after birth) from 38 preterm infants with GA ranging from 29 to 33 weeks. Aydemir et al.17 found mean birth weight of 950g, and a mean age of 14 days at diagnosis.
Altogether, 41 neonates were exclusively fed artificially, ten had mixed feeding, and only one case was exclusively breast fed, unlike the study by Yoon,15 in which no infants were exclusively breastfed.
The present study found no significant correlation between FCP level and volume of enteral feeding, which agrees with Campeotto et al.23 and differs from the study by Yang et al.,24 in which FCP levels decreased with increasing enteral feeding volume during the first month of postnatal life, and from Josefesson et al.25 and Rougé et al.,13 who found that FCP increased with increasing feeding volume.
Previous studies have researched the effect of the type of feeding on the level of FCP: Campeotto et al.23 and Yang et al.24 found that there is no difference in the FCP levels of infants fed maternal breast milk vs. hydrolyzed formula. Yoon et al.15 found that there was no effect of type or method of feeding on FCP, while Li et al.26 found that FCP level was higher in breast fed infants than in formula fed infants. In the present study it was not possible to examine the relationship between exclusively breast fed and exclusively formula fed infants, as there was only one exclusively breast fed infant.
This study found no effect of gender or gestational age on level of FCP, which is in agreement with Campeoto et al.,23 and also matches with Yang et al.24 and Kapel et al.,18 but is in disagreement with Rougé et al.,13 who found a weak negative linear relationship between FCP and gestational age. Yoon et al.15 found a clear positive linear relationship between two the variables (gestational age and level of FCP) in newborns born at <26 weeks GA and a distinctive negative linear relationship between them in newborns born after or at week 26 to <30 weeks.
There was a significant inverse correlation between FCP level and birth weight, in agreement with Laforgia et al.27 and in disagreement with Campeotto et al.,23 who found no significant relation between birth weight and FCP.
In the present study there was a significant positive correlation between premature rupture of membranes (PROM) and level of FCP. This was in agreement with Cui and Li.14
It was found that postnatal age has no significant correlation with FCP level; this was in agreement with Campeotto et al.23 and in disagreement with Josefesson et al.25 and Rougé et al.,13 who observed a positive relationship, and Yang et al.,24 who found a negative relationship, as FCP levels tended to decrease with increasing age.
There was no correlation between mode of delivery and FCP level. This was in agreement with Laforgia et al.27 and Rougé et al.,13 and in disagreement with Josefesson et al.,25 who observed positive relationship with caesarian section (CS) delivery, and Cui and Li,14 who observed negative relationship with CS delivery.
In the present study group, four preterm infants died during the time of study. Twenty-six preterm were found to have signs of feeding intolerance; five of them (9.6%) had suspected NEC (bell's stage IA); all of them have recovered completely except for one case who died during the study. In the study by Zoppelli et al.,21 9.2% of patients developed NEC stage II, of whom five had fulminant NEC. Aydemir et al.17 observed three patients with mild NEC (Bell's stage IB), four with definite NEC (Bell's stage IIB), and three with clinical signs consistent with advanced NEC (Bell's stage IIIA or IIIB).
The FCP level in the present study ranged from 3.9 to 971.8mg/kg, with a mean of 188.2±223.5. FCP was significantly different between groups, with higher FCP levels in the case group, which was in agreement with Cui et al.,14 who stated that there was increased FCP level in the group with feeding intolerance; this was also in agreement with Rougé et al.,13 who stated that FCP increased in preterm with poor tolerance to enteral feeding. Also, this finding matched with Yang et al.,24 who found that the FCP level in preterm infants rose around the time of initial signs of GI illness and decreased as these signs were treated and resolved, and that FCP was greater among those with NEC symptoms.
FCP in the present study had sensitivity of 100% and specificity of 76.9% in diagnosing feeding intolerance, with a cut off level of 67.0μg/g, which is lower than previous studies and with better sensitivity; the cut-off level in Rougé et al.13 was 205μg/g. Yang et al.24 studied 57 babies with very low birth weight and found that FCP>350μg/g stool was noted with signs of gastrointestinal injury, such as bloody stool and bowel perforation. Additionally, the FCP level decreased after initiation of treatments in sick infants who recovered.
FCP has been studied in gastrointestinal disorders in infants; in the study by Campeotto et al.,23 a cut-off value of 363μg/g with a sensitivity 0.65 and specificity of 0.82 was set for the development of mild digestive symptoms, and a cut-off of 636μg/g with a sensitivity 0.72 and specificity 0.95 for the development of severe symptoms. Shenoy et al.28 showed that there was a significant association between high FCP and NEC. FCP had a cut-off value ≥280μg/g, and a sensitivity of 93.3% and specificity of 39%.
The present study demonstrated that there was a correlation between higher FCP levels and NEC occurrence in the case group; this is in agreement with Albanna et al.,16 who found significantly higher FCP levels in neonates who developed NEC, with maximum level in neonates with Bell's stage IIIb (307.6±4.1), which was also in agreement with Aydemir et al.,17 who found that raised FCP can predict the occurrence of NEC, as mean FCP concentrations in NEC cases (185mg/dL) were significantly higher than controls (104mg/dL). Also, they found that there was a significant positive correlation between NEC severity and FCP level. Yoon et al.15 also found that FCP concentration was higher in newborns with NEC than controls. El Fragy et al.29 showed that FCP can be used as a non-invasive marker for early prediction of NEC in neonates.
In a study by Thuijls et al. that involved 35 neonates suspected of NEC, 14 of them developed NEC. Median of FCP levels together with urinary intestinal fatty acid binding protein and claudin-3 were significantly higher in neonates with NEC than in neonates with other diagnoses, with a cut-off level of FCP (286.2μg/g feces).30 Carroll et al. showed that FCP was markedly elevated – with a mean concentration of 288.4mg/L – in patients with NEC, compared to 98.0mg/L in controls.22 FCP was increased to >2000μg/g in three cases of NEC and in one case of covered perforation with microscopic bowel inflammation.25
All of the 52 studied neonates were under treatment with antibiotics, so we were not able to identify the effect of postnatal antibiotics on FCP level. Fecal samples were not always easily obtainable in infants who had feeding intolerance, as they had delayed gastric emptying, and also during stop feeding duration it was difficult to take a stool sample.
It was concluded that preterm with feeding intolerance had statistically significant elevated levels of FCP compared to preterm infants without feeding intolerance.
Conflicts of interestThe authors declare no conflicts of interest.
Please cite this article as: Moussa R, Khashana A, Kamel N, Elsharqawy SE. Fecal calprotectin levels in preterm infants with and without feeding intolerance. J Pediatr (Rio J). 2016;92:486–92.


