


Population-level monitoring of body composition requires accurate, biologically-relevant, yet feasible methods for estimating percent body fat (%BF). The aim of this study was to develop and cross-validate an equation for %BF from Body Mass Index (BMI), age, and sex among children with intellectual disability (ID). This study further aimed to examine the performance of an existing BMI-based equation (Deurenberg equation) for %BF in children with ID.
MethodParticipants were 107 children (63 boys; aged 6-15 years) with ID randomly allocated to development (n = 81) and cross-validation (n = 26) samples. Dual-Energy X-Ray Absorptiometry provided the criterion %BF.
ResultsThe model including BMI, age, and sex (0 = male; 1 = female) had a significant goodness-of-fit in determining %BF (p < 0.001; R2 = 0.69; SEE =5.68%). The equation was: %BF = – 15.416 + (1.394 × BMI) + (4.538 × age) – (0.262 × age2) + (5.489 × sex). The equation was cross-validated in the separate sample based on (i) strong correlation (r = 0.82; p < 0.001) and non-significant differences between actual and predicted %BF (28.6 ± 9.6% and 30.1 ± 7.1%, respectively); (ii) mean absolute error (MAE) = 4.4%; and (iii) reasonable %BF estimations in Bland-Altman plot (mean: 1.48%; 95% CI: 12.5, -9.6). The Deurenberg equation had a large %BF underestimation (mean: -7.1%; 95% CI: 5.3, -19.5), significant difference between actual and estimated %BF (28.6 ± 9.7% and 21.5 ± 7.0%, respectively; p < 0.001), and MAE = 8.1%.
ConclusionsThe developed equation with BMI, sex, and age provides valid %BF estimates for facilitating population-level body fat screening among children with ID.
Obesity is a worldwide health epidemic for individuals with and without intellectual disability (ID).1-3 Children with ID, however, are nearly two times more likely to be obese than children without ID.4-6 Excessive weight increases the risk for secondary health conditions such as hyperlipidemia, diabetes, respiratory and sleeping disorders among children with ID.7-9 Obesity is a condition characterized by an excessive percent body fat (%BF).10 Dual-Energy X-Ray Absorptiometry (DXA) is a valid method for measuring %BF in children.11,12 This laboratory method, however, cannot be easily applied to population surveillance because these are time-consuming and expensive.12 Among field methods, Bioelectrical Impedance Analysis (BIA) and skinfold thicknesses are common methods for measuring %BF, but it can still be inconvenient in developing countries. The use of an inexpensive and more practical tool may be of much greater immediate concern in resource-poor countries where DXA, BIA, and calipers may not be available to the general population. Another inexpensive method that requires minimal equipment involves measuring the weight and height. These measures can be easily standardized and applied within population-level body fat monitoring in developing countries where the pandemic of excessive adiposity is growing.
The Body Mass Index (BMI) has been a common method for evaluating %BF in children. Previous research indicates a moderate to strong association between BMI and %BF in children with and without ID.13-15 Previous research has further developed an equation (Deurenberg Equation) for estimating %BF in individuals aged 7-15 years without disabilities.13 This equation, however, may not provide accurate %BF estimates in children with ID, but this has not been examined to date. Children with ID have higher variability in anthropometric measurements compared with youth without ID.4]There has further been reported some evidence of altered body composition in youth with ID, including an unproportional amount of body fat in the trunk, limbs, and whole body, compared with those without ID.16 The development of a simple method may improve %BF monitoring among children with ID.17 Therefore, it is important to develop and validate an equation for %BF estimation from BMI and simple demographic variables in children with ID. Moreover, once a specific equation for %BF estimation in children with ID is developed, comparing its performance with an equation for children without disabilities would further be useful for ID population-level excessive body fat surveillance among children with ID.
The aim of this study was to develop and cross-validate an equation for estimating %BF from BMI, age, and sex among children with ID. This study further aimed to examine the performance of the widely used Deurenberg BMI-based equation for estimating %BF in children with ID.
MethodsParticipantsParticipants were recruited from specialized centers for children with ID, Southeastern Brazil. The inclusion criteria were: 1) being 6-15 years old; 2) being independently ambulatory; 3) having no health conditions that could affect weight, height, or DXA measures; and 4) being able to understand the procedures. The authors included participants with health conditions that were medically treated (i.e., heart diseases, hypothyroidism, and epilepsy). Participants (n=110) with ID aged 6-15 years volunteered for this study. The authors used this age range because past research has demonstrated a pattern of %BF development occurring in two distinct periods: %BF starts increasing linearly in girls and boys from age six; and after some fluctuations in boys during early adolescence, a similar proportional increase in %BF is observed in both girls and boys from late adolescence (about 15 years old).18 The authors excluded participants who had suboptimal DXA images due to movement artifacts (n = 3). The final sample included 107 children with ID who had all anthropometrics and DXA measures. Of those volunteers, 84 had no other disability diagnosis, 4 had cerebral palsy, 11 Down syndrome, 7 unknown genetic conditions, and 1 had microcephaly. From the total sample (n = 107), the authors randomly selected 26 subjects (24% of the sample) to be the cross-validation sample following a previous recommendation to allocate at least 20% of the sample to cross-validation;19 the remaining 81 subjects served as the sample for the equation derivation. The study was approved by the ethics committee, and all procedures were conducted according to the Declaration of Helsinki. All parents or guardians of participants provided written informed consent.
ProtocolParticipants and a parent or legal guardian attended a single session, where demographic, clinical, and anthropometric data were collected. The parent or guardian attended the session and completed a demographic and health history questionnaire about the participant. Age, ID level, sex, ethnicity, disability status, and presence of diseases were obtained from the questionnaire and from the clinical records of the specialized centers. The ID level (mild to severe ID) were obtained accordingly to the clinical records provided by the specialized center administrators. Anthropometric variables were measured by experienced technicians following standardized procedures.20 Weight and height were measured in light clothes without shoes with a digital scale/stadiometer to the nearest 0.1 kg and 0.1 cm, respectively. BMI was calculated as weight in kilograms divided by height in meters squared (kg•m−2). Whole-body DXA scans were performed at the iDXA (GE Healthcare Lunar, Madison, WI, USA) following the procedures outlined in the manufacturer's manual, and the %BF was determined with the enCore™ 2011 software, version 13.6 (GE Healthcare Lunar, Madison, WI, USA). The iDXA phantom was used to ensure the high quality of DXA scans. A single experienced technician performed all DXA measurements and quality control.
Statistical analysesStatistical analyses were performed with SPSS Statistics 25 (IBM, Armonk, NY), and the alpha level was 0.05. The authors used independent-samples t-tests or Mann-Whitney U-test to compare continuous variables (age, anthropometrics, and %BF) and χ2 to compare categorical variables (ethnicity, disability status, ID level, and presence of diseases) between development and cross-validation samples. The authors examined data accuracy, distributions, univariate and multivariate outliers for the dependent (%BF) and independent variables (BMI, sex, age, disability, ID level, ethnicity, and presence of diseases).19 Histograms, boxplots, and Q-Q plots were used to examine normality. The authors used Cook's and Mahalanobis distances for detecting univariate or multivariate outliers.
Prediction equationThe equation was developed using hierarchical regression models. Sequential entry of independent variables was determined following theoretical and statistical justification. The authors considered BMI, age, and sex because previous research has demonstrated a significant effect of these variables on %BF in individuals aged ≤15 years.13 The authors further considered the magnitude of the bivariate associations between the dependent and independent variables. The square of BMI and age were further considered as independent variables for the examination of the nonlinear regression relationship. The authors used the Spearman rho rank-order correlation (rs) to evaluate the association between %BF and independent variables. The effect of disability status, ethnicity, presence of diseases, and ID level in the regression model were further examined. Research has demonstrated that these variables potentially predict weight gain in youth with ID.6,21,22 Goodness-of-fit of the model was evaluated using R2 and Standard Error of Estimate (SEE).
Cross-validationThe authors used the BMI-predicted %BF equation developed in the previous step to estimate the %BF in the cross-validation sample. Pearson correlation coefficient was used to examine the association between %BF determined by DXA and BMI-predicted %BF, and the square of this coefficient was calculated. A large difference between the square of Pearson's correlation coefficient in the cross-validation sample and the R2 of the regression model indicates low generalizability of the BMI-predicted %BF model.19 The authors further used a paired samples t-test to examine the differences between DXA-determined and BMI-predicted %BF. Agreement between DXA-determined and BMI-predicted %BF was further evaluated with a Bland-Altman plot,23 mean absolute error (MAE), and root mean square error (RMSE). Differences in MAE between disability subsamples (no other diagnosis and other disabilities) were examined with an independent-samples t-test. The authors also estimated %BF in the cross-validation sample with a previously equation (Deurenberg Equation) for children without ID;13 the equation is:
ResultsSamples
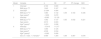
The development sample consisted of 81 children with ID (50 boys and 31 girls; age 12 ± 2.7 years). The cross-validation sample consisted of 26 children with ID (13 boys and 13 girls; age 11.9 ± 2.8 years). There were no significant differences in age, ethnicity, ID level, presence of diseases, anthropometric measures, and actual %BF between development and cross-validation samples (p > 0.05; Table 1).
Demographics and anthropometrics (mean values, standard deviation, or percent) of children with intellectual disability.
| Variables | Development Sample | Cross-Validation Sample | |||||||||||||||||
|---|---|---|---|---|---|---|---|---|---|---|---|---|---|---|---|---|---|---|---|
| All (n = 81) | Boys (n = 50) | Girls (n = 31) | All (n = 26) | Boys (n = 13) | Girls (n = 13) | ||||||||||||||
| Mean | SD | Mean | SD | Mean | SD | Mean | SD | Mean | SD | Mean | SD | ||||||||
| Age (years) | 12.0 | 2.7 | 12.6 | 2.4 | 11.1c | 2.9 | 11.9 | 2.8 | 11.8 | 3.3 | 12.0 | 2.5 | |||||||
| Weight (kg) | 48.5 | 17.8 | 52.8 | 18.5 | 41.7 b | 14.4 | 46.4 | 16.1 | 48.2 | 19.5 | 44.7 | 12.2 | |||||||
| Height (cm) | 150.3 | 16.6 | 155.5 | 15.6 | 142.0a | 14.8 | 150.6 | 15.1 | 151.6 | 16.8 | 149.6 | 13.9 | |||||||
| BMI (kg·m−2) | 20.9 | 5.1 | 21.3 | 5.3 | 20.2 | 4.9 | 20.0 | 4.7 | 20.3 | 5.7 | 19.8 | 3.7 | |||||||
| %BF | 30.7 | 10.0 | 28.4 | 11.1 | 34.2b | 6.6 | 28.6 | 9.6 | 24.5 | 10.0 | 32.7c | 7.5 | |||||||
| Ethnicity | |||||||||||||||||||
| White (%) | 44.4 | 42.0 | 48.4 | 57.7 | 53.8 | 61.5 | |||||||||||||
| Non-White (%) | 55.6 | 58.0 | 51.6 | 42.3 | 46.2 | 38.5 | |||||||||||||
| ID level | |||||||||||||||||||
| Mild (%) | 58.0 | 52.0 | 67.7 | 57.7 | 53.8 | 61.5 | |||||||||||||
| Moderate (%) | 24.7 | 24.0 | 25.8 | 26.9 | 38.5 | 15.4 | |||||||||||||
| Severe (%) | 1.2 | 2.0 | - | 7.7 | 7.7 | 7.7 | |||||||||||||
| Diseases | |||||||||||||||||||
| Yes (%) | 14.8 | 10.0 | 22.6 | 23.1 | 23.1 | 23.1 | |||||||||||||
| No (%) | 79.0 | 86.0 | 67.7 | 73.1 | 76.9 | 69.2 | |||||||||||||
SD, standard deviation; BMI, body mass index; %BF, percent body fat determined by DXA.
There were significant bivariate associations between BMI (rs = 0.63; p < 0.001), age (rs = -0.34; p < 0.01), and sex (rs = 0.29; p < 0.01) with %BF (Fig. 1A and B) and were sequentially entered in the hierarchical regression model. Disability, ID level, ethnicity, and presence of diseases were not significantly associated with %BF. In the regression model, BMI was a significant predictor of %BF (p < 0.001; SEE = 7.70% BF), explaining 41% of the variance in %BF. BMI squared was not a significant predictor and had no contribution to the variance in %BF (p = 0.609; R2 change = 0.002). Age significantly increased the R2 from 41 to 59% and decreased the SEE from 7.70 to 6.44% BF (p < 0.001; R2 change = 0.183). Adding age squared in the model significantly increased the R2 from 59%-63% and decreased the SEE from 6.44 to 6.22%. Sex further contributed to the model (p < 0.001; R2 change = 0.067). Disability, ID level, ethnicity, and health condition did not contribute significantly to the final model. The final prediction model included BMI, age, age squared and sex (p < 0.001; R2 = 0.69; SEE = 5.68% BF; Table 2). The prediction equation was:
BMI is in kg•m−2 and for sex, 0 = male; 1 = female.
 and age (b) in children with intellectual disability.")
Hierarchical regression models predicting DXA-determined percent body fat in children with intellectual disability.
| Model | Variable | b | SE | R2 | R2 change | SEE |
|---|---|---|---|---|---|---|
| 1 | Intercept | 4.722 | 3.600 | |||
| BMI (kg·m−2)a | 1.240 | 0.167 | 0.41 | 7.701 | ||
| 2 | Intercepta | 21.094 | 4.084 | |||
| BMI (kg·;m−2)a | 1.380 | 0.142 | 0.59 | 0.183 | 6.436 | |
| Age (years)a | −1.609 | 0.272 | ||||
| 3 | Intercept | −8.085 | 12.129 | |||
| BMI (kg·;m−2)a | 1.362 | 0.137 | 0.63 | 0.032 | 6.221 | |
| Age (years) | 4.010 | 2.224 | ||||
| Age2 (years)a | -0.251 | 0.098 | ||||
| 4 | Intercept | −15.416 | 11.217 | |||
| BMI (kg·;m−2)a | 1.394 | 0.125 | ||||
| Age (years)a | 4.538 | 2.034 | ||||
| Age2 (years)a | −0.262 | 0.090 | ||||
| Sex (0 = male; 1 = female)a | 5.489 | 1.354 | 0.69 | 0.067 | 5.678 |
b, un-standardized coefficient; SE, standard error; SEE, standard error of estimate; BMI, body mass index.
The authors observed a strong association between DXA-determined and BMI-predicted %BF in the cross-validation sample (r = 0.82; p < 0.001; Fig. 2A). The square of this correlation coefficient was nearly identical to the R2 of the prediction model (0.67 and 0.69, respectively); paired-samples t-test indicated no significant difference between DXA-determined %BF and BMI-predicted %BF (28.6 ± 9.6% and 30.1 ± 7.1%, respectively; p > 0.05). The MAE in the cross-validation sample with the BMI-predicted %BF equation was 4.4 ± 3.7%, and the RMSE was 6.4%. The authors further observed no significant difference in absolute errors between individuals with no other diagnosis and other disabilities (4.7 ± 3.9% and 3.7 ± 3.1%, respectively, p > 0.05). The Bland-Altman plot indicated a small mean overestimation of DXA-determined %BF and somewhat wide limits of agreement (mean error: 1.48%; 95% CI: 12.5 to -9.6; Fig. 2B). It was further observed that mean errors in children with ID with no other diagnosis and other disabilities were 1.8 and -0.2, respectively.
. Bland-Altman plots of the difference between the %BF measurements (y-axis) against their average (x-axis) using the presently BMI-predicted %BF equation (b) and the Deurenberg equation (c) in boys and girls with intellectual disability; solid and dotted lines show mean and 95% limits of agreement, respectively.")
DXA-%BF against the derived Equation-%BF in children with intellectual disability in the cross-validation sample (a). Bland-Altman plots of the difference between the %BF measurements (y-axis) against their average (x-axis) using the presently BMI-predicted %BF equation (b) and the Deurenberg equation (c) in boys and girls with intellectual disability; solid and dotted lines show mean and 95% limits of agreement, respectively.
In contrast, the Deurenberg equation had lower %BF predictability in the cross-validation sample compared to the presently-developed equation. There was a strong association between DXA-determined %BF and Deurenberg-predicted %BF (r = 0.76); however, there was a large mean underestimation of DXA-determined %BF (mean error: -7.1%; 95% CI: 5.3, -19.5; Fig. 2C). Moreover, there was a significant difference between DXA-determined %BF and Deurenberg-predicted %BF (28.6 ± 9.7% and 21.5 ± 7.0%, respectively; p < 0.001), MAE = 8.1 (±4.9%), and RMSE = 10.2%.
DiscussionThe authors developed and cross-validated an equation for estimating %BF from BMI, age, and sex in children with ID. The authors further examined the performance of the Deurenberg equation developed for children without ID. Given the ease of determining BMI, age, and sex, a population-specific equation utilizing these variables may improve population-level %BF monitoring in children with ID.
BMI had a moderate linear bivariate association with %BF in the present sample of children with ID. This finding agrees with past research indicating moderate to strong associations between BMI and %BF in children with and without ID.13-15 The authors’ analysis further indicated that BMI accounted for 41% of the variance in %BF, somewhat higher than the 25% of explained variance previously reported in children without ID aged 7-15 years.13 Although BMI had a substantial contribution to the model, it did not explain 59% of the variance in %BF. Past research has demonstrated that %BF is substantially influenced by growth and maturation; on average, reference %BF curves indicate substantial variability in %BF from early childhood to late adolescence with higher values in girls than boys.18,24 This highlights the importance of two factors in the model predicting %BF: age and sex.
Not surprisingly, age and sex, both of which had significant bivariate associations with %BF, collectively provided an additional 28% of the explained variation in %BF. This finding is in general agreement with past research that reported a significant effect of age and sex in predicting %BF with R2 change of 17% in a sample of children aged 7-15 years.13 The influence of age is logical since %BF changes to a significant extent from early childhood to late adolescence.18 The effect of sex is also theoretically justified because the developmental pattern of %BF is different between boys and girls; girls experience a gradual increase of %BF from early childhood to adolescence, whereas, in boys, %BF starts increasing before puberty and then gradually declines to reach its lowest point at late adolescence.18,24 Although it is well-known that %BF changes substantially during growth and maturation among youth without ID, little information is available about the developmental patterns of %BF in children with ID. Recent studies showed that %BF in girls with Down syndrome was somewhat higher than in boys.15 Apart from sex, %BF seems to vary as a function of age in children with Down syndrome.25 In summary, BMI, age, and sex accounted for a substantial portion of the variance in %BF, and this is consistent with past experimental evidence. The authors believe that the next step involves examining easily-determined factors that could potentially account for the 31% of unexplained variance in %BF and improve prediction among youth with ID. Such factors may include the stage of biological maturation.26
The BMI-predicted %BF equation the authors developed had the reasonable predictive ability to estimate %BF in a separate sample of children with ID. The small difference between the R2 of the BMI-predicted %BF equation and the square of the correlation between the estimated and DXA-determined %BF in the cross-validation sample indicated the high generalizability of the equation. Moreover, the authors did not find any significant difference between DXA- and BMI-predicted %BF mean values and relatively small absolute and root mean square error. This finding is supported by previous research predicting %BF from BMI, age, and sex in the general population;13 using their equation in a separate sample of children, these researchers also found a relatively small difference between predicted and observed %BF. When the authors examined the study's Bland-Altman plot, we found a small overestimation of DXA-determined %BF and somewhat wide 95% limits of agreement. This may indicate the possibility of a small overall bias but lower predictability when the equation is applied to individual children with ID rather than at a group level.
The present study's BMI-predicted equation demonstrated higher agreement for %BF estimation compared with the previous equation developed for children without ID, as indicated by a stronger association and smaller prediction errors of the equation against the DXA-%BF criterion method. One biological explanation for the differences between the equations is that children with ID may have higher variability in total and regional body fat and fat-free mass distributions than children without ID.16 Another consideration is that the equation by Deurenberg et al. was derived from a sample of leaner children than the present participants with ID. For example, the mean %BF for the Deurenberg sample was 18%, compared to the study's sample mean of 30%. It is also important to note that the Deurenberg equation was developed and cross-validated using a different laboratory reference criterion for %BF determination (underwater weighing) which results in markedly different %BF estimates compared to DXA in the general population of youth.27,28 Lastly, it should be considered that the Deurenberg equation included age in the model, and the equation included age and age squared. It is evident that an equation for predicting %BF specifically for children with ID is more appropriate than a generalized equation developed for the general population.
The present BMI-predicted %BF equation has clinical and research implications. Researchers may use the present equation to estimate population-level %BF in children with ID where the laboratory method is not available. This is particularly relevant for advancing large-scale epidemiological surveillance research tracking body fat from four simple measurements (i.e., weight, height, age, and sex). Children with ID are at higher risk for obesity than children without ID.4-6 However, because the present prediction equation demonstrated somewhat wide limits of agreement, caution should be exercised when using the equation for clinical practice. Researchers and health providers are cautious when applying the present equation to subpopulations of children with ID, such as those with cerebral palsy or Down syndrome. Past researchers have reported that these individuals may demonstrate higher regional variability in anthropometric measurements compared with youth with ID.29 For instance, youth with Down syndrome are at higher risk for being overweight than youth with ID, whereas youth with cerebral palsy are at higher risk for being underweight compared to other disabilities.29
There are some limitations that should be considered. First, the convenience samples may not be representative of the whole population of youth with ID. Second, the authors included a specific age range (6-15 years), and the results may not generalize to youth outside this range. Lastly, although the authors observed that, in youth with other disabilities, differences between techniques were nearly zero in the Bland-Altman, small sample sizes might limit the generalizability of the equation to these sub-populations. The following strengths should also be considered. The presently %BF equation was developed from DXA. This equation was developed from simple measures and was cross-validated on a separate sample.
In conclusion, BMI, age, and sex were significant predictors of %BF in children with ID. An equation estimating %BF from these predictors in children with ID was relatively accurate. The results have implications for improving public health surveillance, facilitating population-level body fat screening, and advancing excessive %BF prevention research among children with ID.
FundingThis work was supported by the Sao Paulo Research Foundation (FAPESP grants: 2019/07103-6; 2017/13071-4; 2018/02677-1).
Study conducted at the Universidade de Campinas (Unicamp), Faculdade de Ciências Médicas, Campinas, SP, Brazil.


