

To assess body composition modifications in post-pubertal schoolchildren after practice of a physical activity program during one school year.
MethodsThe sample consisted of 386 students aged between 15 and 17 years and divided into two groups: the study group (SG) comprised 195 students and the control group (CG), 191. The SG was submitted to a physical activity program and the CG attended conventional physical education classes. Body composition was assessed using body mass index (BMI), percentage of body fat (%BF), fat mass (FM), and lean mass (LM).
ResultsA positive effect of the physical activity program on body composition in the SG (p<0.001) was observed, as well as on the interaction time x group in all the variables analyzed in both genders. A reduction in %BF (mean of differences = -5.58%) and waist circumference (-2.33cm), as well as an increase in LM (+2.05kg) were observed in the SG for both genders, whereas the opposite was observed in the CG.
ConclusionThe practice of programmed physical activity promotes significant reduction of body fat in post-pubertal schoolchildren.
Verificar as modificações da composição corporal de escolares pós-púberes após a prática da atividade física programada durante um ano letivo.
MétodoAmostra composta de 386 alunos, divididos em dois grupos: estudo 195 e controle 191, com idade entre 15 e 17 anos, o grupo estudo (GE) submetido à atividade física programada e o grupo controle (GC) a aulas convencionais de educação física. A composição corporal foi avaliada pelo índice de massa corporal (IMC), percentual de gordura (%G) e massa gorda (MG) e magra (MM).
ResultadosFoi possível observar um efeito positivo do programa de atividade física sobre a composição corporal no GE (p<0,001) do grupo e da interação tempo x grupo em todas as variáveis analisadas em ambos os sexos. Foi observadas reduções na %G (média das diferenças = -5,58%) e no perímetro da cintura (-2,33cm), aumento da MM (+2,05kg) no GE em ambos os sexos, o contrário foi observado no GC.
ConclusãoA prática de atividade física programada promove redução significativa de gordura corporal em escolares pós-púberes.
Physical activity can have its most significant effect on the prevention, rather than on the treatment of obesity. That was the conclusion of the authors of a study conducted for fifteen weeks with obese patients who walked 45minutes five days a week. For the authors, the factors that lead to obesity are family influence, caloric diets high in fats, and insufficient energy expenditure.1
The problem for those treating obesity is that, shortly after the end of treatment, conditions return to previous proportions. This is probably due to non-adherence to regular physical activity habits or unhealthy diet, or both.2
The approach for preventing and treating excess weight in children and adolescents involves changes in lifestyle, including diet and physical activity, not only in relation to the child or adolescent, but also in relation to the family and to the school and its surroundings.
Some studies have addressed the effects of intervention programs inside and outside the school on body weight control and health of children and adolescents with excess weight. An eight-month intervention program conducted in 18 schools in the Netherlands included an individual educational program consisting of 11 biology and physical education classes to induce changes in energy intake and expenditure, additional physical education classes, and changes in school cafeterias. After the intervention period, significant positive changes in body composition of the adolescents submitted to the intervention were observed.3
Therefore, physical activity can produce significant changes in body composition and lean mass (LM), and is an important factor in the control of excess weight in children and adolescents, leading to a decrease in psychosocial disorders, depression, isolation, low self-esteem, and later exerting a positive influence on hypertension, diabetes, and cardiovascular disease.4 A meta-analysis evaluating the treatment of pediatric obesity evidenced the limited effects of short-term drug interventions and changes in lifestyle (less than six months of treatment).5 Nevertheless, studies on long-term interventions (more than 12 months) have shown promising results of physical activity influence on lifestyle changes in and, consequently, body composition, both for prevention and treatment of excess weight in children and adolescents.6,7
Therefore, this study aimed to investigate the changes in body composition in post-pubertal schoolchildren after a programmed physical activity intervention implemented in physical education classes during one school year.
MethodsThis was a simple randomized clinical trial conducted by pairing grades/classes of post-pubertal schoolchildren attending the first to the third year of high school of Colégio Meta, Rio Branco, AC, Brazil, aged 15 to 17 years, during the 2011 school year. This study was approved by the Ethics Committee of Universidade Federal de São Paulo (Edict 1073/10) and by the principal of the school, after an informed consent was obtained from the schoolchildren's parents or guardians.
Exclusion criteriapermanent or temporary physical disabilities that prevented anthropometric measurements and the performance of physical exercise; absence at over 25% of physical education classes during the study; and failure to meet the criteria of post-pubertal maturation classification.
Sampling proceduresthe population of post-pubertal schoolchildren enrolled in high school in 2011 consisted of 567 students distributed in 10 classes (first, second, and third years). The stratification process occurred by simple drawing (simple randomization) in grades/classes, divided into two strata (study [SG] and control [CG]), pairing five classes for each group, totaling 283 and 284 students in each stratum. This number was reduced due to the events that led to the loss of 181 students. The final study population consisted of 386 students, 195 in the SG and 191 in the CG, estimating a probability of type I error (α) of 0.05 and a probability of type II error (β) of 80%.
Interventionboth groups had two physical education classes weekly, lasting 60minutes each. Each class had 83 physical education classes, totaling 415 annual classes. Students in the CG performed the usual physical activity at school, such as recreation and games through exercises, calisthenics, learning the fundamentals of sports, and sports activities. The students in the SG underwent programmed physical activity with heart rate monitoring, consisting of three parts: aerobic activity (exercises for flexibility, muscular strength, jumping rope, walking, alternating running, continuous jumping, recreational games), lasting 30minutes; sports games (volleyball, soccer, handball), lasting 20minutes; and with stretching, lasting 10minutes.
Measurementsthe heart rate (HR) of each student was monitored through a heart rate monitor (PM25-Beurer, Beurer GmbH, Germany). Exercise intensity was based on indications for the appropriate level of physical activity to achieve best fat-burning efficiency, which comprises the range of > 55% maximum HR (HRmax).8 HR measurement was performed through a follow-up record, according to the following criteria: the HR of the student being monitored was recorded every 10minutes during a 60-minute class; all students were regularly monitored throughout the course of study. When necessary, interventions were performed during the activities in order to control exercise intensity, aiming at keeping the exercise within the individual target zone of > 55% HRmax as long as possible.
Socioeconomic level was assessed through a questionnaire, using the classification of the Brazilian Association of Research Companies (ABEP),9 dividing the students into Class A (upper class) and B (medium-upper class).
Maturation stage was self-assessed through photographs and written description of the five stages of breast development for females (B1 - B5) and gonads for males (G1 - G5), according to Marshall & Tanner,10,11 in which students were asked to choose the picture that most accurately reflected their own stage of development. Males were considered post-pubertal at G5 and females at B4 with menarche.
Age at menarche was assessed by a prospective method through two direct questions: “a) Have you ever menstruated?”; and b) “If so, do you remember the day, month, and year you menstruated for the first time?” If at least the month and year of menarche could be recalled, the information was considered valid; otherwise, the subject would be excluded from the study.
The procedure for questionnaires application was always the same. The researcher and the class teacher were both in the classroom, each question was read and the student (respondent) answered. Sexual maturation assessment was performed in a private room.
Body composition was assessed through measurements of weight (kg), height (cm), subscapular (SSSF, mm) and triceps skinfold (TSF, mm), sum of skinfolds (Σ2SF), and waist circumference (WC, cm), according to the standardization by Petroski.12
Based on weight and height measurements, the body mass index (BMI) was calculated as weight (kg)/height (m2). Subsequently, excess weight was defined based on the World Health Organization (WHO) recommendations, considering as such (overweight and obesity) those students with Z-score ≥ 1.0.13
The percentage of body fat (%BF) was calculated based on equations developed by Slaughter et al.,14 using TSF and SSSF and taking into account gender, ethnicity (white and black), and sexual maturation.
Behnke & Wilmore's formula was used to calculate the fat mass (FM, kg) and LM (kg):15 FM = weight (kg) x (%BF/100) and LM = weight - FM.
Data were analyzed using PASW software for Windows, release 18.0 (SPSS Inc., IBM Company, Chicago, USA). The chi-squared test was used to verify the association between SG and CG regarding age, gender, and socioeconomic group. The nonparametric Mann-Whitney test was applied to compare ages between the two groups. The dependent variables (weight, height, BMI, SSSF, TSF, %BF, LM, FM, and WC) were not normally distributed after assessment by the Kolmogorov-Smirnov test. Data were transformed by the Blom formula and the standardized scores resulting from this transformation were normally distributed. For paired samples, Student's t-test was used for comparisons between pre- and post- moments within each variable between the SG and CG and within each group.
Mauchly's test was used for analysis of sphericity. Analysis of variance for repeated measures was performed for intra and inter-group comparisons of body composition. As these variables (FM, LM, and WC) differed significantly between groups at the pre-intervention moment, comparisons were adjusted for baseline values, which were used as covariates. The post hoc Bonferroni test was used to identify specific differences in variables of which F values were higher than the established statistical significance criterion (p<0.05). The chi-squared test was used to compare the associations between excess weight (overweight and obesity) and non-obese schoolchildren between the assessments. The significance level was set at 5%.
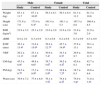
ResultsThe SG and CG were homogenous regarding age and socioeconomic status, but showed significant differences (p = 0.04) in the number of individuals of each gender, with a greater number of males in the SG and of females in the CG (Table 1). Table 2 shows the general characteristics of the groups in the pre-intervention period. Male subjects in the CG were significantly taller, heavier, and had more lean body mass (p<0.01), when compared to individuals in the SG. In contrast, males in the SG had higher levels of adiposity, with significantly higher values in the Σ2SFand the amount of relative and absolute body fat. Comparisons between female subjects from both groups showed the opposite behavior, in which the control group had a higher amount of body fat (Σ2SF, %BF, and fat mass), whereas the study group had higher LM.
Characteristics of schoolchildren in the study and control groups.
General characteristics of the groups in the pre-intervention period. Values are expressed as mean ± standard deviation.
| Male | Female | Total | ||||
|---|---|---|---|---|---|---|
| Study | Control | Study | Control | Study | Control | |
| Weight (kg) | 65.1±11.7 | 67.1±10.0a | 56.3±8.1 | 56.3±8.4 | 61.3±11.2 | 61.3±10.6 |
| Height (cm) | 171.8±7.9 | 173.4±6.4a | 161.4±6.1 | 161.1±5.3 | 167.3±8.8 | 166.8±8.5 |
| BMI (kg/m2) | 21.9±3.2 | 22.3±2.9 | 21.6±2.8 | 21.6±2.8 | 21.8±3.0 | 21.9±2.9 |
| zBMI | 0.4±1.0 | 0.3±0.9 | 0.3±0.8 | 0.2±0.9 | 0.3±0.9 | 0.3±0.9 |
| Σ2SF (mm) | 36.3±13.4a | 31.6±15.0a | 39.4±12.7a | 45.7±14.6a | 37.6±13.1 | 39.1±16.4 |
| %BF | 29.2±11.1a | 25.1±12.6a | 30.9±7.4a | 34.3±8.5a | 29.9±9.7 | 30.0±11.5 |
| LM (kg) | 45.5±8.9a | 49.8±9.6a | 38.7±5.6b | 36.5±4.4b | 42.6±8.3 | 42.7±9.9 |
| FM (kg) | 19.5±9.7b | 17.3±9.9b | 17.6±5.9b | 19.8±7.2b | 18.7±8.3 | 18.6±8.6 |
| Waist (cm) | 76.9±7.2 | 77.4±8.0 | 76.1±7.5b | 74.4±8.2b | 75.0±7.9a | 71.8±7.5a |
BMI, body mass index; zBMI, z-score of body mass index; Σ2SF, sum of skinfolds; %BF, percentage of body fat; LM, lean mass; FM, fat mass.
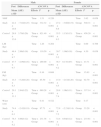
A positive effect of the physical activity program on body composition of adolescents in the groups was observed, verified by the significant effect (p<0.001) of the group and the of interaction time x group in all variables analyzed in both genders. Reductions in body fat (%BF and total) and WC, as well as an increase in LM were observed in the SG in both genders, whereas the opposite was observed in the CG (Table 3).
Comparison of body composition in children after the intervention period.
| Male | Female | |||||||||
|---|---|---|---|---|---|---|---|---|---|---|
| Post | Differences | ANCOVA | Post | Differences | ANCOVA | |||||
| Mean ± SD | Δ(SE) | Effects | F | p | Mean ± SD | Δ(SE) | Effects | F | p | |
| %BF | Time | 1.51 | 0.220 | Time | 3.62 | 0.059 | ||||
| Study | 22.2±10.8 | −7.02(0.25) | Group | 332.32 | <0.001 | 27.2±6.6 | −3.66(0.19) | Group | 540.31 | <0.001 |
| Control | 28.9±13.6 | 3.79(0.26) | Time x Group | 821.40 | <0.001 | 35.5±8.3 | 1.15(0.13) | Time x Group | 456.20 | <0.001 |
| LM (kg) | Time | 1.26 | 0.264 | Time | 0.09 | 0.769 | ||||
| Study | 48.4±8.7 | 2.86(0.18) | Group | 110.50 | <0.001 | 39.7±5.2 | 1.00(0.18) | Group | 4.30 | 0.039 |
| Control | 47.7±9.7 | −2.09(0.16) | Time x Group | 269.00 | <0.001 | 36.7±4.2 | 0.17(0.07) | Time x Group | 43.71 | <0.001 |
| FM (kg) | Time | 0.16 | 0.688 | Time | 15.63 | <0.001 | ||||
| Study | 14.3±8.3 | −5.28(0.28) | Group | 85.50 | <0.001 | 15.0±4.5 | −2.61(0.20) | Group | 92.70 | <0.001 |
| Control | 20.1±11.1 | 2.84(0.22) | Time x Group | 680.28 | <0.001 | 20.8±7.4 | 1.06(0.11) | Time x Group | 337.14 | <0.001 |
| Waist (cm) | Time | 0.41 | 0.522 | Time | 0.17 | |||||
| Study | 74.4±6.3 | −2.42(0.19) | Group | 87.71 | <0.001 | 72.8±7.2 | −2.21(0.14) | Group | 33.20 | <0.001 |
| Control | 78.3±8.2 | 0.86(0.12) | Time x Group | 231.38 | <0.001 | 72.4±7.2 | 0.64(0.12) | Time x Group | 233.61 | <0.001 |
ANCOVA, analysis of covariance; Δ(SE), mean differences (standard error of differences); %BF, percentage of body fat; LM, lean mass; FM, fat mass.
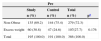
Table 4 shows the frequency of cases of excess weight (overweight and obesity) according to BMI z-score in the study and control groups before and after the intervention. There was no significant difference in the excess weight group (> 0.176) in the pre-test. There was a significant difference in the post-test, with a decrease in the number of cases of excess weight (< 0.001).
Number of schoolchildren in the excess weight (overweight and obesity) and non-obese study group in the pre- and post-intervention periods.
| Pre | ||||
|---|---|---|---|---|
| Study | Control | Total | ||
| n (%) | n (%) | n (%) | pa | |
| Non-Obese | 135 (69.2) | 144 (75.4) | 279 (72.3) | |
| Excess weight | 60 (30.8) | 47 (24.6) | 107(27.7) | 0.176 |
| Total | 195 (100.0) | 191 (100.0) | 386 (100.0) | |
| Post | ||||
|---|---|---|---|---|
| Non-Obese | 190 (97.4) | 145 (75.9) | 335 (86.8) | |
| Excess weight | 05 (2.6) | 46 (24.1) | 51 (13.2) | <0.001 |
| Total | 195 (100.0) | 191 (100.0) | 386 (100.0) | |
The study population consisted of post-pubertal schoolchildren, considering that during puberty changes do not always occur in such a gradual manner due to metabolic adaptations generated during the training process, and mainly due to changes in growth and body composition, characteristic of the growth spurt.
When comparing according to gender, the males in the SG showed a significant reduction in the variables %BF and FM, as well as an increase in LM, confirming that during puberty, the hormonal influence and the less active lifestyle give females a tendency to higher fat accumulation,16 i.e., while in females there is a more marked increase in FM due to the action of progesterone and estrogen, in males there is an increase in LM due to testosterone.17
The programmed physical activity in the SG led to changes in the variables of body composition not observed in the CG, i.e., a significant decrease in body adiposity, represented by Σ2SF, %BF, and FM. Similar results have also been observed by other authors.18,19
There is no doubt regarding the benefits of physical activity for health. Estimates of the World Health Report indicate that approximately 3% of the global burden of heart disease and 10% of strokes are due to physical inactivity.20 The same document indicates that physical inactivity is among the ten leading causes of morbidity and disability in the developed world. The WHO estimates that approximately two million deaths worldwide are caused by physical inactivity.21
Based on the review of more than 850 articles, it is recommended that individuals of school age (6-18 years) should practice 60minutes or more of moderate to vigorous physical activity every day of the week.22
Despite all the benefits provided by regular physical activity, the WHO report of 200223 stated that around 17% of the world population practices no physical activity and approximately 60% do not meet the criteria to be considered physically active (150minutes a week).
As demonstrated by meta-analyses,6,24 several studies have sought to investigate the effect of physical training on improving the prevention of excess weight and different components of body composition in children and adolescents.
The present study observed a significant decrease in %BF and FM in the SG when compared to the CG, demonstrating that a physical activity program with frequency, duration, and intensity control promoted greater energy expenditure and used body fat as the main substrate,25,26 resulting in a significant reduction of FM during one school year.
The programmed physical activity, with frequency, duration, and intensity control, was of utmost importance to achieve positive results. Harris et al.,24 in a meta-analysis that evaluated the effect of interventions with physical activity on FM in schoolchildren, demonstrated that when the intervention lasted more than three months and was combined with nutritional education, the results were more significant regarding FM reduction. This indicates that strategies to reduce and prevent excess weight should focus on adequate food intake and caloric expenditure through motor activity, aspects that should be considered when planning public policies in healthcare.
The changes observed in Σ2SF, %BF, and FM in the SG are similar to literature results in adolescents.3 Physical activity alone produces a modest reduction in body fat, but when physical activity is performed in a controlled manner and with increased intensity, it can promote a significant reduction in fat oxidation, both visceral and subcutaneous,27,28 mainly when the individual is overweight. It is well documented that physical activity helps burning body fat.3,29
The intensity of physical activity appears to be directly related to fat loss, as higher-intensity activity results in greater calorie burn, leading to significant fat reduction. Exercise intensity affects the magnitude of the post-activity metabolic rate increase more than the duration of the exercise. Therefore, the physical activity intensity should always be increasing, as the insufficiently active and/or sedentary individual is not able to perform at the beginning of training a high-intensity activity to produce a prolonged increase in post-physical activity energy expenditure.27 Physical activity intensity is a key factor to achieve better outcomes, both in physical conditioning and reduction body fat. Thus, the intensity of the programmed physical activity may be an explanation for the difference of what occurred between the SG and CG, and this intensity was effective in reducing body fat in the SG.
This study demonstrated a significant increase in LM between the pre- and post-intervention periods in both genders in the SG, and remained without a significant difference in the CG. Hardy et al.28 showed that a strength training program may be included in the treatment of adolescents with excess weight, as they result in a reduction of FM. Probably the result observed in the SG was a consequence of the development of muscle strength activity, with a significant increase in LM. This increase in LM was possibly influenced by the muscle strength workout of upper and lower limbs with increased load. Therefore, muscle strength activity may be associated with the positive effect that the programmed physical activity had on LM, directly, which is in accordance with the previous literature results.29
WC is an indicator of visceral and subcutaneous adiposity and presents a strong correlation with the individual predisposition to diseases such as diabetes and cardiovascular disease. A significant decrease in WC was observed in the SG and male gender. This result is probably related to the different functional and morphological characteristics of the male gender and the fact that they are more physically active.
As expected, and as a consequence of the results observed in body composition variables, a significant decrease in the frequency of excess weight was observed only in the SG.
Studies on the effects of physical activity intervention on body composition (weight, FM index, skinfolds, %BF, FM, and waist) should be interpreted with caution, as the assessment of the nutritional status using these indices during puberty has shown morphological differences between the genders, mainly during the sexual maturation stage. Changes in body mass may be typical of a certain stage of maturation and not the result of dietary intake and physical activity levels. These indices, although they do not indicate body composition, are easy to measure, and the wide availability of data on body height and weight, in addition to their association with morbidity and mortality, justifies their use as an indicator of nutritional status in epidemiological studies.30
Gonçalves et al.30 emphasize that, for epidemiologists, body composition changes have environmental explanations, “as, in recent times, it is very unlikely that substantial changes have occurred in the genetic characteristics of populations, while changes in their habits of life appear to have been huge.”
Better adherence to physical activity at school, rather than alone or in gyms, can result in favorable stimuli to the overall health of children/adolescents through more effective programs with more ambitious targets that stimulate these young individuals to overcome obstacles to attain a healthier adulthood, with fewer health problems related to excess weight.
Therefore, it can be concluded that, in the SG, the regular practice of programmed physical activity, with frequency, duration, and intensity control, conducted during the school year, resulted in a significant reduction of body fat in post-pubertal adolescents.
FundingCNPq (Conselho Nacional de Desenvolvimento Científico e Tecnológico) – process n. 475959/2010-8.
Conflicts of interestThe authors declare no conflicts of interest.
Please cite this article as: Farias ES, Gonçalves EM, Morcillo AM, Guerra-Júnior G, Amancio OM. Effects of Programmed physical activity on body composition in post-pubertal schoolchildren. J Pediatr (Rio J). 2015;91:122–9.


