
To estimate the prevalence of the perception of eating more than one should and the associated factors in adolescents, and to analyze differences in dietary indicators according to the perception of overeating.
MethodsThis is a cross-sectional population-based study with a sample of 912 adolescents, participants of a food consumption survey conducted in 2015–2016, in Campinas, SP, Brazil.
ResultsThe prevalence of the perception of eating more than one should was 35.0%, and higher in those who declared themselves non-white, those who had excess weight, those who had high waist circumference, those who would like to change their weight, those who did something to lose weight, and those who evaluated themselves as fat. The prevalence rates were also higher in those who perceived the quality of their diet as poor, who had higher frequencies of consumption of sweets, soft drinks, cold meats, and lower frequencies of consumption of fruits, raw vegetables, and breakfast up to three times a week. Among those who considered themselves as overeating, higher intakes of energy, carbohydrate, protein, fat, added sugar, and sodium were observed, and prevalence rates of 38.5% for overweight and 66.2% for obesity were identified.
ConclusionThe perception of eating more than one should was associated with unhealthy eating practices, the self-assessment of a poor quality diet, dissatisfaction with weight, and inadequate nutritional status. There is a need for further studies to investigate the application of the question “Do you think that you eat more than you should?” as a health behavior indicator.
Excess weight is a complex and multifactorial condition, resulting from changes in lifestyle that lead to increased energy intake and reduced levels of physical activity.1,2 The consumption of ultra-processed food products with high energy density and low nutrient content, changes in the food production and marketing system,the globalization of food culture, and marketing strategies that encourage the consumption of food products and devalue the act of food selection and preparation constitute part of the factors to which the strong growth of excess weight prevalence has been attributed.1–7
Data from the National School Health Survey (Pesquisa Nacional de Saúde do Escolar [PeNSE], 2015) indicated a prevalence of overweight and obesity of 23.7% and 7.8%, respectively, as well as a high intake of ultra-processed foods such as sweets/candy, soft drinks, cold meats, snacks, and cookies, among others.8 In Brazil, the consumption of ultra-processed foods accounted for 25.4% of household-acquired calories in 2008–2009.9 Findings from the National Health and Nutrition Examination Survey (NHANES) showed that in 2011–2012, 68.3% of the energy ingested by US adolescents came from ultra-processed products.10
Considering the high prevalence of excess weight, the consumption of ultra-processed food products,8 and the imposition of body standards,11,12 what are the factors associated with the perception of eating more than one should among adolescents?
Excess weight and inadequate eating may lead to a perception of excessive food consumption, but other hypotheses should be considered, such as the influence of one’s dissatisfaction with their weight, family and social relationships, food advertisement, the habit of eating out of home, in addition to eating disorders that are associated to the intense fear of gaining weight.
This study provides data on the perception of excess food consumption in adolescents (10–19 years) from the municipality of Campinas, state of São Paulo (SP), and aimed to estimate the prevalence of the perception of eating more than one should according to sociodemographic variables, health behaviors, dietary practices, nutritional status, self-assessment of weight, and diet quality; and to analyze the differences in dietary indicators according to the perception of overeating.
MethodsInformation from two population-based cross-sectional studies carried out in Campinas, SP, were used: the Inquérito de Saúde de Campinas (ISA Camp 2014–2015) and Inquérito de Consumo Alimentar e Estado Nutricional (ISA Camp-Nutri 2015–2016). The surveys included non-institutionalized adolescents from the urban area of the municipality.
The ISA Camp sample was obtained using a probabilistic cluster sampling technique in two stages: census sector and household. In the first stage, 70 census sectors were selected by drawing lots, with a probability proportional to the size (number of households). In the second stage, a systematic drawing of the households that would constitute the sample was performed, based on the updated field listing of households in the 70 sectors.13
A minimum sample size of 1,000 adolescents was defined, considering an estimated proportion of 0.50, with a confidence level of 95% when determining the confidence intervals, sampling error between 4% and 5%, and design effect of 2.The expected average number of adolescents per household (person/household ratio) was calculated considering the 2010 census data, and then the number of households required for the interviews was obtained by dividing the sample size by the person/household ratio.Predicting a non-response rate of 27% losses/refusals, 2,898 households were selected to reach the minimum sample size. The predicted non-response rate was determined based on the results of the previous survey carried out in Campinas and the households were selected by systematic drawing of lots from the updated field listing. All adolescent residents were interviewed in each household.13
The ISA Camp-Nutri is attached to the ISA Camp, and is conducted during the second home visit. The same individuals who participated in the ISA Camp survey were asked to answer a questionnaire that assessed food consumption and nutritional status.
The interviews were initiated by administering the 24 -hrecall (R24 h), according to the standardized multiple-pass method (MPM) procedures. The MPM organizes the completion of the R24 h forms into five steps, aiming to stimulate the respondent's memory and increase the accuracy of the information.14
The R24 h was applied with the support of a photographic manual.15 Foods/food preparations were recorded in units and home measures, and subsequently quantified in grams or milliliters with the aid of home measurement tables,16,17 food labels, and customer services. The data were entered into the Nutrition Data System for Research (NDS-R) software (NCC, version 2015, University of Minnesota, USA) by trained and supervised dietitians.
The field was visited on different days of the week by a team of trained interviewers.
The ISACamp-Nutri questionnaire was entered using a data mask developed with the software EpiData (EpiData Assoc. version 3.1 – Odense, Denmark). After data entry, the consistency analysis of the databases was performed.
Study variablesDependentThe perception of overeating, derived from the question “Do you think you eat more than you should?” with two possible answers: no or yes.
IndependentDemographic and socioeconomic variables: gender (male; female), age range (10–12; 13–14; 15–19 years), self-reported ethnicity/skin color (white; non-white), whether they attended school (no; yes, public; yes, private), head of household’slevel of schooling (0–7; 8–11; ≥12 years of schooling), and per capita household income (<1.0; ≥1.0 to <2.0; ≥2.0 minimum wages).
Nutritional status: body mass index (BMI) calculated with data from self-reported weight and measured height, considering that adolescents tend to underestimate height.18 This measurement was obtained through a portable stadiometer, with a retractable measuring tape, 210 cm in length and with 0.1 cm accuracy, according to the procedures defined by the Ministry of Health.19 The BMI was classified as low weight (<3rd percentile), normal weight (≥3rd and ≤85th percentile), overweight (>85th and ≤97th percentile), or obesity (>97th percentile).20 Waist circumference was measured twice, using an inextensible 205 cm measuring tape with 0.5 cm accuracy. The midpoint between the lower border of the last rib and the iliac crest was measured.19 The mean of both measurements was calculated, and the values were classified in tertiles, considering the distribution observed by gender and age.
Health-related behaviors: Do you do something to lose weight (yes; no), time spent watching television (0–1; 2–3; ≥4 h/day), frequency of weekly consumption of sweets, soda, cold meats, milk, beans, raw green vegetables, and fruits (0–2; 3–4; ≥5 times); and breakfast during the week (0–3; 4–6; 7 times).
Self-assessment of weight, diet quality, and whether one would like to change their weight: the self-assessment variables were obtained from the questions: “Regarding your weight, do you consider yourself?” with seven response options that were grouped into thin (very thin, a little thin, or thin), normal, or fat (a little fat, fat, or very fat); “How do you consider the quality of your food? Do you think it is?” with five response possibilities, categorized as very good/good, normal, or bad/very bad. The variable ‘would you like to change your weight’ was created based on the questions “Would you like to change your weight?” (no or yes) and “Would you like to gain or lose weight?” (no; yes, gain; yes, lose).
A set of dietary indicators was also selected to investigate the association between food consumption and the perception of eating more than one should:
Dietary indicators: energy (kcal), carbohydrates (g), protein (g), animal and vegetable protein (g), fats (g), saturated and trans-fat (g), dietary fiber (g), added sugars (g), sodium (mg), and glycemic load – glucose as reference (g). The indicators were derived from the information of the R24 h.
Data analysisInitially, the prevalence of the perception of eating more than one should was estimated according to the independent variables, whose associations were verified by Pearson’s chi-squared test, with a significance level of 5%. Crude and adjusted prevalence ratios and their respective 95% confidence intervals (95% CI) were also calculated.Then, the means of dietary indicators were calculated according to the perception of overeating, using generalized linear models, adjusted by the underreporting of energy intake, gender, and age. The equation proposed by Kelly et al.21 was used to identify the percentage of underreporting: (energy intake - estimated energy requirements [EER]/EER) × 100. The calculation of the energy requirements was based on the Institute of Medicine formulas that consider the following variables: gender, age, weight, height, and level of physical activity.22 The models considered the distributions that best fit the data of the food consumption variables, identified by applying graphic techniques and the Akaike information criterion (AIC).
Ethical proceduresThe ISA Camp (CAAE:37303414.4.0000.5404), the ISA Camp-Nutri (CAAE: 26068214.8.0000.5404), and this studyproject (CAAE: 06755518.7.0000.5404) were approved by the Research Ethics Committee of Universidade Estadual de Campinas. For adolescents younger than 18 years old, an informed consent was signed by a parent or guardian.
ResultsOf the 1,023 adolescents evaluated at ISACamp, 109 refused to participate in the ISACamp-Nutri and two did not answer the study question of interest. Therefore, the question “Do you think you eat more than you should?” was answered by 912 adolescents, with a mean age of 14.6 years 95% CI: 14.4–14.8). The dietary indicators were estimated based on data from 903 R24 h responses (89.0% of the R24 h responses comprised food intake from Monday to Friday).
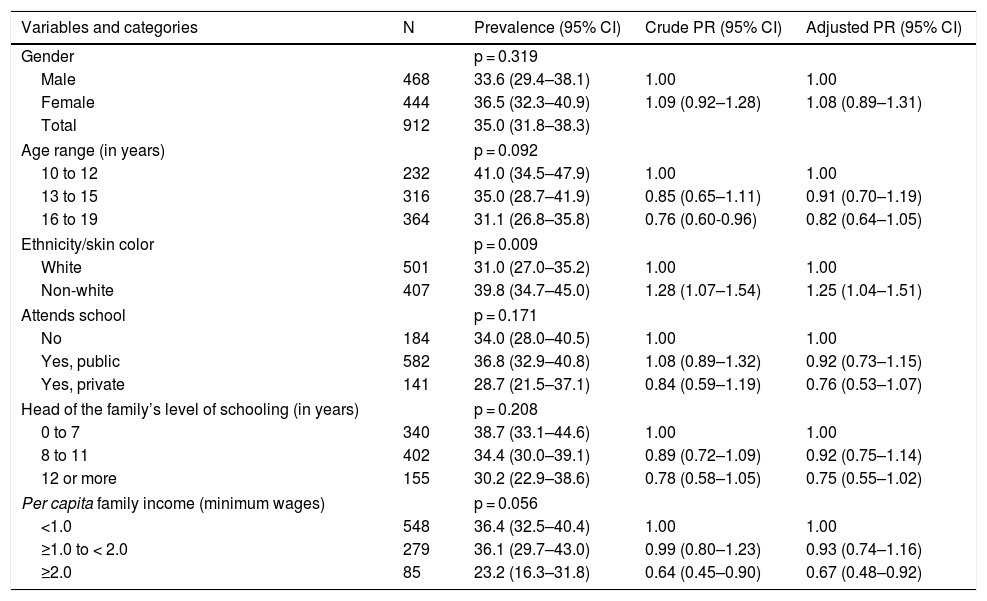
The prevalence of the perception of eating more than one should was 35.0% for the assessed population, which was higher in adolescents who declared themselves non-white, and lower among those in the per capita income stratum ≥2 minimum wages (Table 1).
Prevalence and prevalence ratio of the perception of eating more than one should, according to sociodemographic variables in adolescents aged 10–19 years. Food Consumption Survey of Campinas, SP (Inquérito de Consumo Alimentar de Campinas, ISA Camp-Nutri), 2015–2016.
| Variables and categories | N | Prevalence (95% CI) | Crude PR (95% CI) | Adjusted PR (95% CI) |
|---|---|---|---|---|
| Gender | p = 0.319 | |||
| Male | 468 | 33.6 (29.4–38.1) | 1.00 | 1.00 |
| Female | 444 | 36.5 (32.3–40.9) | 1.09 (0.92–1.28) | 1.08 (0.89–1.31) |
| Total | 912 | 35.0 (31.8–38.3) | ||
| Age range (in years) | p = 0.092 | |||
| 10 to 12 | 232 | 41.0 (34.5–47.9) | 1.00 | 1.00 |
| 13 to 15 | 316 | 35.0 (28.7–41.9) | 0.85 (0.65–1.11) | 0.91 (0.70–1.19) |
| 16 to 19 | 364 | 31.1 (26.8–35.8) | 0.76 (0.60-0.96) | 0.82 (0.64–1.05) |
| Ethnicity/skin color | p = 0.009 | |||
| White | 501 | 31.0 (27.0–35.2) | 1.00 | 1.00 |
| Non-white | 407 | 39.8 (34.7–45.0) | 1.28 (1.07–1.54) | 1.25 (1.04–1.51) |
| Attends school | p = 0.171 | |||
| No | 184 | 34.0 (28.0–40.5) | 1.00 | 1.00 |
| Yes, public | 582 | 36.8 (32.9–40.8) | 1.08 (0.89–1.32) | 0.92 (0.73–1.15) |
| Yes, private | 141 | 28.7 (21.5–37.1) | 0.84 (0.59–1.19) | 0.76 (0.53–1.07) |
| Head of the family’s level of schooling (in years) | p = 0.208 | |||
| 0 to 7 | 340 | 38.7 (33.1–44.6) | 1.00 | 1.00 |
| 8 to 11 | 402 | 34.4 (30.0–39.1) | 0.89 (0.72–1.09) | 0.92 (0.75–1.14) |
| 12 or more | 155 | 30.2 (22.9–38.6) | 0.78 (0.58–1.05) | 0.75 (0.55–1.02) |
| Per capita family income (minimum wages) | p = 0.056 | |||
| <1.0 | 548 | 36.4 (32.5–40.4) | 1.00 | 1.00 |
| ≥1.0 to < 2.0 | 279 | 36.1 (29.7–43.0) | 0.99 (0.80–1.23) | 0.93 (0.74–1.16) |
| ≥2.0 | 85 | 23.2 (16.3–31.8) | 0.64 (0.45–0.90) | 0.67 (0.48–0.92) |
n, number of adolescents in the unweighted sample; 95% CI, 95% confidence interval; Crude PR, crude prevalence ratio; Adjusted PR, adjusted prevalence ratio by gender, age, and body mass index; p, p-value of the chi-squared test.
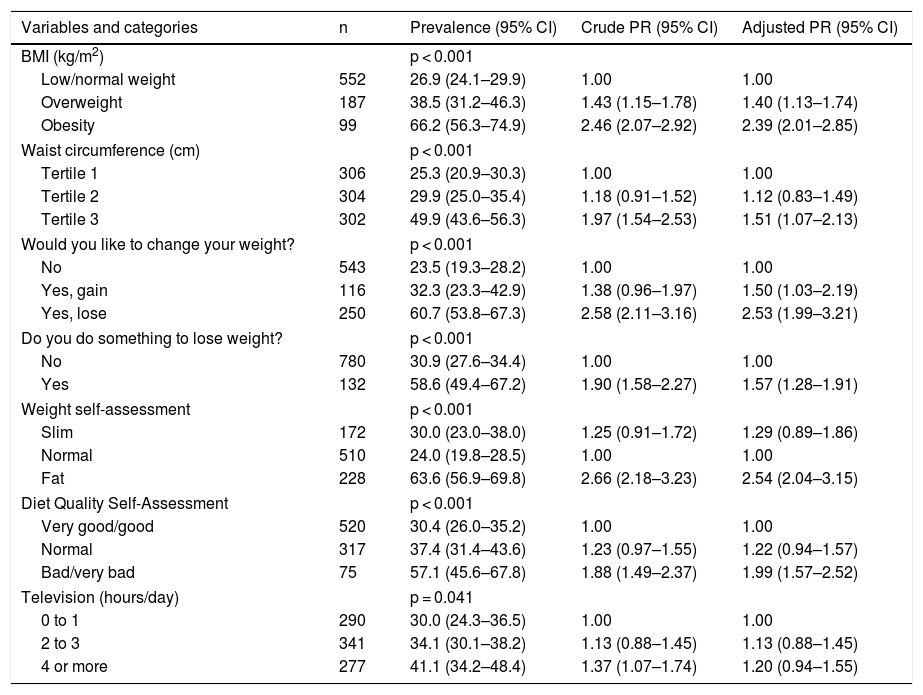
The overweight or obese adolescents with higher waist circumference, who wanted to gain or lose weight, and those who did something to lose weight had higher prevalence rates of overeating perception. Among those who considered themselves fat, the prevalence of eating more than they should was 2.5 times higher than in those who considered their weight to be normal.
A higher prevalence rate was also observed in those who self-rated the quality of their diet as poor or very poor (Table 2).
Prevalence and prevalence ratio of the perception of eating more than one should, according to nutritional status, health behaviors, weight perception, and diet quality variables in adolescents aged 10–19 years.Food Consumption Survey of Campinas, SP (Inquérito de Consumo Alimentar de Campinas, ISA Camp-Nutri), 2015–2016.
| Variables and categories | n | Prevalence (95% CI) | Crude PR (95% CI) | Adjusted PR (95% CI) |
|---|---|---|---|---|
| BMI (kg/m2) | p < 0.001 | |||
| Low/normal weight | 552 | 26.9 (24.1–29.9) | 1.00 | 1.00 |
| Overweight | 187 | 38.5 (31.2–46.3) | 1.43 (1.15–1.78) | 1.40 (1.13–1.74) |
| Obesity | 99 | 66.2 (56.3–74.9) | 2.46 (2.07–2.92) | 2.39 (2.01–2.85) |
| Waist circumference (cm) | p < 0.001 | |||
| Tertile 1 | 306 | 25.3 (20.9–30.3) | 1.00 | 1.00 |
| Tertile 2 | 304 | 29.9 (25.0–35.4) | 1.18 (0.91–1.52) | 1.12 (0.83–1.49) |
| Tertile 3 | 302 | 49.9 (43.6–56.3) | 1.97 (1.54–2.53) | 1.51 (1.07–2.13) |
| Would you like to change your weight? | p < 0.001 | |||
| No | 543 | 23.5 (19.3–28.2) | 1.00 | 1.00 |
| Yes, gain | 116 | 32.3 (23.3–42.9) | 1.38 (0.96–1.97) | 1.50 (1.03–2.19) |
| Yes, lose | 250 | 60.7 (53.8–67.3) | 2.58 (2.11–3.16) | 2.53 (1.99–3.21) |
| Do you do something to lose weight? | p < 0.001 | |||
| No | 780 | 30.9 (27.6–34.4) | 1.00 | 1.00 |
| Yes | 132 | 58.6 (49.4–67.2) | 1.90 (1.58–2.27) | 1.57 (1.28–1.91) |
| Weight self-assessment | p < 0.001 | |||
| Slim | 172 | 30.0 (23.0–38.0) | 1.25 (0.91–1.72) | 1.29 (0.89–1.86) |
| Normal | 510 | 24.0 (19.8–28.5) | 1.00 | 1.00 |
| Fat | 228 | 63.6 (56.9–69.8) | 2.66 (2.18–3.23) | 2.54 (2.04–3.15) |
| Diet Quality Self-Assessment | p < 0.001 | |||
| Very good/good | 520 | 30.4 (26.0–35.2) | 1.00 | 1.00 |
| Normal | 317 | 37.4 (31.4–43.6) | 1.23 (0.97–1.55) | 1.22 (0.94–1.57) |
| Bad/very bad | 75 | 57.1 (45.6–67.8) | 1.88 (1.49–2.37) | 1.99 (1.57–2.52) |
| Television (hours/day) | p = 0.041 | |||
| 0 to 1 | 290 | 30.0 (24.3–36.5) | 1.00 | 1.00 |
| 2 to 3 | 341 | 34.1 (30.1–38.2) | 1.13 (0.88–1.45) | 1.13 (0.88–1.45) |
| 4 or more | 277 | 41.1 (34.2–48.4) | 1.37 (1.07–1.74) | 1.20 (0.94–1.55) |
n, number of adolescents in the unweighted sample; 95%CI, 95% confidence interval; Crude PR, crude prevalence ratio; Adjusted PR, adjusted prevalence ratio by gender, age, and body mass index; p, p-value of the chi-squared test.
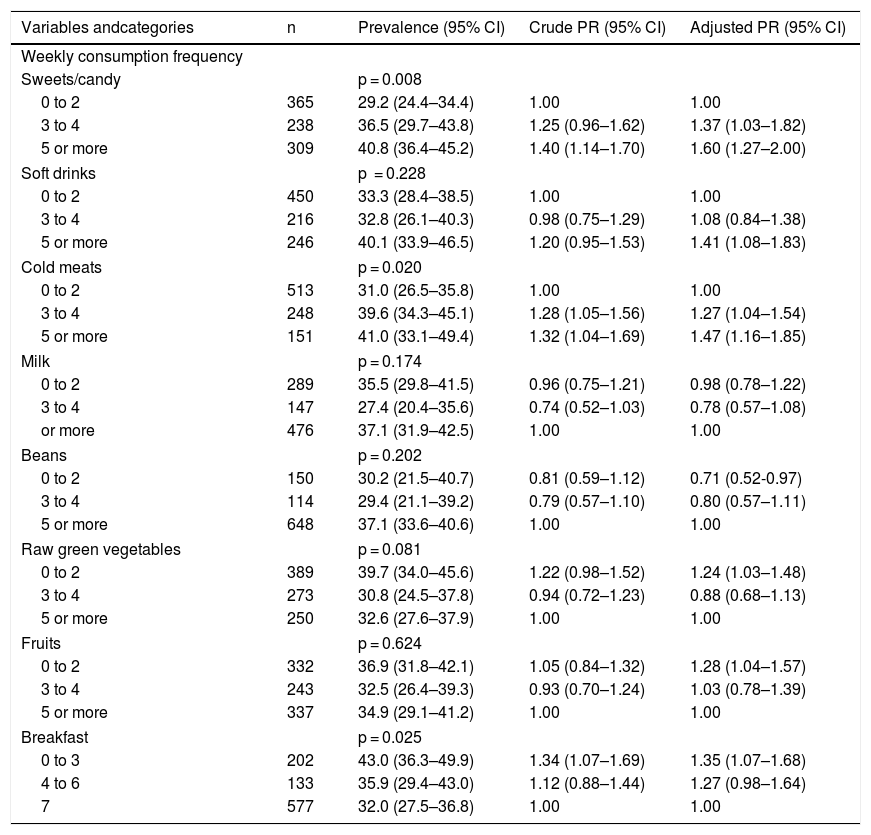
The perception of overeating was higher among adolescents with higher frequencies of weekly consumption of sweets/desserts, cold meats (≥3 times), soft drinks (≥5 times), as well as those with lower frequencies of consumption of raw vegetables and fruits. (≤2 times) and breakfast (≤3 times). For those who ate beans up to twice a week, there was a lower prevalence of the perception of eating more than one should (Table 3).
Prevalence and prevalence ratio of the perception of eating more than one should, according to eating practices in adolescents from 10 to 19 years old. Food Consumption Survey of Campinas, SP (Inquérito de Consumo Alimentar de Campinas, ISA Camp-Nutri), 2015–2016.
| Variables andcategories | n | Prevalence (95% CI) | Crude PR (95% CI) | Adjusted PR (95% CI) |
|---|---|---|---|---|
| Weekly consumption frequency | ||||
| Sweets/candy | p = 0.008 | |||
| 0 to 2 | 365 | 29.2 (24.4–34.4) | 1.00 | 1.00 |
| 3 to 4 | 238 | 36.5 (29.7–43.8) | 1.25 (0.96–1.62) | 1.37 (1.03–1.82) |
| 5 or more | 309 | 40.8 (36.4–45.2) | 1.40 (1.14–1.70) | 1.60 (1.27–2.00) |
| Soft drinks | p = 0.228 | |||
| 0 to 2 | 450 | 33.3 (28.4–38.5) | 1.00 | 1.00 |
| 3 to 4 | 216 | 32.8 (26.1–40.3) | 0.98 (0.75–1.29) | 1.08 (0.84–1.38) |
| 5 or more | 246 | 40.1 (33.9–46.5) | 1.20 (0.95–1.53) | 1.41 (1.08–1.83) |
| Cold meats | p = 0.020 | |||
| 0 to 2 | 513 | 31.0 (26.5–35.8) | 1.00 | 1.00 |
| 3 to 4 | 248 | 39.6 (34.3–45.1) | 1.28 (1.05–1.56) | 1.27 (1.04–1.54) |
| 5 or more | 151 | 41.0 (33.1–49.4) | 1.32 (1.04–1.69) | 1.47 (1.16–1.85) |
| Milk | p = 0.174 | |||
| 0 to 2 | 289 | 35.5 (29.8–41.5) | 0.96 (0.75–1.21) | 0.98 (0.78–1.22) |
| 3 to 4 | 147 | 27.4 (20.4–35.6) | 0.74 (0.52–1.03) | 0.78 (0.57–1.08) |
| or more | 476 | 37.1 (31.9–42.5) | 1.00 | 1.00 |
| Beans | p = 0.202 | |||
| 0 to 2 | 150 | 30.2 (21.5–40.7) | 0.81 (0.59–1.12) | 0.71 (0.52-0.97) |
| 3 to 4 | 114 | 29.4 (21.1–39.2) | 0.79 (0.57–1.10) | 0.80 (0.57–1.11) |
| 5 or more | 648 | 37.1 (33.6–40.6) | 1.00 | 1.00 |
| Raw green vegetables | p = 0.081 | |||
| 0 to 2 | 389 | 39.7 (34.0–45.6) | 1.22 (0.98–1.52) | 1.24 (1.03–1.48) |
| 3 to 4 | 273 | 30.8 (24.5–37.8) | 0.94 (0.72–1.23) | 0.88 (0.68–1.13) |
| 5 or more | 250 | 32.6 (27.6–37.9) | 1.00 | 1.00 |
| Fruits | p = 0.624 | |||
| 0 to 2 | 332 | 36.9 (31.8–42.1) | 1.05 (0.84–1.32) | 1.28 (1.04–1.57) |
| 3 to 4 | 243 | 32.5 (26.4–39.3) | 0.93 (0.70–1.24) | 1.03 (0.78–1.39) |
| 5 or more | 337 | 34.9 (29.1–41.2) | 1.00 | 1.00 |
| Breakfast | p = 0.025 | |||
| 0 to 3 | 202 | 43.0 (36.3–49.9) | 1.34 (1.07–1.69) | 1.35 (1.07–1.68) |
| 4 to 6 | 133 | 35.9 (29.4–43.0) | 1.12 (0.88–1.44) | 1.27 (0.98–1.64) |
| 7 | 577 | 32.0 (27.5–36.8) | 1.00 | 1.00 |
n, number of adolescents in the unweighted sample; 95% CI, 95% confidence interval; Crude PR, crude prevalence ratio; Adjusted PR, adjusted prevalence ratio by gender, age, and body mass index; p, p-value of the chi-squared test.
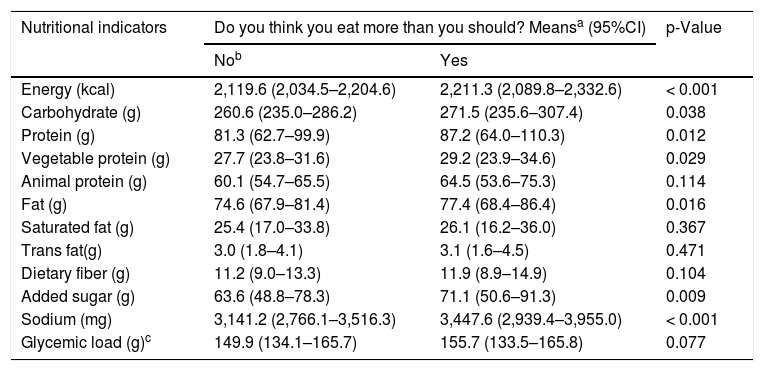
Table 4 shows a higher intake of energy, carbohydrates, total protein, vegetable protein, total fat, added sugar, and sodium by adolescents who considered they overate when compared to those who did not.
Means of food consumption indicators according to the perception of eating more than one should in adolescents. Food Consumption Survey of Campinas, SP (Inquérito de Consumo Alimentar de Campinas, ISA Camp-Nutri), 2015–2016.
| Nutritional indicators | Do you think you eat more than you should? Meansa (95%CI) | p-Value | |
|---|---|---|---|
| Nob | Yes | ||
| Energy (kcal) | 2,119.6 (2,034.5–2,204.6) | 2,211.3 (2,089.8–2,332.6) | < 0.001 |
| Carbohydrate (g) | 260.6 (235.0–286.2) | 271.5 (235.6–307.4) | 0.038 |
| Protein (g) | 81.3 (62.7–99.9) | 87.2 (64.0–110.3) | 0.012 |
| Vegetable protein (g) | 27.7 (23.8–31.6) | 29.2 (23.9–34.6) | 0.029 |
| Animal protein (g) | 60.1 (54.7–65.5) | 64.5 (53.6–75.3) | 0.114 |
| Fat (g) | 74.6 (67.9–81.4) | 77.4 (68.4–86.4) | 0.016 |
| Saturated fat (g) | 25.4 (17.0–33.8) | 26.1 (16.2–36.0) | 0.367 |
| Trans fat(g) | 3.0 (1.8–4.1) | 3.1 (1.6–4.5) | 0.471 |
| Dietary fiber (g) | 11.2 (9.0–13.3) | 11.9 (8.9–14.9) | 0.104 |
| Added sugar (g) | 63.6 (48.8–78.3) | 71.1 (50.6–91.3) | 0.009 |
| Sodium (mg) | 3,141.2 (2,766.1–3,516.3) | 3,447.6 (2,939.4–3,955.0) | < 0.001 |
| Glycemic load (g)c | 149.9 (134.1–165.7) | 155.7 (133.5–165.8) | 0.077 |
The findings of this study indicate that 35.0% of adolescents reported eating more than they should. Higher prevalence rates of this perception were found in the overweight subgroups, those ingesting healthy foods at a lower weekly frequency and more frequently ingesting unhealthy foods, in those who evaluated themselves as fat, and those with a poor quality diet. The analysis of dietary indicators showed higher intake of energy, carbohydrates, protein, fat, added sugar, and sodium among those who considered they overate.
The adolescents who self-declared as non-white had a higher perception of eating more than they should. A survey of the adult population (≥18 years old) showed differences between white and non-white ethnicity (black or brown), levels of schooling, intake of fruits and vegetables, beans, whole milk, and meats with excess fat.23
In Brazilian students, after adjusting for age and maternal education, it was observed that black and mixed-race individuals ingested more sweets/candies and beans, andperceived themselves as less fat compared to whites.24 A study with US adolescents found that blacks were 82% more likely than whites to not achieve any of the four recommended behaviors (daily, ≥5 servings of fruits/vegetables, ≥1 h of physical activity, ≤2 h screen time, and not consuming sugary beverages).25
The prevalence of self-rated overeating was lower in adolescents with higher income. In Brazil, data from the 2008–2009 POF indicated higher per capita energy availability 1,817 kcal/day among households in the fifth quintile of income distribution, derived from a pattern of food consumption characterized by higher acquisition of fruits, green vegetables, milk and dairy products, red meat,cold meats, ready meals, soft drinks, and lower acquisition of rice, beans, tuberous vegetables, and table sugar.26 According to PeNSE in 2015, the prevalence of the daily consumption of at least one ultra-processed food was higher in adolescents whose mothers had a higher level of schooling (40.3%), those who attended private schools, and those with the highest index of consumer goods, an indicator that included having a computer, a car, a home with internet access, and a maid.27
In Campinas, SP, a study with normal-weight adolescents identified a prevalence of 43.7% for dissatisfaction with body weight, higher in girls and in those who had more household devices at home; the desire to lose weight was reported by 16.8% and 47.5% of girls living in households with ≤7 and ≥16 household devices, respectively.11
PeNSE (2012) results on body image show that students from private schools considered themselves fatter/very fat compared to those attending public schools.28 Another study found that the adoption of extreme weight loss practices was higher among students who considered themselves to be overweight, who more frequently used medication and laxatives/vomiting induction than the slim students or those who considered their weight to be adequate.12
These results show that the segments with better socioeconomic status have greater access to poor nutritional quality foods, but also have greater concern with weight gain, which could explain the higher prevalence of the perception that they eat more than they should in the higherincome subgroup.
In this study, adolescents with excess weight with higher waist circumference measures had a higher prevalence of the perception of overeating. This shows that many can associate nutritional status to food intake, but it should be noted that approximately 60.0% of overweight adolescents and 34.0% of obese adolescents did not consider they ate more than they should. Obesity is a result of the imbalance between energy intake and expenditure; however, it is a multifactorial chronic disease determined by socioeconomic, environmental, genetic, behavioral, and psychological conditions.29,30
A review study found that high glycemic index carbohydrates trigger addiction-like neurochemical responses and contribute to the development of obesity.31 For many people, eating foods high in sugars and fats relieves stress; known as “comfort foods,” they are associated with mood enhancement and reduced plasma cortisol concentrations.32 An obesogenic environment, which among other characteristics promotes access to ultra-processed foods, may explain why many overweight/obese adolescents do not consider their food intake to be excessive.
It was found that 63.6% of those who perceived they overate also self-rated as fat, a percentage similar to that found among the obese (66.2%). Regarding the self-assessment of food quality, 57.1% of those who overate reported that their diet was poor. A study with adolescents from Cuiabá, state of Mato Grosso (MT), found that 46.0% of those with the poorest diet (Diet Quality Index-Revised below the 75th percentile) perceived their diet as poor. Also, the authors observed that 47.0% of those who were overweight self-rated the quality of their diet as poor.33 These findings show a coherence between the perception of eating more than one should with excess weight, indicated by BMI, waist circumference, and self-image, and diet quality assessed as poor.
As for the eating practices of those who considered they overate, there was a higher frequency of the consumption of sweets, soft drinks, and cold meats, and lower frequencies of the consumption of raw vegetables and fruits, and of having breakfast. According to PeNSE in 2009, 34.6% of Brazilian schoolchildren had an unhealthy eating pattern, characterized by more frequent consumption of cookies, candies, soft drinks, fried salty foods, cold meats, and chips,and less frequent consumption of vegetables, fruits, milk, and beans; another 37.7% had a mixed pattern, showing similar frequencies of the consumption of these foods.34 These results indicate that adolescents’ diets differ from the recommendations of the Food Guide3 and that may reflect the changing process in the Brazilian dietary pattern, characterized by the ongoing replacement of fresh foods by ultra-processed foods.9
In the study by Rodrigues et al.,33 the self-perception of diet quality as excellent/good was associated with the consumption of fruits and vegetables (≥5 times/week), the knowledge of healthy eating, and the mixed pattern, characterized by the consumption of pasta, fish, eggs, fruits, green and tuberous vegetables, indicating that these food groups are recognized as part of a healthy diet.
In the present study, an association between overeating and the self-rating of the diet quality as poor was observed, raising the hypothesis that the perception of excessive consumption is related to a nutritionally unbalanced diet, with a lower amount of fresh/minimally processed foods and a higher amount of ultra-processed food products.
In Brazil, the individual dietary intake of vegetables is insufficient (46.1 g/day) and it is even worse among those who eat mostly ultra-processed foods.35 Studies indicate an association between the consumption of ultra-processed foods and the reduction in the consumption of fresh/minimally processed foods.36,37 In the city of Rio de Janeiro, state of Rio de Janeiro, an intervention study found that the increase in the household purchase of soft drinks and cookies resulted in an almost four-fold lower odds ratio of acquiring fruits and vegetables.37
Beans constitute a traditional Brazilian food and they are considered strong and hearty, which gives one the feeling of satiety and sustenance, according to popular representations.38 It is likely that the lower prevalence of the perception of eating more than oneshould among adolescents who ate beans up to two times a week can be partly explained by the feeling of satiety produced by this legume.
A cohort study with students from Rio de Janeiro found that 26.0% did not have breakfast regularly (<5 times/week) and 9.6% skipped this meal; it also identified a higher prevalence of overweight among girls (40.3%; p < 0.001) who did not eat breakfast regularly.39 In the present study, the perception of overeating among adolescents who ate breakfast less frequently (≤3 times) may be justified by a long period of fasting, with possible food intake compensation atthe other meals.
Higher energy, carbohydrate, total protein, vegetable protein, fat, added sugar, and sodium intake were observed among adolescents who considered they ate more than they should. Studies show that adolescents recognize that fruits and vegetables are part of a healthy diet, while candy/sweets, snacks, chips, fast food, and processed foods are often referred to as being unhealthy.40,41
Food products such as cookies, snacks, candy/sweets, and fast-food are high in energy, sugar, salt, and fat, and are commonly ingested in excess by adolescents.42
The present authors are not aware of publications that focused on the question “Do you think you eat more than you should?” which made it difficult to compare and interpret the observed findings. Further studies are needed to investigate the use of this question to confirm and validate the results found in the study, as well as to verify if the “eating more than one should” indicator can differentiate the segments of adolescents that are more vulnerable to the adoption of unhealthy behaviors.It is also necessary to analyze the accuracy of the question “Do you think that you eat more than you should?” by comparing it with objective measures of food consumption and nutritional status, e.g., comparing the amount consumed with the individual energy requirement and anthropometric measurements,such as BMI, waist circumference, and waist-to-height ratio.
Among the limitations of the study, the cross-sectional design of the ISACamp-Nutri makes it impossible to interpret associations as cause-and-effect results. The use of self-reported weight data is a limitation; however, one study found a high correlation (r > 0.90) between the reported weight and measured weight in adolescents from the city of São Paulo.18 The sampling design without a household drawing of lots could yield biased estimates, due to the fact that all adolescents in the household were interviewed. However, Alves et al.43 compared the efficiency and accuracy of health surveys that used or did not use the household drawing of lots and observed that the bias was negligible and that the design without drawing lots showed a higher precision and lower cost.
Among the strengths, the authors highlight the use of information from a population-based survey that aimed to investigate the dietary pattern and nutritional status of a sample of adolescents from Campinas, SP, allowing the analysis of new indicators, such as the question “Do you think you eat more than you should?” Another strength is related to the standardization of the procedures for collecting, quantifying, and entering food consumption data.
ConclusionThe perception of eating more than one should was higher in overweight adolescents, among those who did something to lose weight, those who were dissatisfied with their weight, those who ate healthy foods less frequently and unhealthy foods more frequently, and those who had breakfast up to three times a week. Many overweight/obese adolescents did not report overeating.These results can be used in educational approaches to fight obesity among adolescents. It also highlights the need for future studies to investigate the application of the question “Do you think you eat more than you should?” as a health behavior indicator.
FundingFundação de Amparo à Pesquisa do Estado de São Paulo (FAPESP) providing ISACamp 2014–2015 (process No. 2012/23324-3) and ISACamp-Nutri 2015–2016 studies (process No. 2013/16808-7).
Conflicts of interestThe authors declare no conflicts of interest.
To Coordenação de Aperfeiçoamento de Pessoal de Nível Superior (CAPES) for the Master’s Degree scholarship granted to S.D.L. Carvalho.
Please cite this article as: Carvalho SD, Barros-Filho AA, Barros MB, Assumpção D. Do you think that you eat more than you should? Perception of adolescents from a Brazilian municipality. J Pediatr (Rio J). 2020;97:66–74.


