
To correlate different methods of body composition assessment in overweight or obese schoolchildren, using deuterium oxide (D2O) dilution as a reference.
MethodsPercentage of total body water (%TBW), fat free mass (%FFM), and body fat (%BF) were assessed by D2O and tetrapolar electrical bioimpedance analysis (BIA) in 54 obese and overweight students aged 6–9 years. Skinfold thickness (ST), body mass index (BMI), conicity index (CI), waist circumference (WC), waist-to-height ratio (WHtR), and waist-to-hip (WHR) ratio were also used.
ResultsMean values for body composition were 38.4%±8.4% BF, 44.9%±6.1% TBW and 61.6%±8.4% FFM. There was no significant difference in body weight, body fat mass (FM), TBW, and FFM between genders. Regarding D2O, ST underestimated %BF, and overestimated %FFM in both genders (p<0.05). BIA overestimated %TBW in the group as a whole and in males (p<0.05). The only positive and strong correlations occurred in females regarding the WC (σ=0.679), CI (r=0.634), and WHtR (r=0.666).
ConclusionsIn this sample of obese and overweight children, there were strong correlations between body composition measured by D2O and some indices and anthropometric indicators in females, but there was no positive and strong correlation of fat tissue with the indices/indicators at all ages and in both genders.
Correlacionar diferentes métodos para avaliação de composição corporal em escolares diagnosticados com sobrepeso e obesos, utilizando-se como referência a diluição de óxido de deutério (D2O).
MétodosO percentual de água corporal total (%ACT), massa livre de gordura (%MLG) e gordura corporal (%GC) foram obtidos pelo D2O e bioimpedância elétrica tetrapolar (BIA), em 54 estudantes com sobrepeso e obesos, com idade entre 6-9 anos. O método das dobras cutâneas (DC) utilizando-se triciptal e panturrilha, índice de massa corporal (IMC), índice de conicidade (IC), circunferência de cintura (CC), relação cintura/estatura (RCE) e relação cintura/quadril (RCQ) também foram utilizados.
ResultadosOs valores médios para composição corporal aferidos pelo D2O foram 38,4±8,4%GC, 44,9±6,1%ACT e 61,6±8,4%MLG. Não houve diferença significativa entre o peso corporal, massa corporal de gordura (MG), ACT e MLG entre os sexos. Considerando o D2O, DC subestimou o %GC e superestimou o %MLG em ambos os sexos (p<0,05). BIA superestimou %ACT no grupo como um todo e no masculino (p<0,05). As únicas correlações fortes e positivas ocorreram no grupo feminino nas variáveis CC (σ=0,679), IC (r=0,634) e RCE (r=0,666).
ConclusõesNesta amostra de crianças obesas e com sobrepeso, houve fortes correlações entre a composição corporal mensurada pelo D2O e alguns índices e indicadores antropométricos nas meninas, mas nenhuma correlação forte e positiva do tecido adiposo foi encontrada com os índices/indicadores em todas as idades e ambos os sexos.
High levels of body fat are associated with increased morbidity, and overweight and obesity definitions are associated with health risks.1 As childhood obesity has become an epidemic worldwide, studies performed in several regions of Brazil have demonstrated the marked increase of overweight and obesity in childhood and adolescence.2,3
Normally, body composition is used as an important nutritional indicator, allowing the division of body weight into components, specifically lean body mass or fat-free mass FFM-(muscle, bone, and water) and body fat mass (FM).4
To assess the body composition of an individual, the total body water (TBW) can be measured through the ingestion of a dose of labeled water and, subsequently, FFM and FM are calculated using hydration coefficients.5 Evidence demonstrates a growing interest in the use of isotopes in research activities aimed at nutritional and metabolic status, mainly in children.6
Isotopic dilution with deuterium oxide (D2O) is the standard technique for measuring TBW, and is most commonly used to measure TBW in children.7 Body composition characterization using D2O offers important advantages when compared to other methods, as it is innocuous to humans and can be used in pregnant women, children, and the elderly, with no clinical consequences. Very small amounts of material are required for the sample, which is particularly advantageous in pediatric use.8
The aim of this study was to correlate different methods usually employed in clinical practice for assessing body composition, specifically in schoolchildren aged between 6 and 9 years diagnosed with overweight and obesity, using deuterium oxide (D2O) dilution as the reference method. Among the methods used, body mass index (BMI), waist circumference (WC), waist-to-height ratio (WHtR), waist-to-hip ratio (WHR), conicity index (CI), skinfold thickness (ST), and tetrapolar bioelectrical impedance analysis (BIA) were analyzed.
Materials and methodsStudy site and populationThis study was approved by CEPES/UFSJ-CCO (Comitê de Ética em Pesquisa/Universidade Federal de São João del Rei – Campus Centro Oeste), Edict No. 265,272, according to the current norms of the Post-Graduate Program in Health Sciences, UFSJ-CCO.
Data were obtained from a study of prevalence of overweight and obesity, registered under No. 5533p2 in the Brazilian Registry of Clinical Trials (Registro Brasileiro de Ensaios Clínicos [ReBEC]), in a sample of 1564 school children aged 6–9 years (full years) enrolled in public schools, from the first to the fifth year of elementary school. A total of 1019 children were evaluated; those who were in the BMI percentile range≥85 or ≥95, according to gender and age, were classified as overweight or obese, respectively.9 The prevalence of overweight and obesity was 11.6%,10 which is equivalent to 119 children, characterizing the subset of data that comprised the initial study sample.
Exclusion criteria included children who refused to participate in the study, failure to submit the informed consent signed by parents and/or guardians, those with infectious diseases, balance disorders, and history of brain surgery, as the data collected were also part of a study that evaluated the results of a physical activity program on biochemical variables. On the collection day, students who did not follow the previous recommendations (such as those who fasted less than eight hours or who participated in strenuous physical activity in the previous 24h) were also excluded.
Data collectionAll assessments were performed in the morning in a private room where anthropometric and body composition parameters were obtained. Measurements were conducted by previously trained evaluators.
Body weight was measured using a digital electronic scale (BF-683W; Tanita® – IL, USA) with a maximum capacity of 150kg and precision of 100g, according to the techniques recommended by Jellife in 1968.11 Height was measured using a mobile vertical anthropometer (ALTUREXATA® – BH, Brazil) graded in centimeters up to 2.13m and with precision of 0.1cm.
A two-meter long, flexible, inelastic anthropometric tape, divided into centimeters and subdivided into millimeters, was used to measure waist (WC) and hip (HC) circumference. The individual remained in the orthostatic position and all measures occurred in the horizontal plane, taking care not to compress soft tissues. WC was obtained during normal expiration, using the midpoint between the last rib and the iliac crest as reference, and the HC measurement was obtained using the widest point of the hip at the level of the greater trochanter of the femur as reference.
To carry out the measurement of triceps (TSF) and calf skinfold (CSF) that were used in the equations proposed by Slaughter et al.,12 a skinfold caliper was used (Lange Skinfold Caliper – MI, USA) with a scale of 0–60mm and precision of ±1mm.12 All measurements were performed on the right side of the body, in triplicate, considering the arithmetic mean value as representative of the region. The TSF was measured on the posterior part of the right arm (vertical direction), at midpoint between the scapula acromion and the ulna olecranon. The CSF was measured on the medial side of the right leg (vertical direction) at the point of maximum circumference of the calf, with the knee and hip flexed to 90°. The equation proposed by Slaughter et al.13 was used to calculate %BF. The equation FFM=body weight−FM proposed by Barbosa-Cortés et al.14 was used to calculate the absolute value of the FFM, and its result was multiplied by 100 and divided by the body weight value to obtain the %FFM.
BIA variables were obtained using the horizontal tetrapolar BIA equipment (Quadscan 4000; Bodystat – Isle of Man, British Isles).
The plateau protocol15 was used for body composition measurement through the isotope dilution of deuterium oxide (D2O). Standard doses of 2g, 3g, and 4g of deuterium oxide were administered to children weighing 20–30kg, 30–50kg, and 50–70kg, respectively, with doses distributed in individual vials and administered orally to every child. The basal saliva sample was collected after an eight-hour fast. Subsequently, the diluted D2O solution was offered. The second sample was collected three hours after the administration of the diluted dose (post-dose).
Based on the fundamental principle of dilution, concentration and volume of D2O present and measured in saliva are correlated before and after dose ingestion, disclosing the total body water volume, which provides a calculation of FFM, using the specific hydration coefficients.
All samples were stored at −20°C and sent to the Mass Spectrometry Laboratory of the Department of Clinical Medicine at Faculdade de Medicina de Ribeirão Preto of Universidade de São Paulo, for laboratory analyses.
Statistical analysisAll data were coded and stored using SPSS statistical software (IBM Corp. Released 2011. IBM SPSS Statistics for Windows, version 20.0. NY, USA). Descriptive results were obtained through central trend (mean and median) and dispersion measures (standard deviation).
The analytical statistics was initially performed through univariate analysis, with a 95% confidence interval and a significance level of 5%. The Shapiro–Wilk test was used to verify the normal distribution of variables. Student's t and Mann–Whitney tests were used to compare, respectively, variables (FM, TBW, or FFM) with normal or non-normal distribution in the independent groups.
ANOVA was used to compare independent variables and Tukey's test was used to identify the variables of cause.
Pearson's correlation coefficient (r) and Spearman's rho (σ) were used to evaluate the correlation, respectively, of variables with normal or non-normal distribution between %BF measured by deuterium method and anthropometric indexes/variables, qualitatively evaluated according to the criteria established by Callegari-Jacques.16
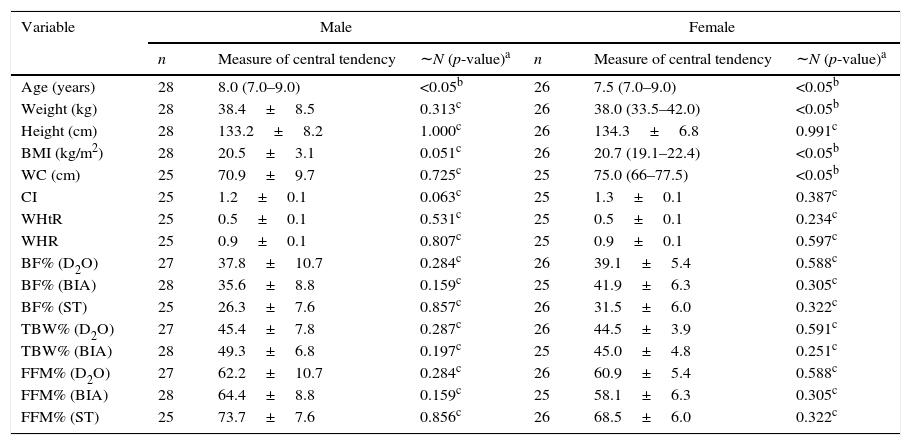
ResultsOf the 79 children who agreed to participate and were initially included in the study, 54 individuals (28 boys and 26 girls) comprised the final sample, due to losses incurred during data collection and analysis. Both groups (pre- and post-loss) statistically maintained similar anthropometric characteristics (p=0.682). Except for age, weight, BMI, and CI, all other individuals in this total sample showed normal distribution. Table 1 shows the data distribution. Median age and BMI in the group were eight years and 20.3kg/m2, respectively.
Description of the study variables of schoolchildren aged 6–9 years with overweight and obesity.
| Variable | Male | Female | ||||
|---|---|---|---|---|---|---|
| n | Measure of central tendency | ∼N (p-value)a | n | Measure of central tendency | ∼N (p-value)a | |
| Age (years) | 28 | 8.0 (7.0–9.0) | <0.05b | 26 | 7.5 (7.0–9.0) | <0.05b |
| Weight (kg) | 28 | 38.4±8.5 | 0.313c | 26 | 38.0 (33.5–42.0) | <0.05b |
| Height (cm) | 28 | 133.2±8.2 | 1.000c | 26 | 134.3±6.8 | 0.991c |
| BMI (kg/m2) | 28 | 20.5±3.1 | 0.051c | 26 | 20.7 (19.1–22.4) | <0.05b |
| WC (cm) | 25 | 70.9±9.7 | 0.725c | 25 | 75.0 (66–77.5) | <0.05b |
| CI | 25 | 1.2±0.1 | 0.063c | 25 | 1.3±0.1 | 0.387c |
| WHtR | 25 | 0.5±0.1 | 0.531c | 25 | 0.5±0.1 | 0.234c |
| WHR | 25 | 0.9±0.1 | 0.807c | 25 | 0.9±0.1 | 0.597c |
| BF% (D2O) | 27 | 37.8±10.7 | 0.284c | 26 | 39.1±5.4 | 0.588c |
| BF% (BIA) | 28 | 35.6±8.8 | 0.159c | 25 | 41.9±6.3 | 0.305c |
| BF% (ST) | 25 | 26.3±7.6 | 0.857c | 26 | 31.5±6.0 | 0.322c |
| TBW% (D2O) | 27 | 45.4±7.8 | 0.287c | 26 | 44.5±3.9 | 0.591c |
| TBW% (BIA) | 28 | 49.3±6.8 | 0.197c | 25 | 45.0±4.8 | 0.251c |
| FFM% (D2O) | 27 | 62.2±10.7 | 0.284c | 26 | 60.9±5.4 | 0.588c |
| FFM% (BIA) | 28 | 64.4±8.8 | 0.159c | 25 | 58.1±6.3 | 0.305c |
| FFM% (ST) | 25 | 73.7±7.6 | 0.856c | 26 | 68.5±6.0 | 0.322c |
n, sample size; ∼N, normal distribution; BMI, body mass index; WC, waist circumference; CI, conicity index; WHtR, waist-to-height ratio; WHR, waist-to-hip ratio; BF%, body fat percentage; D2O, deuterium oxide; BIA, Bioimpedance; ST, skinfold thickness; TBW%, total body water percentage; FFM%, fat-free mass percentage.
The percentage of total body water (%TBW) obtained by D2O method and BIA were significantly different (ANOVA, α=0.05). Differences in this variable were significant for the group as a whole (44.9% vs. 47.6%) and for the male gender (45.4% vs. 49.3%) but not for females.
The %FFM measured through D2O and ST also differed significantly (p<0.05) in the total sample (61.6% vs. 71.1%), in males (62.2% vs. 73.7%), and in females (60.9% vs. 68.5). Significant differences were not verified between the means of %FFM using the D2O and BIA methods.
The %BF obtained by D2O in the group as a whole was 38.4%±8.4% (37.8%±10.7% and 39.1%±5.4% in males and females, respectively). When the %BF measured by D2O, BIA and ST methods were compared, there were significant differences (p<0.05) between the means in D2O and ST, either in the group as a whole (38.4% vs. 29.3%), in the males (37.8% vs. 26.3%), and in females (39.1% vs. 31.5%). There was no significant difference in %BF measured by the BIA and D2O methods.
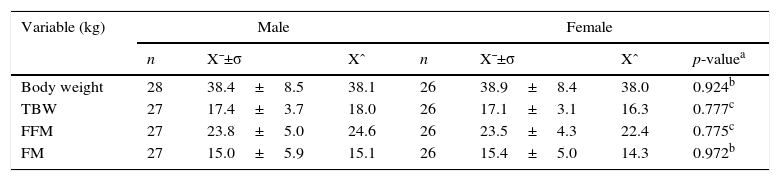
Table 2 shows the absolute values of body weight, height, TBW, FFM, and FM measured by D2O, considering gender.
Distribution of absolute values of body composition variables obtained by D2O method, according to gender.
| Variable (kg) | Male | Female | |||||
|---|---|---|---|---|---|---|---|
| n | X¯±σ | Xˆ | n | X¯±σ | Xˆ | p-valuea | |
| Body weight | 28 | 38.4±8.5 | 38.1 | 26 | 38.9±8.4 | 38.0 | 0.924b |
| TBW | 27 | 17.4±3.7 | 18.0 | 26 | 17.1±3.1 | 16.3 | 0.777c |
| FFM | 27 | 23.8±5.0 | 24.6 | 26 | 23.5±4.3 | 22.4 | 0.775c |
| FM | 27 | 15.0±5.9 | 15.1 | 26 | 15.4±5.0 | 14.3 | 0.972b |
n, sample size; X¯, sample mean; σ, standard deviation; Xˆ, Median; TBW, total body water; FFM, fat-free mass; FM, fat mass.
There was no statistically significant difference between body weight and FM between the genders (p=0.924 and p=0.972, respectively). TBW and FFM did not significantly differ, either (p=0.777 and p=0.775, respectively).
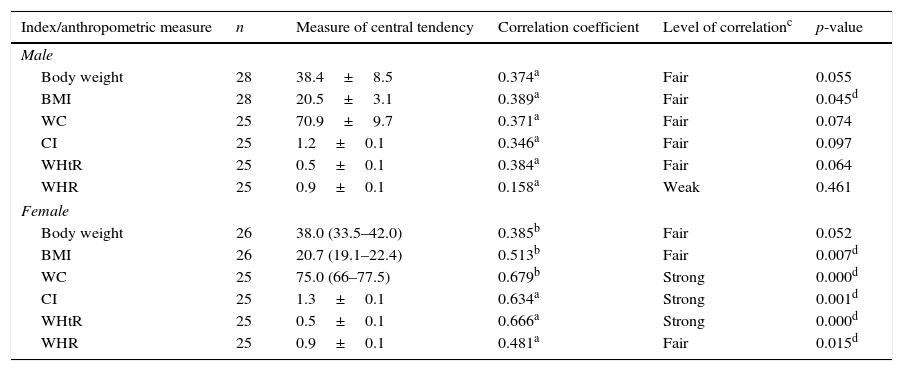
Table 3 shows the correlation of %BF by D2O, with the anthropometric indices and measurements. Fair but significant correlations (p<0.05) were observed in the group as a whole between the %BF, body weight (σ=0.385), BMI (σ=0.445), and CI (σ=0.549). Similar results were found between %BF, WC (r=0.440), and WHtR (r=0.463).
Comparisons between body fat percentage measured by deuterium oxide dilution with the anthropometric indices and measurements in schoolchildren aged 6–9 years with overweight and obesity.
| Index/anthropometric measure | n | Measure of central tendency | Correlation coefficient | Level of correlationc | p-value |
|---|---|---|---|---|---|
| Male | |||||
| Body weight | 28 | 38.4±8.5 | 0.374a | Fair | 0.055 |
| BMI | 28 | 20.5±3.1 | 0.389a | Fair | 0.045d |
| WC | 25 | 70.9±9.7 | 0.371a | Fair | 0.074 |
| CI | 25 | 1.2±0.1 | 0.346a | Fair | 0.097 |
| WHtR | 25 | 0.5±0.1 | 0.384a | Fair | 0.064 |
| WHR | 25 | 0.9±0.1 | 0.158a | Weak | 0.461 |
| Female | |||||
| Body weight | 26 | 38.0 (33.5–42.0) | 0.385b | Fair | 0.052 |
| BMI | 26 | 20.7 (19.1–22.4) | 0.513b | Fair | 0.007d |
| WC | 25 | 75.0 (66–77.5) | 0.679b | Strong | 0.000d |
| CI | 25 | 1.3±0.1 | 0.634a | Strong | 0.001d |
| WHtR | 25 | 0.5±0.1 | 0.666a | Strong | 0.000d |
| WHR | 25 | 0.9±0.1 | 0.481a | Fair | 0.015d |
BMI, body mass index; WC, waist circumference; CI, conicity index; WHtR, waist-to-height ratio; WHR, waist-to-hip ratio.
A fair, but significant correlation was observed between %BF and BMI (r=0.389) among boys.
Fair correlations between %BF by D2O, BMI (r=0.513), and WHR (r=0.481) were found in the female gender. Moreover, strong and significant correlations (p<0.05) were observed in this group between %BF, WC (σ=0.679), CI (r=0.634), and WHtR (r=0.666).
DiscussionThe %BF obtained by D2O in this study was greater than that described by Deurenberg et al., cited by Filho17 in a study using skinfolds of 378 children and adolescents to define excess of body fat (20% and 25% for boys and girls, respectively). Therefore, this sample of children aged 6–9 years classified as obese or overweight had excess body fat. None of the anthropometric indices/measurements used in this study positively and strongly correlated with the amount of adipose tissue at all ages and in both genders, which calls for precautions regarding their exclusive and definitive use for the diagnosis of excess body fat.
TBW was significantly different when measured by BIA and D2O, which potentiates misdiagnosis regarding body hydration. Resende et al.18 also found significant differences in the %TBW in obese adolescents when measured by D2O and tetrapolar BIA, with an overestimation of the values obtained by BIA.
While in this study no significant differences in %FFM were found between D2O and BIA, a study by Resende et al.,19 with obese adolescents and mean age of 11.2±0.9 years, also using tetrapolar bioimpedance, found significantly higher (overestimation) FFM values measured by BIA when compared to D2O.
The ST method with two skinfold measures and equations proposed by Slaughter et al.13 underestimated the measurement of %BF, which would lead to the misinterpretation of reduced health risks associated with excess body fat in these individuals. However, according to Himes,20 skinfold measurements usually show better correlation with total body fat than BMI.
BIA was efficient to measure the %BF and %FFM, but not to measure the %TBW. In the study by Lazzer et al., which assessed overweight and obese adolescents, cited by Himes,20 bipedal BIA underestimated the overall %BF by 2–3%. Camarneiro et al.,21 in their study with obese adolescents, showed a poor correlation between FFM and TBW obtained by tetrapolar BIA compared to D2O, but a strong correlation with FM.
BIA prediction equations vary depending on the reference population from which they are derived and different equations may also yield different body fat estimates. Consequently, although the measurements are performed with good reliability, biases resulting from prediction equations and their adaptations to the studied population are a concern regarding BIA.20
Body weight and BMI showed a significant positive correlation, but only a fair one with %BF measured at D2O in the group as a whole. Escott-Stump22 stated that BMI is not a useful indicator in childhood to be used as a screening tool, as it does not reflect body composition. Freedman and Sherry23 stated that changes in weight and height that occur during the growth process (ages between 5 and 18 years) result in substantial increases (50%) in BMI, which further complicates the interpretation of this index in children and adolescents.
The WHR was not reliable when compared to %BF measured by the reference method, but the WC, CI, and WHtR showed strong and positive correlations in the female gender, demonstrating they are good indicators of high body fat in this group. In multiple regression models, WC was also found to be better than BMI to predict insulin resistance, blood pressure, serum cholesterol and triglyceride levels, especially in adolescents, according to a study published by Himes.20
According to Oliveira et al.,24 WC has been used in outpatient care to assess fat deposition in the abdominal area of children and adolescents, as this single variable has shown a better association with metabolic changes than the waist–hip circumference ratio (WHR).
In this study, the mean value corresponding to the WC in the group as a whole showed to be higher than the cutoff of 71cm, recommended as a limit for the occurrence of health risks.25 However, 24 individuals (44.4%) had a lower WC value than the cutoff, 16 (29.6%) with %BF>33%, an important cutoff value for cardiovascular risk recommended by ABESO (Associação Brasileira para o Estudo da Obesidade e Síndrome Metabólica)25 measured by DEXA (Dual Energy X-ray Absorptiometry) in the study by Higgins et al.26 with children aged 4–11 years. Therefore, the exclusive use of the WC could lead to a false-negative risk assessment.
Additionally, six individuals (11.1%) had WC below the proposed cutoff points for detection of high fat mass in the trunk (adjusted for age/gender),27 but with %BF higher than the cutoff point used in this study, also potentially characterizing false negative results.
According to CI cutoff points used for excess fat identification recommended by Sant’Anna et al.28 in their study with children aged 6–9 years old, four individuals (7.4%) had acceptable values, but with %BF higher than that recommended in this study as borderline, adjusted by gender/age, which can also characterize false negative results.
The mean values of WHtR in the group as a whole showed to be slightly higher than the cutoff of 0.50cm, which is the threshold for health risk in individuals of both genders after the age of six, according to a study carried out by McCarthy and Ashwell (2006) that evaluated 8135 children and adolescents.29 However, 15 children (27.8%) showed a lower WHtR than this value and a higher %BF than the reference used in this study, which could result in false negative results if it were the only variable assessed.
Freedman and Sherry23 affirm that the skinfold and circumference measurements require additional training and may be difficult to standardize. The information provided by these measures in children with excess weight is actually inexact.
All individuals showed a %TBW below 50% of body weight. Overweight or obese children potentially have less TBW, probably justified by higher FM and %BF. Kliegman et al.30 reported that the greater amount of fat in overweight children causes a reduction in the TBW as a percentage of body weight.
Study limitations include the analysis of a subset of data from a study with cross-sectional design, which does not translate into any conclusions about causal associations and does not allow comparisons with other studies with identical design, methodology, and population.
The results of in this study suggest considering the use of indexes and anthropometric measurements, skinfold thickness, and bioimpedance as tools for the definitive diagnosis of overweight and obesity in children, as there was no absolute agreement of any of the techniques at all age ranges in both genders.
More studies are clearly necessary in this age range of the population, especially on the viability of greater use of the D2O method for body composition assessment, considered a reference for the measurement of TBW in children, as it requires smaller sample quantity and is innocuous to humans, with no risks or clinical consequences.
Conflicts of interestThe authors declare no conflicts of interest.
The authors would like to thank CAPES (Coordenação de Aperfeiçoamento de Pessoal de Nível Superior) for financial support. They also thank the Post-Graduate Program in Health Sciences of Universidade Federal de São João del Rei, for the financial and institutional support, through its professionals and teachers, particularly to Professor Gilberto Fontes, who contributed with important suggestions for the article.
Please cite this article as: Bila WC, de Freitas AE, Galdino AS, Ferriolli E, Pfrimer K, Lamounier JA. Deuterium oxide dilution and body composition in overweight and obese schoolchildren aged 6–9 years. J Pediatr (Rio J). 2016;92:46–52.


