
To evaluate the prevalence of abnormalities in plasma lipid and glucose profiles among overweight and obese children and adolescents, and to assess the presence of a correlation between body mass index Z-scores and indicators of comorbidities related to both profiles.
MethodsThis was a multicenter cross-sectional study conducted at two outpatient clinics. The study included all 417 comers for the first visit from 2008 to 2012, aged between 7 and 18 years, with BMI above the Z-score +1. Anthropometry and blood sampling were obtained. The prevalence of dyslipidemias, hyperglycemia, and insulin resistance were evaluated, together with the correlations of these variables with the increase of Z-BMI.
ResultsDyslipidemia was observed in 43.4% of the boys and 66.1% of the girls, with no difference between genders. High glucose levels were detected in 6.2% of the individuals. Insulin resistance was present in 32.3% and 41.7% of the cases, with no statistical significance between boys and girls. Correlations between the Z-BMI were noted for triglycerides in the entire group and among girls; for HDL-c, only among girls; for glucose, a correlation was observed for the entire group, but not when stratified by gender. The indicators of insulin resistance were all correlated with Z-BMI, even when corrected for age.
ConclusionsOverweight and obesity give origin to a high prevalence of dyslipidemia and insulin resistance. BMI Z-scores showed a weak positive correlation with glucose and triglyceride, and negative with HDL-c. In turn, the strongest positive correlation was found with insulin resistance indicators.
Avaliar a prevalência de anormalidades nos perfis lipídico e glicêmico entre crianças e adolescentes com sobrepeso e obesidade e também verificar se existe correlação entre os escores-z de índice de massa corporal (z-IMC) e indicadores de comorbidades ligados a esses perfis.
MétodosEstudo de corte transversal multicêntrico, incluiu 417 pacientes com idades entre 7 e 18 anos e IMC acima do escore-z>+1, que fizeram a consulta de caso novo entre 2008 e 2012. Antropometria e coleta de sangue foram realizadas. As prevalências de dislipidemia, hiperglicemia e resistência insulínica foram avaliadas, juntamente com as correlações entre essas variáveis e o z-IMC.
ResultadosDislipidemia foi encontrada em 43,4% dos meninos e 66,1% das meninas, sem diferença entre os sexos. Hiperglicemia foi encontrada em 6,2% dos indivíduos. Resistência insulínica esteve presente entre 32,3 e 41,7% dos casos, sem diferença estatística entre os sexos. Foi observada correlação com z-IMC para triglicerídeos quando considerado o grupo todo e entre as meninas; e para HDL-c, apenas entre as meninas. A glicemia apresentou correlação quando considerado o grupo todo, mas não quando separados por sexo. Os indicadores de resistência insulínica estiveram todos correlacionados com IMC, mesmo quando se executou correção para a idade.
ConclusõesSobrepeso e obesidade levam a prevalências elevadas de dislipidemia e resistência insulínica. Os escores z de IMC mostraram discreta correlação positiva com glicose e triglicerídeos e negativa com HDL-c. Por outro lado, correlação positiva mais forte foi observada com os indicadores de resistência insulínica.
The increasing prevalence of obesity in childhood and adolescence demands from researchers and stakeholders in public health the establishment of criteria to prioritize actions to address this problem.1 Different authors have demonstrated the presence of cardiovascular risk factors associated with obesity, especially dyslipidemia2 and insulin resistance3; however, the numbers are quite variable and the prevalence is not yet known.4 For population studies, body mass index (BMI) has been used as indicator that is capable of reflecting body adiposity5; starting from the Z-score of +1, which defines overweight, it may be understood that the higher the value, the more severe the situation.6 In this sense, it is relevant to know not only the prevalence, but also how the comorbidities related to overweight behave as the situation worsens, and what are the differences between boys and girls. Some authors have evaluated this issue. Ricco et al.7 studied 34 overweight and 50 obese subjects aged 6–18 years comparing blood pressure, fasting glucose, second-hour blood glucose, total cholesterol (TC), HDL-c, LDL-c, and triglycerides (TG). Only HDL-c was slightly elevated in overweight patients (p=0.048), demonstrating that, for the parameters evaluated, having a higher BMI did not substantially impact on the comorbidities. Lima et al.8 also found no impact in the lipid profile comparing overweight and obese children and adolescents. In turn, when considered as a continuum (assessed through elevation of BMI Z-scores), different results were observed. Bell et al.9 demonstrated a correlation between increased obesity and acanthosis nigricans, depression, anxiety, headache, muscle pain, and sleep apnea. Correlations with dyslipidemia,10 insulin resistance,11 and steatosis have also been demonstrated.12
This study intended to evaluate the prevalence of abnormalities in plasma lipid and glucose profiles among overweight and obese children and adolescents, and to assess the presence of a correlation between BMI Z-scores and indicators of comorbidities related to both profiles.
MethodsThis was a multicenter cross-sectional study, conducted in two outpatient clinics: the Centro de Estudos em Saúde e Nutrologia Infantojuvenil (at the University of Ribeirão Preto (Cesni) and the Ambulatório de Obesidade Infantojuvenil do Serviço de Nutrologia of the Hospital de Clínicas of the Federal University of Rio Grande do Sul (AmO)). Both are academic services, where data collection follows rigorously standardized methodology. This study was approved by the ethics in research committees of the University of Ribeirão Preto (number 94/2003) and of the Hospital de Clínicas de Porto Alegre (number 07/258).
Inclusion criteria were: all new cases of patients who attended the first visit between January 2008 and December 2012, aged 7–18 years, and with BM above the Z-score +1 (n=489 eligible).
Exclusion criteria were: refusal to sign the informed consent form (n=2); impossibility of performing anthropometry (n=3); type 1 Diabetes mellitus (n=0); hypothyroidism (n=0); inborn errors of metabolism (n=1); impossibility to collect laboratory tests (n=41); special medical conditions, e.g. celiac disease (n=0); use of medical therapies or hormones (n=0); and incomplete data on medical record (n=25). After the criteria were applied, 417 subjects were included in the study, of whom 241 were attended to at Cesni and 176 at AmO.
All subjects were instructed to fast for 12h, and anthropometric data and blood were collected at the time of the patient's first visit. Two 4mL-vials of blood were collected in a recipient containing no additive and sent to the laboratory within 2h for sample processing and biochemical and hormone analysis. The biological material was separated in a Bio Eng centrifuge (Bio Eng®, modelo BR 4000, SP, Brazil) running for 5min at 3500rpm between one and two-and-a-half hours after harvesting (sufficient time for blood clotting). Biochemical insulin was dosed in one of the aliquots on the same day of the collection, by the automated chemiluminescent method in Immulitte DPC Medlab analyzer (Medlab®, SP, Brazil). Glucose was measured by the enzymatic method of hexokinase with Cobas Mira Plus Roche (Roche®, SP, Brazil) automation equipment. The determination of homeostatic model assessment – insulin resistance (HOMA-IR) was done by applying the equation proposed by Matthews et al.13: plasma glucose (mol/dL)×plasma insulin (uUI/mL)/22.5.
Hyperinsulinism was defined as insulin concentration (a marker for insulin resistance) was above 15μU/mL.10 Another diagnostic method for IR was HOMA-IR, considered to be high when greater than 3.16.11 The cut-off values used to define the presence of dyslipidemia and hyperglycemia were13: TC≥150mg/dL; LDL-C≥100mg/dL; HDL-C≤45mg/dL; TG≥100mg/dL; glycemia>99mg/dL.
For statistical analysis, the computer program Graphpad Prism 5 (GraphPad Prism version 7.00 for Windows, CA, USA) was used. Fisher exact test was used for the comparison of frequencies of normal/abnormal values between genders. Simple correlations were assessed by the Spearman's test and multiple regression was used to assess the correlation between the BMI Z-score and insulin and HOMA corrected for age, since these two indicators vary according to the age group.14,15 For all analyses, a significance level of 5% was considered.
ResultsThe mean values for the entire population were: age (years): 11.3 (±0.1); Z-BMI: +2.4 (±0.9); TC (mg/dL): 164.1 (±1.6); LDL-c (mg/dL): 97.7 (±1.5); HDL-c (mg/dL): 46.0 (±0.6); TG (mg/dL): 105.1 (±2.8); glycemia (mg/dL): 87.5 (±0.5); insulinemia (μU/mL): 16.0 (±0.7); and HOMA-IR: 3.5 (±0.2). No differences were observed between boys and girls.
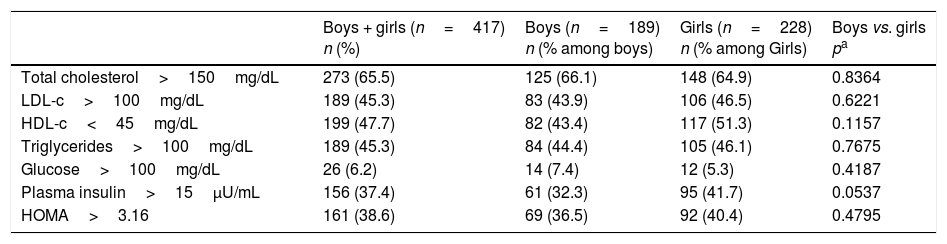
Table 1 depicts the prevalence of abnormal values according to the established cut-offs, as well as gender comparison. The different types of dyslipidemia were quite prevalent, with values between 43.4% and 66.1%; no differences were observed between boys and girls. High glucose levels were the least prevalent alteration among the indicators studied, reaching a maximum of 7.4%, as found among boys, also with no statistical difference between genders. It should be noted that only one subject, a 15-year-old girl, presented glucose levels above 125mg/dL (160mg/dL, not shown in the table). Insulin resistance, as evaluated by the two indicators, plasma insulin and HOMA-IR, was present in 32.3% and 41.7% of the cases, respectively, with no statistical difference between boys and girls.
Prevalence of abnormalities in the indicators studied.
| Boys + girls (n=417) n (%) | Boys (n=189) n (% among boys) | Girls (n=228) n (% among Girls) | Boys vs. girls pa | |
|---|---|---|---|---|
| Total cholesterol>150mg/dL | 273 (65.5) | 125 (66.1) | 148 (64.9) | 0.8364 |
| LDL-c>100mg/dL | 189 (45.3) | 83 (43.9) | 106 (46.5) | 0.6221 |
| HDL-c<45mg/dL | 199 (47.7) | 82 (43.4) | 117 (51.3) | 0.1157 |
| Triglycerides>100mg/dL | 189 (45.3) | 84 (44.4) | 105 (46.1) | 0.7675 |
| Glucose>100mg/dL | 26 (6.2) | 14 (7.4) | 12 (5.3) | 0.4187 |
| Plasma insulin>15μU/mL | 156 (37.4) | 61 (32.3) | 95 (41.7) | 0.0537 |
| HOMA>3.16 | 161 (38.6) | 69 (36.5) | 92 (40.4) | 0.4795 |
LDL-c, low-density lipoprotein cholesterol; HDL-c, high-density lipoprotein cholesterol; HOMA, homeostasis model assessment.
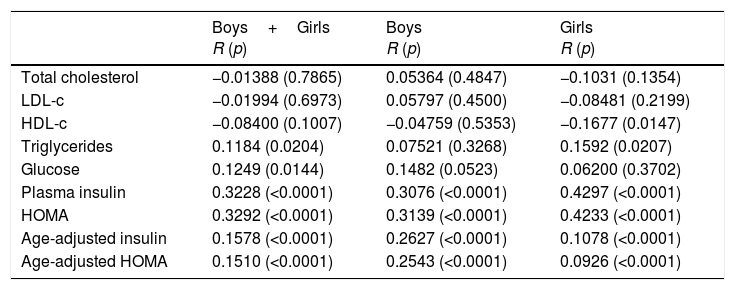
Table 2 depicts the correlations between the BMI Z-scores and the studied indicators. In general, correlations were present but weak. Regarding lipids, a correlation was observed for TG, found in the group as a whole and among girls; for HDL-c, only among girls. Glucose showed correlation for the whole group, but not when separated by gender. In turn, all indicators of insulin resistance were correlated with BMI, even when corrected for age. No statistically significant differences were observed between boys and girls.
Correlation between BMI Z-scores and the indicators studied.
| Boys+Girls R (p) | Boys R (p) | Girls R (p) | |
|---|---|---|---|
| Total cholesterol | −0.01388 (0.7865) | 0.05364 (0.4847) | −0.1031 (0.1354) |
| LDL-c | −0.01994 (0.6973) | 0.05797 (0.4500) | −0.08481 (0.2199) |
| HDL-c | −0.08400 (0.1007) | −0.04759 (0.5353) | −0.1677 (0.0147) |
| Triglycerides | 0.1184 (0.0204) | 0.07521 (0.3268) | 0.1592 (0.0207) |
| Glucose | 0.1249 (0.0144) | 0.1482 (0.0523) | 0.06200 (0.3702) |
| Plasma insulin | 0.3228 (<0.0001) | 0.3076 (<0.0001) | 0.4297 (<0.0001) |
| HOMA | 0.3292 (<0.0001) | 0.3139 (<0.0001) | 0.4233 (<0.0001) |
| Age-adjusted insulin | 0.1578 (<0.0001) | 0.2627 (<0.0001) | 0.1078 (<0.0001) |
| Age-adjusted HOMA | 0.1510 (<0.0001) | 0.2543 (<0.0001) | 0.0926 (<0.0001) |
LDL-c, low-density lipoprotein cholesterol; HDL-c, high-density lipoprotein cholesterol; HOMA, homeostasis model assessment; BMI, body mass index.
Spearman's test and multiple regression for age-adjustment.
Obesity is a complex, multifactorial disease with genetic, epigenetic, and environmental components. Therefore, it is expected that its impact on children's health will be quite variable. It is relevant to know to what extent an increase in excess weight also implies in the onset and worsening of comorbidities. A previous study7 has already demonstrated that, comparing overweight or obese children, there was practically no difference in relation to the parameters evaluated, that is, in a way, comorbidities were already present in the overweight phase. Although the result was important, the simple stratification of overweight children into two categories, overweight and obese, could mask the continuous aspect of the variable, i.e., the model used was not able to demonstrate an occasional correlation between BMI and the evaluated parameters. This study aimed to assess precisely this aspect. As depicted in Table 1, when overweight and obese children are grouped together, the prevalence of comorbidities is quite high. Regardless of gender, almost half of them have some type of dyslipidemia. Elevated LDL-c, which affected 45.3% of them, is highly concerning because of the risk associated with atherosclerosis. In fact, Garcia et al.16 demonstrated in a recent study that even school-age children present thickening of the common carotid intima-media complex, denoting initial atherosclerotic process; Caixe et al.17 also have demonstrated changes in heart geometry in this age group, caused by the increased myocardial effort to overcome high peripheral resistance due to arterial wall thickening. Due to the strong compensatory capacity of the young pancreas, even among children with important insulin resistance, elevated blood glucose levels are not frequent.14,18 In this study, only 6.2% of the sample presented glucose levels above 100mg/dL and only one subject had levels above 125mg/dL. In turn, the presence of insulin resistance was high, found in over one-third of the patients. The two indicators used, plasma insulin and HOMA-IR, both with fixed cut-offs, led to similar results, possibly due to the fact that, as demonstrated by other authors,18 the variable that determines the value of HOMA-IR in children is basically plasma insulin, since little variation occurs in the glucose levels. It is known that peripheral resistance to insulin is highly correlated with metabolic syndrome,2,3 being possibly the triggering element of this condition. Therefore, among the children studied, it is possible to consider that, in addition to the proven dyslipidemia and the high risk for future diabetes (the natural progression of insulin resistance) other aspects such as arterial hypertension, non-alcoholic fatty liver disease, polycystic ovarian syndrome, atherosclerosis, and hyperuricemia, among others, may also be present.19
Recent studies have shown that BMI is the best anthropometric indicator to identify cardiovascular risk factors in children.20 de Onis et al.21 demonstrated that the increase in BMI is accompanied by a reduction in HDL-c and elevation in plasma insulin, HOMA, TG, and LDL-c levels. Bell et al.11 using centile groups, showed an increase in insulin across all centile groups in both sexes. An increase was found for HDL-c but mixed and, differently the present study, sex-discordant results were found for TG and glucose. Skinner et al.10 using large amount of date from NHANEs, also found differences between sexes, with higher values of TC, TG, and glucose between males; using four classes of overweight degrees, they also found higher values of TC, TG, and glucose and lower values of HDL-c among the more obese children. In the present study, the assessment of the correlations between BMI and the indicators studied demonstrated different results for lipid and glucose profiles. Both TC and LDL-C did not show a positive correlation with BMI Z-score. When these data are considered in conjunction with the prevalence of TC and LDL-C above cut-off levels, it can be understood that overweight and obese children are severely affected. Regarding HDL-c, the rationale is practically the same, with the exception that, among girls, a weak negative correlation was observed, indicating that HDL-c tends to be slightly lower the higher the BMI. In general, it is considered that, within the lipid profile, TG is the indicator that changes the most in obese children. Although this was not found in terms of prevalence, a weak positive correlation was observed between Z-BMI and TG, particularly evident among girls.
In the present study, pubertal status was not assessed, as the cut-off values of lipids and glucose are the same for all ages included and the insulinemic profile is more dependent on age than puberty stage.22 Glucose values presented weak positive correlation with BMI, without, however, reaching the cut-off values in most patients. In turn, the indicators of insulin resistance had the strongest correlations among indicators studied; plasma insulin and values of HOMA-IR showed positive correlation with BMI Z-scores. Similar results were demonstrated by Mieldazis et al.18 and Silva et al.23 As previously demonstrated,14,15 plasma insulin and HOMA-IR values are influenced by age, presenting a significant increase with a peak close to the growth spurt. For this reason, multiple regression was conducted only for this indicator, in order to control the results for age and, although the correlation values decreased, they remained statistically significant. It should also be noted that the correlation values for plasma insulin and HOMA-IR are very similar, regardless of controlling for age. This corroborates the fact that, in childhood and adolescence, given the limitations related to the difficulty of evaluating the presence of insulin resistance in the laboratory, if the option is to use one of the two indicators studied, measuring insulin is sufficient, as the HOMA-IR variation basically reflects plasma insulin variation.
The study has some limitations: it was a cross sectional study, which prevents the determination of cause and effect relations. Diet and body compositions were not evaluated. The sample comprised all patients that came for the first consultation at the two centers during the period of the study, but it is not possible to extrapolate the results for the entire population of overweight and obese children and adolescents, as this was a convenience sample.
In conclusion, overweight and obesity lead to high prevalence of dyslipidemia and insulin resistance in boys and girls. BMI Z-scores showed a weak positive correlation with glucose and TG and a negative correlation with HDL-c. In turn, a strong positive correlation was found with insulin resistance indicators, even when adjusted for age.
Conflicts of interestThe authors declare no conflicts of interest.
Please cite this article as: Nogueira-de-Almeida CA, Mello ED. Correlation of BMI Z-scores with glucose and lipid profiles among overweight and obese children and adolescents. J Pediatr (Rio J). 2018;94:308–12.
Study conducted at Universidade Federal de São Carlos (UFSCAR), São Carlos, SP; and Universidade Federal do Rio Grande do Sul (UFRGS), Porto Alegre, RS, Brazil.


