

To describe the frequency and characteristics of adverse drug events in pediatric inpatients in a Brazilian tertiary teaching hospital.
MethodsA cross-sectional study was conducted by retrospective and manual chart review of 240 pediatric admissions to identify adverse drug events using 17 triggers. When triggers were detected in the chart, reviewers investigated the chart in depth to decide whether an event occurred. Consensus about the occurrence of the event was obtained in meeting with a healthcare team. Events were classified by harm category and drugs were classified according to the Anatomical Therapeutic Chemical Classification. Patients who had suffered were compared to those who had not experienced events using the chi-squared test and the Mann–Whitney U test.
ResultsA total of 62 adverse events were found, and 18.8% of the patients had at least one event. Adverse events rates were 25.83 per 100 admissions, 20.27 per 1000 patient-days, 25.94 per 1000 drugs, and 2.12 per 1000 drug doses. All events found were classified as temporary harm, and cardiovascular drugs were most frequently related to events. Groups of patients with and without event were segregated (p<0.05) by the length of stay, number of drugs, and drug doses.
ConclusionThe use of triggers demonstrated its utility in a pediatric setting by identifying harm. Adverse events rates were found to be higher than those of previous studies, but the harm rate was lower than other studies. This study enables the measurement of adverse events in order to define strategies to mitigate or reduce harm.
Descrever a frequência e as características dos eventos adversos a medicamentos em pacientes pediátricos internados em um hospital universitário terciário brasileiro.
MétodosFoi realizado um estudo transversal por meio da análise retrospectiva e manual de prontuários de 240 internações pediátricas para identificar eventos adversos a medicamentos utilizando 17 rastreadores. Quando foram identificados rastreadores no prontuário, os analistas investigaram extensivamente o prontuário para decidir a respeito da existência de um evento. O consenso sobre a ocorrência do evento foi obtido em reunião com uma equipe de profissionais da saúde. Os eventos foram classificados por categoria de dano e os medicamentos foram classificados de acordo com a Classificação Anatômica Terapêutico-Química. Os pacientes que sofreram eventos adventos foram comparados aos que não apresentaram eventos adversos, com o teste qui-quadrado e o teste U de Mann-Whitney.
ResultadosVerificou-se um total de 62 eventos adversos e 18,8% dos pacientes apresentaram ao menos evento. As taxas de eventos adversos foram de 25,83 por 100 internações, 20,27 por 1.000 pacientes/dia, 25,94 por 1.000 medicamentos e 2,12 por 1.000 doses de medicamentos. Todos os eventos encontrados foram classificados como dano temporário e os medicamentos cardiovasculares foram frequentemente associados aos eventos. Grupos de pacientes com e sem eventos apresentaram diferenças (p < 0,05) em relação ao tempo de internação, número e doses de medicamentos.
ConclusãoO uso de rastreadores demonstrou sua utilidade no contexto pediátrico ao identificar danos. As taxas de eventos adversos foram maiores do que as taxas de estudos anteriores, porém a categoria de dano foi menor que em outros estudos. Este estudo possibilita a medição dos eventos adversos a fim de definir estratégias para minimizar ou reduzir os danos.
Risk of an adverse event (AE) is inherent to any healthcare intervention.1 Adverse drug events (ADE) are one of the most common types of AE related to harm during hospitalization.2 Studies show that AE occurs in 30% of hospitalizations, and that 50% of these events are related to drug use.3 ADE is defined as harm experienced by a patient because of exposure to the drug. The definition encompasses both adverse drug reactions (ADR) and medication errors (ME). ADR is not a preventable ADE, and occurs even when medications are used appropriately. In contrast, preventable ADE is classified as an ME, which reaches the patient and causes harm.4
Physiological and developmental differences in children, the need for individual drug dosage based on children's weight, and their inability to communicate complaints can make them more vulnerable to the occurrence of harm in hospital settings.5,6 Nevertheless, the frequency and nature of ADE are less characterized in children compared to the available information on ADE in adult patients.7 Therefore, the identification of the frequency of ADE in pediatric inpatients is essential to prevent or reduce harm, but it remains a challenge in medical institutions, mostly in developing countries. ADE rates in pediatric inpatients range from 6.6 to 49.8 events per 1000 patient-days.8–11
Efforts have been made to encourage patient safety improvement in pediatrics in order to stimulate changes in healthcare practices.5 For this, a robust, efficient, and reliable method is necessary to quantify harm in hospitals and provide evidence of changes in harm rates over time.12 Manual chart review based on triggers is a practical and systematic method to monitor AE in the healthcare of inpatients.13 The trigger is not an AE, but rather is a sign that potentially helps to identify these events.14 To the authors’ knowledge, the trigger approach has been rarely described in scientific literature to estimate ADE frequency in pediatric inpatients in Brazil.
Therefore, this study's objectives were to describe the frequency and characteristics of ADE identified in pediatric inpatients by using triggers.
MethodsDesign, setting, and patientsA cross-sectional study was conducted using triggers by retrospective chart review of pediatric inpatients in order to search for ADE. The study was undertaken in a pediatric department (including a nursery, an emergency room, and a neonatal intensive care unit) of a tertiary teaching hospital with approximately 290 beds in the Center-West Region of Brazil.
The Research Ethics Committee from the Clinical Hospital, Universidade Federal de Goiás – UFG, Brazil, approved the research under protocol No. 1,007,134/2015.
The hospital medication process is based on several phases and starts with handwritten medication orders from physicians, and then orders are transferred to the Pharmacy Department. At this point, drugs are dispensed using an individual dosing system. In this system, drugs are dispensed to the nursery for a 24-hour period and for each patient, as requested by prescription. In addition, multidose drugs (oral fluids) are dispensed as needed by nurses. The nurse team prepares and administers drugs and performs patient monitoring. It is notable that there is no computerized chart in the hospital and all notes are written in a paper chart manually.
The sample was randomly selected from patients’ admissions between January 1st, 2014 and December 31st, 2014, with length of stay at least 48h and age between 2 days and 18 years old. Patient admissions in the hospital without drug prescriptions were not included. Twenty admissions from each month were selected, as recommended by the research tool,15 because the trigger tool is designed for use with a small sample sizes over time. All admissions in 2014 were searched for in the hospitalization control system and categorized by month of admission. The researchers identified all admissions that met selection criteria and each patient admission received a number. Next, a random-number generator strategy was used to select 20 of these numbers by month. Then, the chart corresponding to the number drawn was requested from the medical department archive. When the chart was not recovered after three consecutive requests, another admission was randomly selected to replace it.
During one year of study, 240 admissions were assessed. The parameters for calculating sample size were a population size of 467, with an estimated 7.29% of patients with ADE,10 with a 99.99% confidence level and 5% acceptable margin of error. The sample size calculation was 218.
Retrospective chart review processThe research instrument used in this study was previously adapted and validated to Brazilian hospital settings.16 The instrument includes a list of pediatric-specific triggers (Fig. 1), with their detailed definitions and associated ADE, case examples of harm, and standard data collection forms.15

A pharmacist with clinical experience and a pharmacy student independently performed chart review process, so each one was responsible for the revision of different charts. Reviewers completed an intensive training on the method before starting data collection. A pharmacist from the Patient Safety Department conducted the training sessions using a study manual,15,17 previous works,10,16 and case examples of ADE detection based on triggers. A systematic process of chart review was performed as a pretest with ten charts, for which the trainer had previously known the presence of trigger and ADE. It is important to highlight that the pharmacist reviewer had already reviewed approximately 40 charts in a previous study.
Reviewers applied the chart review method standardized by the research tool15 to evaluate the admissions selected. Charts were evaluated in the following order to search for triggers: laboratory test results, physician orders, nursing, and multidisciplinary team progress notes. If none of the 17 triggers were identified, the reviewer completed the chart review. When one or more triggers were found, reviewers performed in-depth analysis of the chart to verify a possible association between the trigger and ADE occurrence. More than one trigger could be related to a single ADE. The ADE described on a patients’ chart without a relationship to a trigger were also considered. Reviewers collected all medications used by the patient. There was no time limit on chart reviewing.
For each ADE identified, severity was established according to the National Coordinating Council for Medication Error Reporting and Prevention (NCC MERP) index categories from E to I (Supplementary Material). The Micromedex® Solutions (Truven Health Analytics Inc., 2016) database was used as information source for drugs to establish relationships between trigger, drug, and ADE. Preventability was not determined for detected ADE.
After reviewing the charts, the two reviewers met to discuss and organize the data to provide a summary of the possible event and relevant information related to the case. Next, they presented the results to a group of experts with in-person and online meetings. The experts discussed each possible ADE to reach a consensus on whether the ADE occurred or not, and the severity of the harm associated with the event. A nurse, a doctor, and three pharmacists formed the professional team for data evaluation. For enhancement of accuracy of ADE identification and confirmation or rejection of the ADE, the team used a summary of the event identified by the chart reviewers and relevant clinical information on the patient (age, gender, length of stay, diagnoses, and drugs). The following question was used to evaluate the occurrence of an ADE: Can the ADE be associated with the suspected drug, considering its properties, and the patient's clinical condition and temporal relationship between its use and the event?18
Data analysisData were analyzed and statistics were computed using Epi Info™ 3.5.4 (Centers for Disease Control and Prevention, Atlanta, USA) and Stata® 12.0 (StataCorp – College Station, Texas, USA) software packages. The outcomes measured were: (1) ADE per 100 admissions, (2) ADE per 1000 patient-days, (3) ADE per 1000 drugs, (4) ADE per 1000 drug doses, (5) percentage of admissions with ADE (prevalence), (6) severity of harm and (7) number of ADE identified by retrospective review without trigger presence (Supplementary Material). Rates were computed with 95% Poisson confidence intervals (CI). In addition, drugs were described by Anatomical Therapeutic Chemical (ATC) classification, according to first and second level classification.19
Data were analyzed using descriptive statistics, including patient characteristics. Categorical variables were described as absolute frequency and percentage (%). Normal distribution was assessed using the Shapiro–Wilk test for continuous variables. Patient characteristics (variables with non-normal distribution) were described with median and interquartile ranges.
Comparisons between the group of patients with and without ADE were performed using the Pearson's chi-squared test for categorical variables (gender) and the Mann–Whitney U test for continuous variables (age, length of stay, number of drugs, and drug doses) (p<0.05).
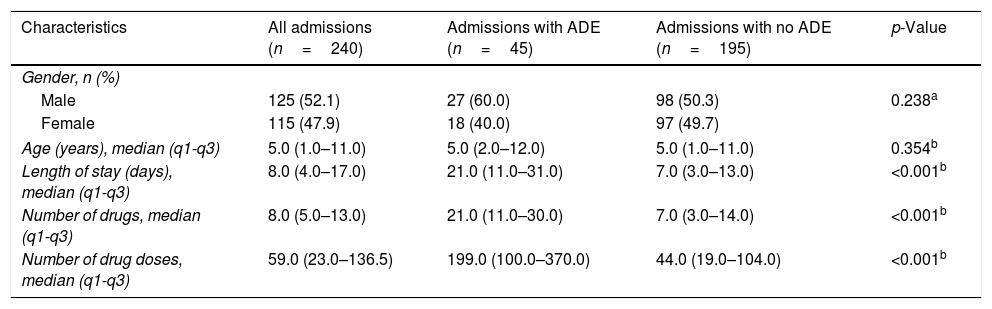
ResultsIn total, 240 admissions were randomly selected for triggers and ADE search, totaling 3079 patient-days. The main patient and hospitalization features are described in Table 1. The study population consisted of 52.1% (n=125) male patients and the median of age was 5.0 years. The length of stay ranged from two to 74 days and the median was 8.0 days. The pediatric inpatients received a median of 8.0 drugs and 59.0 drug doses. Groups of patients with and without ADE were different regarding length of stay, number of drugs, and number of drug doses (p<0.05).
Characteristics of the patient profiles with and without adverse drug event (ADE) at a Brazilian hospital from January 1st to December 31st, 2014 (n=240).
| Characteristics | All admissions (n=240) | Admissions with ADE (n=45) | Admissions with no ADE (n=195) | p-Value |
|---|---|---|---|---|
| Gender, n (%) | ||||
| Male | 125 (52.1) | 27 (60.0) | 98 (50.3) | 0.238a |
| Female | 115 (47.9) | 18 (40.0) | 97 (49.7) | |
| Age (years), median (q1-q3) | 5.0 (1.0–11.0) | 5.0 (2.0–12.0) | 5.0 (1.0–11.0) | 0.354b |
| Length of stay (days), median (q1-q3) | 8.0 (4.0–17.0) | 21.0 (11.0–31.0) | 7.0 (3.0–13.0) | <0.001b |
| Number of drugs, median (q1-q3) | 8.0 (5.0–13.0) | 21.0 (11.0–30.0) | 7.0 (3.0–14.0) | <0.001b |
| Number of drug doses, median (q1-q3) | 59.0 (23.0–136.5) | 199.0 (100.0–370.0) | 44.0 (19.0–104.0) | <0.001b |
p-Value was obtained using
Sixty-two ADE were detected in 18.8% of admissions, resulting in 25.83 ADE per 100 admissions (95% CI: 19.81–33.12). This study showed the following mean rates: 20.14 ADE per 1000 patient-days (95% CI: 15.44–25.81), 25.94 ADE per 1000 drugs (95% CI: 19.89–33.26), and 2.12 ADE per 1000 drug doses (95% CI: 1.63–2.72). Thirty-one patients (12.92%) presented only one ADE and 14 patients (5.83%) presented two or three ADE during hospitalization.
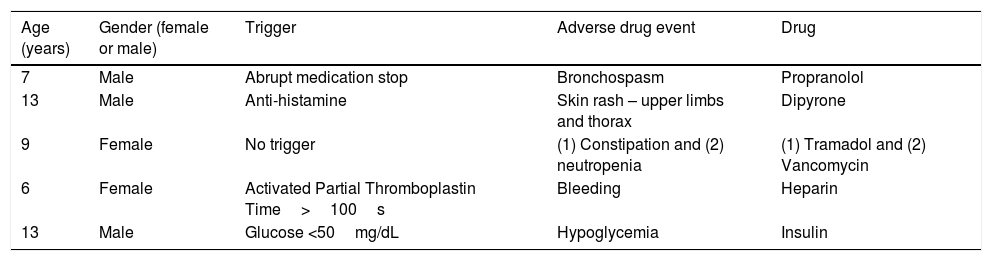
Examples of ADE are described in Table 2. Fifteen (24.9%) of the 62 ADE identified did not have an associated trigger and there was no voluntary reporting of ADE during the study period. All ADE identified were determined to be NCC MERP harm category E (contributed to or resulted in temporary harm to the patient and required intervention).
Examples of adverse drug events (ADE) that occurred in pediatric inpatients at a Brazilian hospital from January 1st to December 31st, 2014.
| Age (years) | Gender (female or male) | Trigger | Adverse drug event | Drug |
|---|---|---|---|---|
| 7 | Male | Abrupt medication stop | Bronchospasm | Propranolol |
| 13 | Male | Anti-histamine | Skin rash – upper limbs and thorax | Dipyrone |
| 9 | Female | No trigger | (1) Constipation and (2) neutropenia | (1) Tramadol and (2) Vancomycin |
| 6 | Female | Activated Partial Thromboplastin Time>100s | Bleeding | Heparin |
| 13 | Male | Glucose <50mg/dL | Hypoglycemia | Insulin |
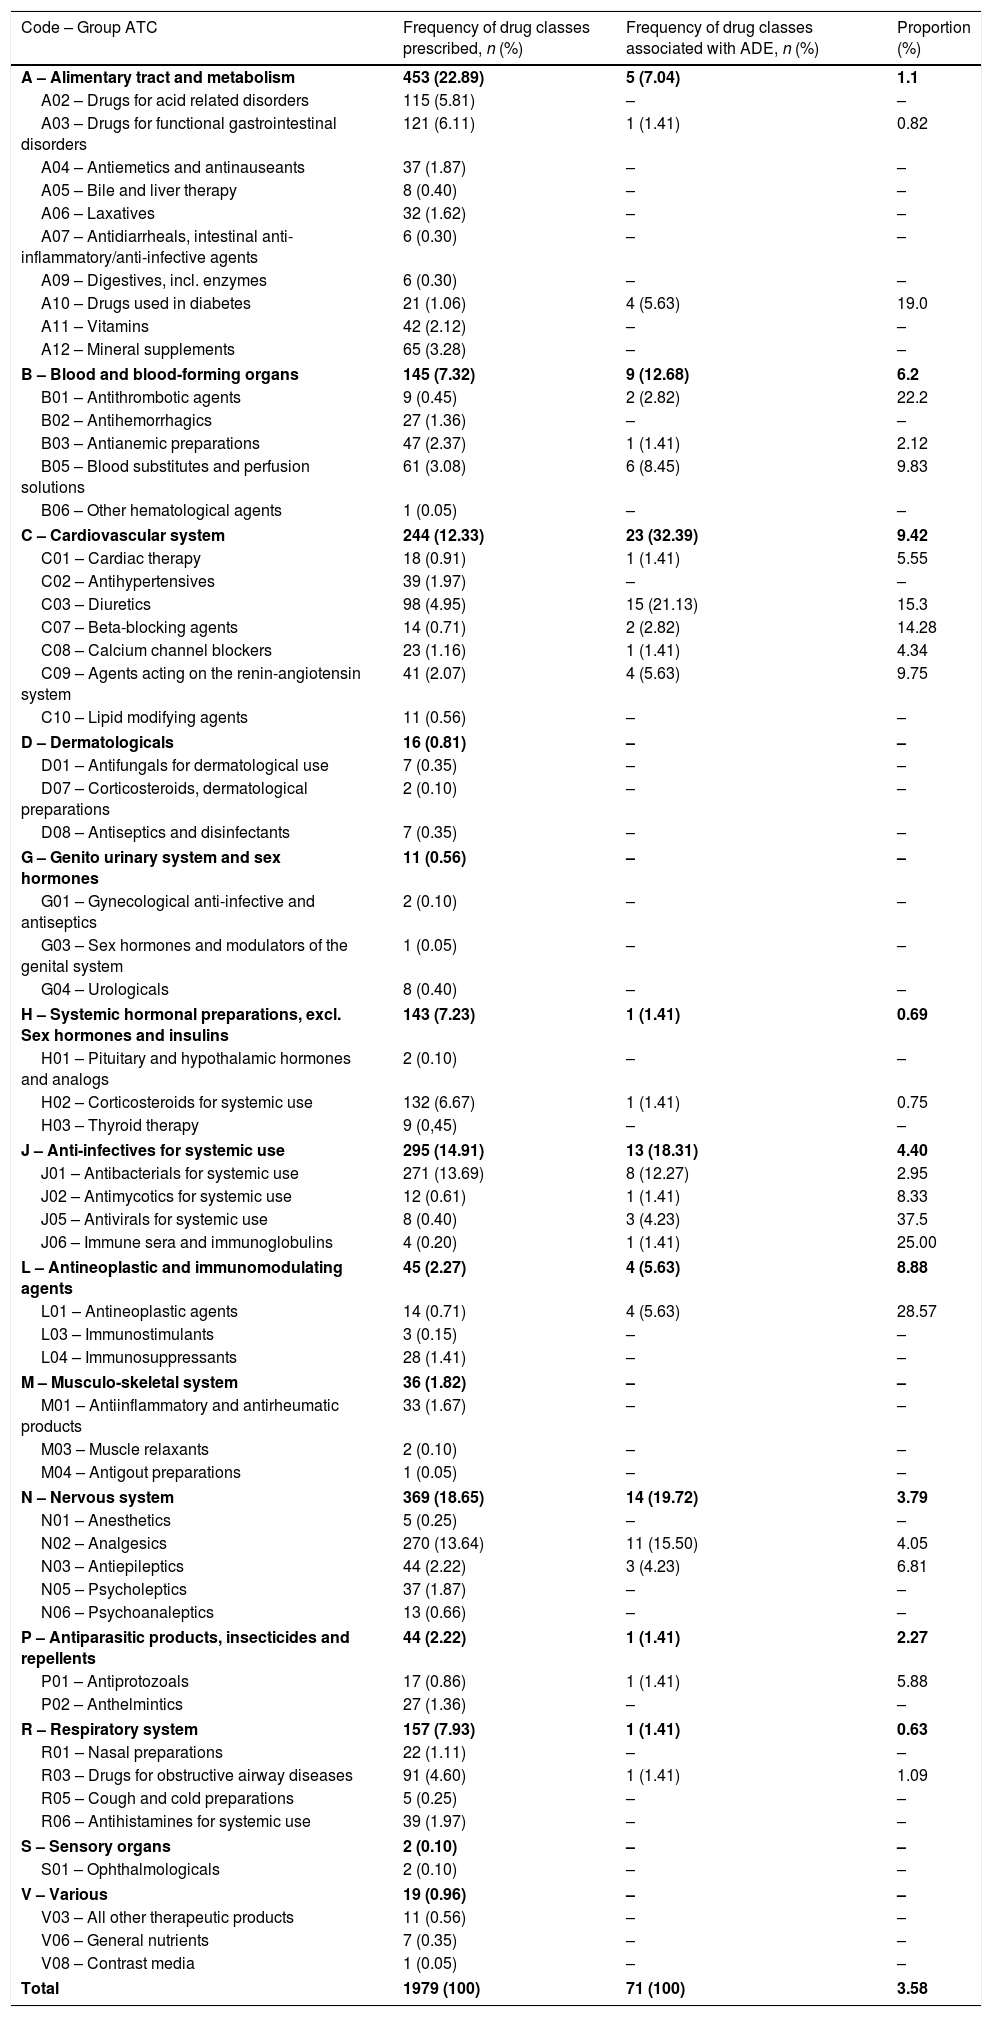
The ADE observed were associated with 71 different drugs. The groups of drugs that were most involved in ADE occurrence were those acting on the cardiovascular system (32.39%), nervous system (19.72%), and drugs acting as anti-infectives for systemic use (18.31%; Table 3). The drugs that were most frequently associated with ADE were furosemide (11.28%), spironolactone (8.45%), albumin (7.04%), and tramadol (7.04%).
Number of drug classes prescribed and the number that were associated with adverse drug events (ADE) that occurred in pediatric inpatients at a Brazilian hospital from January 1st to December 31st, 2014 by the first and second levels of the Anatomical Therapeutic Chemical (ATC) classification.
| Code – Group ATC | Frequency of drug classes prescribed, n (%) | Frequency of drug classes associated with ADE, n (%) | Proportion (%) |
|---|---|---|---|
| A – Alimentary tract and metabolism | 453 (22.89) | 5 (7.04) | 1.1 |
| A02 – Drugs for acid related disorders | 115 (5.81) | – | – |
| A03 – Drugs for functional gastrointestinal disorders | 121 (6.11) | 1 (1.41) | 0.82 |
| A04 – Antiemetics and antinauseants | 37 (1.87) | – | – |
| A05 – Bile and liver therapy | 8 (0.40) | – | – |
| A06 – Laxatives | 32 (1.62) | – | – |
| A07 – Antidiarrheals, intestinal anti-inflammatory/anti-infective agents | 6 (0.30) | – | – |
| A09 – Digestives, incl. enzymes | 6 (0.30) | – | – |
| A10 – Drugs used in diabetes | 21 (1.06) | 4 (5.63) | 19.0 |
| A11 – Vitamins | 42 (2.12) | – | – |
| A12 – Mineral supplements | 65 (3.28) | – | – |
| B – Blood and blood-forming organs | 145 (7.32) | 9 (12.68) | 6.2 |
| B01 – Antithrombotic agents | 9 (0.45) | 2 (2.82) | 22.2 |
| B02 – Antihemorrhagics | 27 (1.36) | – | – |
| B03 – Antianemic preparations | 47 (2.37) | 1 (1.41) | 2.12 |
| B05 – Blood substitutes and perfusion solutions | 61 (3.08) | 6 (8.45) | 9.83 |
| B06 – Other hematological agents | 1 (0.05) | – | – |
| C – Cardiovascular system | 244 (12.33) | 23 (32.39) | 9.42 |
| C01 – Cardiac therapy | 18 (0.91) | 1 (1.41) | 5.55 |
| C02 – Antihypertensives | 39 (1.97) | – | – |
| C03 – Diuretics | 98 (4.95) | 15 (21.13) | 15.3 |
| C07 – Beta-blocking agents | 14 (0.71) | 2 (2.82) | 14.28 |
| C08 – Calcium channel blockers | 23 (1.16) | 1 (1.41) | 4.34 |
| C09 – Agents acting on the renin-angiotensin system | 41 (2.07) | 4 (5.63) | 9.75 |
| C10 – Lipid modifying agents | 11 (0.56) | – | – |
| D – Dermatologicals | 16 (0.81) | – | – |
| D01 – Antifungals for dermatological use | 7 (0.35) | – | – |
| D07 – Corticosteroids, dermatological preparations | 2 (0.10) | – | – |
| D08 – Antiseptics and disinfectants | 7 (0.35) | – | – |
| G – Genito urinary system and sex hormones | 11 (0.56) | – | – |
| G01 – Gynecological anti-infective and antiseptics | 2 (0.10) | – | – |
| G03 – Sex hormones and modulators of the genital system | 1 (0.05) | – | – |
| G04 – Urologicals | 8 (0.40) | – | – |
| H – Systemic hormonal preparations, excl. Sex hormones and insulins | 143 (7.23) | 1 (1.41) | 0.69 |
| H01 – Pituitary and hypothalamic hormones and analogs | 2 (0.10) | – | – |
| H02 – Corticosteroids for systemic use | 132 (6.67) | 1 (1.41) | 0.75 |
| H03 – Thyroid therapy | 9 (0,45) | – | – |
| J – Anti-infectives for systemic use | 295 (14.91) | 13 (18.31) | 4.40 |
| J01 – Antibacterials for systemic use | 271 (13.69) | 8 (12.27) | 2.95 |
| J02 – Antimycotics for systemic use | 12 (0.61) | 1 (1.41) | 8.33 |
| J05 – Antivirals for systemic use | 8 (0.40) | 3 (4.23) | 37.5 |
| J06 – Immune sera and immunoglobulins | 4 (0.20) | 1 (1.41) | 25.00 |
| L – Antineoplastic and immunomodulating agents | 45 (2.27) | 4 (5.63) | 8.88 |
| L01 – Antineoplastic agents | 14 (0.71) | 4 (5.63) | 28.57 |
| L03 – Immunostimulants | 3 (0.15) | – | – |
| L04 – Immunosuppressants | 28 (1.41) | – | – |
| M – Musculo-skeletal system | 36 (1.82) | – | – |
| M01 – Antiinflammatory and antirheumatic products | 33 (1.67) | – | – |
| M03 – Muscle relaxants | 2 (0.10) | – | – |
| M04 – Antigout preparations | 1 (0.05) | – | – |
| N – Nervous system | 369 (18.65) | 14 (19.72) | 3.79 |
| N01 – Anesthetics | 5 (0.25) | – | – |
| N02 – Analgesics | 270 (13.64) | 11 (15.50) | 4.05 |
| N03 – Antiepileptics | 44 (2.22) | 3 (4.23) | 6.81 |
| N05 – Psycholeptics | 37 (1.87) | – | – |
| N06 – Psychoanaleptics | 13 (0.66) | – | – |
| P – Antiparasitic products, insecticides and repellents | 44 (2.22) | 1 (1.41) | 2.27 |
| P01 – Antiprotozoals | 17 (0.86) | 1 (1.41) | 5.88 |
| P02 – Anthelmintics | 27 (1.36) | – | – |
| R – Respiratory system | 157 (7.93) | 1 (1.41) | 0.63 |
| R01 – Nasal preparations | 22 (1.11) | – | – |
| R03 – Drugs for obstructive airway diseases | 91 (4.60) | 1 (1.41) | 1.09 |
| R05 – Cough and cold preparations | 5 (0.25) | – | – |
| R06 – Antihistamines for systemic use | 39 (1.97) | – | – |
| S – Sensory organs | 2 (0.10) | – | – |
| S01 – Ophthalmologicals | 2 (0.10) | – | – |
| V – Various | 19 (0.96) | – | – |
| V03 – All other therapeutic products | 11 (0.56) | – | – |
| V06 – General nutrients | 7 (0.35) | – | – |
| V08 – Contrast media | 1 (0.05) | – | – |
| Total | 1979 (100) | 71 (100) | 3.58 |
The findings confirm that ADE frequently occur in pediatric setting, in 18.8% of the patients in this study. Monitoring hospitalizations occurred over a year in the hospital under study, which allowed us to identify 25.83 harms per 100 admissions in pediatric patients. This ADE rate is higher than those found in previous studies using triggers (11.1 and 25.0 ADE per 100 admissions)10,11 as well as in studies using other methodologies (6.0 and 2.3 ADE per 100 admissions).8,9 In regard to ADE per 1000 patient-days, the present study's rate was 1.28 times higher than that from Takata et al.10 and 2.47 times lower than that from Kirkendall et al.11
Patient harm rates may vary depending on the definition of harm used, sampling criteria, and employed methodology of the study,20 which makes it difficult to compare studies that evaluate the occurrence rates of ADE. Studies that use triggers as research method seems to be more effective, efficient, and robust in ADE identification than others that use voluntary notification,10,14 the review of medical charts not targeted by triggers,14,21 or administrative data.22
Comparison between studies that applied triggers is also limited because rates are dependent on the list of triggers, reviewer experience and type of chart. Kirkendall et al.11 showed the results of the revision of 240 charts in electronic format in one single hospital, for which the primary reviewers were nurses. Takata et al.10 reported the ADE rates of 960 admissions in twelve hospitals around the United States, for which the reviewers in each site were nurses, physicians, or pharmacists. Call et al.23 used an electronic trigger tool package associated with an electronic health record to automatically identify triggers in 390 charts in one single hospital, for which the reviewers of potential ADE were a physician and a pharmacist.
During the study period, there was no voluntary notification of an ADE, which reflects the patient safety culture. However, some healthcare institutions routinely use voluntary notifications of ADE because they may identify significant patient harm.23 Approximately a quarter of the ADE detected in this study were not associated with a trigger, but rather were identified during chart review when searching for a trigger. This finding suggests that the use of two detection methods is the best approach to quantify ADE in the hospital setting.10,24
This study provides additional evidence and supports that special attention should be paid to patients taking multiple drugs, as well as patients who have prolonged hospitalization. Comparison between the group of patients with and without ADE highlights the higher length of stay among those with ADE. The relationship between the increased length of hospital stay and ADE occurrence was shown in several studies25,26; therefore, this association is related to the increased health risk to the patient resulting from hospital care.
Comparison between groups also reveals the greater use of drugs among patients who had ADE. A previous study showed that taking multiple drugs increases chances of ADE development and increases concerns about medication safety risks in healthcare, which is a recognized challenge in patient safety.27
Several types of ADE were detected, such as nausea, vomiting, and rash, and diverse drug classes were related to the occurrence of these events. Consistent with the present study, opioid analgesics and antibiotics are among drug classes most associated with the occurrence of ADE.9,10 Opioids are considered high-risk drugs in many studies because they have the potential to cause significant harm to the patient.28 In addition, cardiovascular drugs are responsible for a large number of ADE. Drugs of this class are widely prescribed, and thus contribute to the occurrence of ADE most frequently.26,29
The ADE severity found in this study was lower than that in the previous studies,10,11 as all harms were described as category E (temporary harm). Takata et al.10 reported 2.8% of events in category F (temporary harm requiring initial or prolonged hospitalization) and the rest of the ADE in category E. Kirkendall et al.11 identified 51% of harm in category E, 44% in F, and 5% in H (required intervention to sustain life). Understanding harm is an essential part of healthcare since its measurement allows the detection of risk situations and early identification of resources, subsequently limiting harm to the patient.
Therefore, drugs cause harm in pediatric inpatients, and ADE deserve attention even when they are classified in the lower category of harm. Data presented here strongly support the trigger tool as a robust method to assess ADE, and they may help improve the knowledge about frequency and types of ADE, as well as drug classes related to harm in the pediatric department of Brazilian hospitals. This is important information that is in agreement with one of the first steps of the Third Global Patient Safety Challenge: Medication without Harm announced by the World Health Organization (WHO) in 2017, which is “strengthening the quality of data to monitor medication-related harm”.30
Nevertheless, further investigation is necessary to evaluate the inter-rater agreement of trigger application to evaluate the relevance of the tool when applied by different healthcare professionals. In addition, the association between the occurrence of ADE and length of hospital stay or number of drugs is worth pursuing for further investigation to search for risk factors for ADE in Brazilian pediatric inpatients. Moreover, the methodology in this study can be applied to other hospitals in Brazil to generate routine data, which can characterize the occurrence of ADE in different parts of the country.
Strengths and limitationsThis study has impact on both research and clinical practice. In general, the main objective of the data is showing the occurrence of ADE and the identification process that may be improved or changed in healthcare settings. Retrospective chart review using triggers does not enable a direct observation in patient healthcare. However, the method enables to generation of information about the care processes and contributes to the development of strategies to reduce harm or even eliminate the occurrence of new events.
There are limitations in the study that are inherent to the retrospective design. For example, retrospective studies require good quality of medical charts, but the authors found in the revision that some information was missing. Therefore, the number of ADE may be underestimated resulting from the lack of description of relevant information, such as the temporal order of the events. Nevertheless, retrospective chart review is considered a superior methodology in research of ADE when compared to other methods.
In addition, retrospective chart review involves subjectivity, including the harm level categorization. All ADE detected were classified as harm level E, which can be influenced by how the notes were registered in the chart. In this sense, the authors conducted a retrospective chart review process using a specific manual with a standard form and validated triggers, and a healthcare professional team including nurses, pharmacists, and physicians discussed all collected data.
This study was performed in a hospital where the charts were filled manually. Therefore, it was not possible to access the physical chart in some specific cases because the patient was in a new hospitalization or the chart was in audit, for example. In these cases, another admission was randomly selected to replace it, to avoid compromising the study’ results.
The method recommends that each chart is analyzed within 20min. However, the time of the chart review was not taken into account. Twenty minutes of chart review allows simplified processes. However, this time was insufficient in this study to identify events in hospitalizations with prolonged length of stay or complex cases. In addition, some triggers were difficult to identify, e.g., over-sedation, lethargy, falls, or hypotension, which required more careful analysis by reviewers of all notes.
Finally, this study was conducted in a single pediatric department of a tertiary teaching hospital, which limits generalizations of the study results. However, this hospital is considered a reference service in pediatric specialties and assistance is offered free for patients from different parts of the country.
FundingThis study was supported by Coordenação de Aperfeiçoamento de Pessoal de Nível Superior (CAPES)(finance code 001 - grants AUXPE 1665/2016) and Fundação de Amparo à Pesquisa do Estado de Goiás (FAPEG)
Conflicts of interestThe authors declare no conflicts of interest.
The following are the supplementary data to this article:
Please cite this article as: Silva LT, Modesto AC, Martins RR, Lopes FM. Characterization of adverse drug events identified by trigger in Brazilian pediatric inpatients. J Pediatr (Rio J). 2020;96:393–401.


