


To develop Brazilian growth charts for body mass index (BMI-for-age) for individuals with Down syndrome (DS). The secondary objective was to compare the BMI-for-age with the Centers for Disease Control and Prevention standards (CDC).
MethodsA retrospective and cross-sectional growth study of 706 youth with DS (56.7% males) was performed in 51 centers in São Paulo state, Brazil. Weight and height were used to calculate the BMI (kg/m2). The LMS method was applied to construct the growth charts. Z-scores were based on the CDC 2000 growth standards.
ResultsThe BMI-for-age reference charts showed excellent goodness of fit statistics for boys and girls with DS aged 2–18 years. At 2 years of age, the mean BMI Z-scores of boys and girls with DS were lower compared to those of the CDC (Z-score=−0.2). In contrast, children with DS aged 3–18 years had higher mean Z-scores for BMI-for-age when compared to those of the CDC (Z-scores=+0.2 to +1.3).
ConclusionsThe BMI of Brazilian youth with DS differs from those references established by CDC. These are the first Brazilian BMI-for-age charts for individuals with DS and will hopefully guide clinicians and parents in the evaluation and management of the nutritional status in children and adolescents with DS in Brazil.
Desenvolver curvas específicas de Índice de Massa Corporal (IMC-para-idade) para população brasileira com síndrome de Down (SD). O objetivo secundário foi comparar os valores de IMC-para-idade com os valores normativos do Centro para o Controle de Doenças dos Estados Unidos (CDC).
MétodosTrata-se de estudo do tipo retrospectivo e transversal. A amostra foi constituída de 706 jovens com SD (56,7%, meninos) recrutados em 51 instituições no estado de São Paulo, Brasil. Peso e estatura foram obtidos e empregados para o cálculo de IMC (Kg/m2). O método LMS foi usado para a construção das curvas. Escores Z foram calculados com base na referência do CDC 2000.
ResultadosAs curvas de referência de IMC-para-idade para meninos e meninas com SD na faixa etária entre 2-18 anos apresentaram excelente ajuste estatístico. Aos dois anos de idade, o escore Z médio IMC de crianças com SD apresentou-se menor quando comparado ao CDC (escore Z=-0,2). Em contraste, os escores Z médios de IMC de jovens com SD foram superiores nas idades entre 3-18 anos (escores Z=+0,2 a +1,3).
ConclusõesA população brasileira com SD apresentou diferentes padrões de IMC quando comparada às referências do CDC. As curvas desenvolvidas nesse estudo representam a primeira referência nacional de IMC-para-idade para jovens com SD. Espera-se, portanto, que essas curvas possam guiar pais e profissionais na avaliação do estado nutricional de crianças e adolescentes com SD no território brasileiro.
Down syndrome (DS) is a chromosomal disorder with an approximate incidence between 3.05 and 14 cases per 10,000 live births in the United States and China.1,2 Recent studies have shown a population prevalence between 6.1 and 13.1 per 10,000 persons.3,4 The life expectancy of individuals with DS has increased considerably over the past years. A study suggests that 94.4% of children with DS born in 2000 will survive up to 2020, 90.8% up to 2030, and 76.3% up to 2050.3 Life expectancy is linked to the development of research and services provided to this population.5 Despite these advances, children with DS have health conditions that affect their quality of life, including congenital heart disease, hypothyroidism, gastrointestinal disorders, and obstructive sleep apnea.6 According to the guidelines of the American Academy of Pediatrics and of the Brazilian Ministry of Health, individuals with DS also have growth restriction and overweight.7,8
The adequate monitoring of the nutritional status of youth with DS helps to prevent and identify overall health problems. The body mass index (BMI) is a health indicator that is commonly used to classify the nutritional status of children, adults, and the elderly. The Centers for Disease Control and Prevention (CDC) has recommended the use of BMI to assess the health status of children older than 2 years. However, youth with DS have different weight, height, and BMI standards when compared to children in the general population without DS.9
Youth with DS aged 2–20 years had lower height and higher BMI when compared to the CDC charts, suggesting the need for specific growth charts for youth with DS.10 In Brazil, the Ministry of Health recommends the use of the weight-for-age charts by Cronk et al.11 for monitoring the nutritional status of Brazilian youth with DS aged 2–18 years. These charts combine cross-sectional and longitudinal data including 730 U.S. individuals with DS aged 1 month to 18 years.11 The clinical and practical use of these curves, however, had been questioned by the American Academy of Pediatrics.8
Due to the limitations of the existing charts and the absence of normative values of BMI-for-age for Brazilian youth with DS, this study aimed to develop Brazilian BMI-for-age charts for individuals with DS aged 2–18 years. The secondary objective was to compare the BMI-for-age of the study participants with the normative values established by the CDC/2000.
MethodsChildren and adolescents with DS aged 2–18 years were recruited from a retrospective and cross-sectional study carried out between 2012 and 2015. The study was conducted at Universidade Estadual de Campinas, 48 specialized centers that provide care to individuals with intellectual disabilities, and two specialized centers for individuals with DS, all located in the state of São Paulo. The study was approved by the Ethics Committee of the Faculdade de Ciências Médicas of the Universidade Estadual de Campinas (No. 140.186/2012). An informed consent was signed by parents and guardians.
Clinical data records were obtained through interviews with families and from medical records. A questionnaire was applied to parents and guardians, including information on age, sex, gestational age, comorbidities, medications, weight, height, and head circumference. During the interview (2012–2014), information was also obtained from the Child Health record Card and questionnaires provided to parents (by healthcare facilities, medical clinics, and hospitals in the city of Campinas). Weight and height were measured by a trained team. Participants were measured barefoot and wearing light clothes. In Campinas, height was measured using a portable stadiometer, model E210 (Wiso®, SC, Brazil). Weight was measured using a digital scale, model W801 (Wiso®, SC, Brazil).
Data screening was carried out in different stages: 1) We excluded duplicated data based on identification code, birthdate, and measurement date; 2) We removed outliers (five standard deviations above or below the mean); 3) We excluded data points demonstrating loss of height over time. The questionnaires and clinical records were reviewed and data inconsistencies were resolved. Weight and height data were used to calculate BMI using the following formula: BMI=weight divided by height squared (kg/m2). Generalized additive models for location, scale and shape (GAMLSS)12 were used for the construction of the BMI-for-age curves, using the R software (R Foundation for Statistical Computing, version 3.2.2, Vienna, Austria). The LMS method and worm plots were used for modeling the curves.13,14
The percentiles generated for BMI-for-age were: 5th, 10th, 25th, 50th, 75th, 85th, 90th, and 95th. Mean Z-scores were calculated to compare the BMI-for-age with the normative references established by the CDC,15 according to the following equation: Z=[(X/M)L−1]/L*S, where X is the observed measurement (BMI) of each participant, M is the median, L is the skewness, −1 is the constant, and S is the coefficient of variation. The values of L, M, and S were obtained from CDC/2000 normative charts.
ResultsParticipantsThe sample consisted of 706 individuals with DS aged 2–18 years born between 1978 and 2012 (56.7% males). A total of 1,986 BMI data points were used to construct the charts. Preterm infants were 10.1% (<37 weeks gestation). A total of 17.9% had congenital heart disease, 13.1% had undergone cardiac surgery, and 22% had hypothyroidism (all controlled through laboratory tests). Missing data for gestational age, heart disease, and hypothyroidism were 57.9%, 31.3%, and 27.2%, respectively.
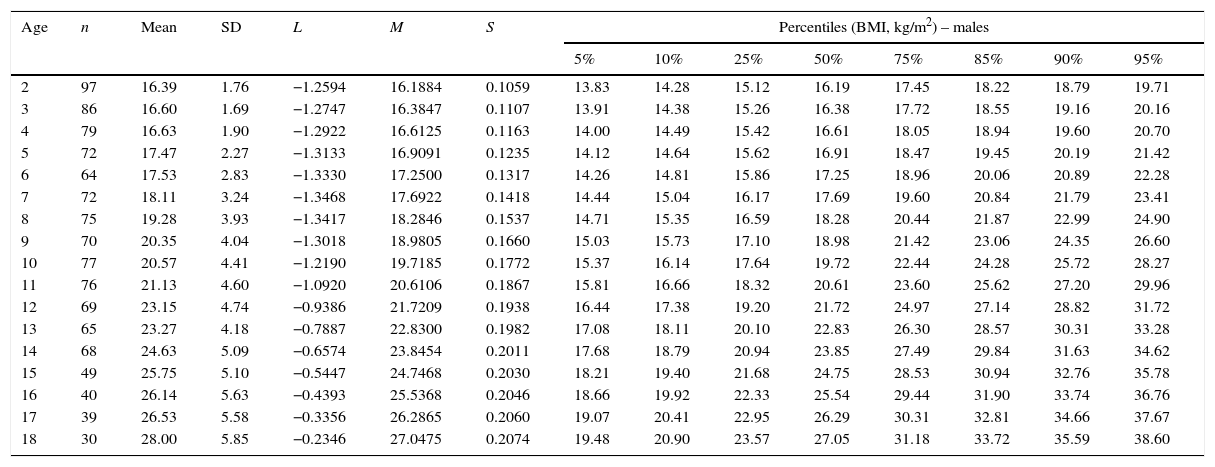
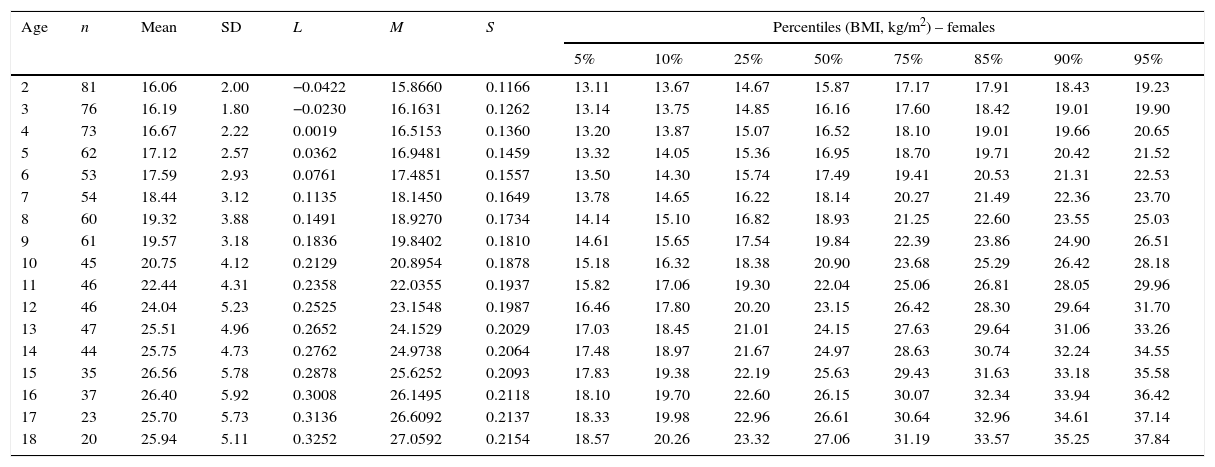
BMI chartsThe reference charts of BMI-for-age for boys and girls with DS aged 2–18 years showed excellent goodness of fit statistics. Most subjects showed more than a single data point (82%). The number of data points, means, standard deviations, LMS, and percentiles for age and sex are shown in Tables 1 and 2. BMI-for-age charts of boys and girls with DS can be seen in Figs. 1 and 2. At 2 years of age, the mean BMI Z-score of children with DS was lower compared to the normative values of the CDC (Z-score=−0.2). In contrast, mean BMI Z-scores of children and adolescents with DS were higher at ages 3–18 years (Z-scores=+0.2 to +1.3).
Body mass index (BMI) values of male children and adolescents with Down syndrome aged 2–18 years.
| Age | n | Mean | SD | L | M | S | Percentiles (BMI, kg/m2) – males | |||||||
|---|---|---|---|---|---|---|---|---|---|---|---|---|---|---|
| 5% | 10% | 25% | 50% | 75% | 85% | 90% | 95% | |||||||
| 2 | 97 | 16.39 | 1.76 | −1.2594 | 16.1884 | 0.1059 | 13.83 | 14.28 | 15.12 | 16.19 | 17.45 | 18.22 | 18.79 | 19.71 |
| 3 | 86 | 16.60 | 1.69 | −1.2747 | 16.3847 | 0.1107 | 13.91 | 14.38 | 15.26 | 16.38 | 17.72 | 18.55 | 19.16 | 20.16 |
| 4 | 79 | 16.63 | 1.90 | −1.2922 | 16.6125 | 0.1163 | 14.00 | 14.49 | 15.42 | 16.61 | 18.05 | 18.94 | 19.60 | 20.70 |
| 5 | 72 | 17.47 | 2.27 | −1.3133 | 16.9091 | 0.1235 | 14.12 | 14.64 | 15.62 | 16.91 | 18.47 | 19.45 | 20.19 | 21.42 |
| 6 | 64 | 17.53 | 2.83 | −1.3330 | 17.2500 | 0.1317 | 14.26 | 14.81 | 15.86 | 17.25 | 18.96 | 20.06 | 20.89 | 22.28 |
| 7 | 72 | 18.11 | 3.24 | −1.3468 | 17.6922 | 0.1418 | 14.44 | 15.04 | 16.17 | 17.69 | 19.60 | 20.84 | 21.79 | 23.41 |
| 8 | 75 | 19.28 | 3.93 | −1.3417 | 18.2846 | 0.1537 | 14.71 | 15.35 | 16.59 | 18.28 | 20.44 | 21.87 | 22.99 | 24.90 |
| 9 | 70 | 20.35 | 4.04 | −1.3018 | 18.9805 | 0.1660 | 15.03 | 15.73 | 17.10 | 18.98 | 21.42 | 23.06 | 24.35 | 26.60 |
| 10 | 77 | 20.57 | 4.41 | −1.2190 | 19.7185 | 0.1772 | 15.37 | 16.14 | 17.64 | 19.72 | 22.44 | 24.28 | 25.72 | 28.27 |
| 11 | 76 | 21.13 | 4.60 | −1.0920 | 20.6106 | 0.1867 | 15.81 | 16.66 | 18.32 | 20.61 | 23.60 | 25.62 | 27.20 | 29.96 |
| 12 | 69 | 23.15 | 4.74 | −0.9386 | 21.7209 | 0.1938 | 16.44 | 17.38 | 19.20 | 21.72 | 24.97 | 27.14 | 28.82 | 31.72 |
| 13 | 65 | 23.27 | 4.18 | −0.7887 | 22.8300 | 0.1982 | 17.08 | 18.11 | 20.10 | 22.83 | 26.30 | 28.57 | 30.31 | 33.28 |
| 14 | 68 | 24.63 | 5.09 | −0.6574 | 23.8454 | 0.2011 | 17.68 | 18.79 | 20.94 | 23.85 | 27.49 | 29.84 | 31.63 | 34.62 |
| 15 | 49 | 25.75 | 5.10 | −0.5447 | 24.7468 | 0.2030 | 18.21 | 19.40 | 21.68 | 24.75 | 28.53 | 30.94 | 32.76 | 35.78 |
| 16 | 40 | 26.14 | 5.63 | −0.4393 | 25.5368 | 0.2046 | 18.66 | 19.92 | 22.33 | 25.54 | 29.44 | 31.90 | 33.74 | 36.76 |
| 17 | 39 | 26.53 | 5.58 | −0.3356 | 26.2865 | 0.2060 | 19.07 | 20.41 | 22.95 | 26.29 | 30.31 | 32.81 | 34.66 | 37.67 |
| 18 | 30 | 28.00 | 5.85 | −0.2346 | 27.0475 | 0.2074 | 19.48 | 20.90 | 23.57 | 27.05 | 31.18 | 33.72 | 35.59 | 38.60 |
Body mass index (BMI) values of female children and adolescents with Down syndrome aged 2–18 years.
| Age | n | Mean | SD | L | M | S | Percentiles (BMI, kg/m2) – females | |||||||
|---|---|---|---|---|---|---|---|---|---|---|---|---|---|---|
| 5% | 10% | 25% | 50% | 75% | 85% | 90% | 95% | |||||||
| 2 | 81 | 16.06 | 2.00 | −0.0422 | 15.8660 | 0.1166 | 13.11 | 13.67 | 14.67 | 15.87 | 17.17 | 17.91 | 18.43 | 19.23 |
| 3 | 76 | 16.19 | 1.80 | −0.0230 | 16.1631 | 0.1262 | 13.14 | 13.75 | 14.85 | 16.16 | 17.60 | 18.42 | 19.01 | 19.90 |
| 4 | 73 | 16.67 | 2.22 | 0.0019 | 16.5153 | 0.1360 | 13.20 | 13.87 | 15.07 | 16.52 | 18.10 | 19.01 | 19.66 | 20.65 |
| 5 | 62 | 17.12 | 2.57 | 0.0362 | 16.9481 | 0.1459 | 13.32 | 14.05 | 15.36 | 16.95 | 18.70 | 19.71 | 20.42 | 21.52 |
| 6 | 53 | 17.59 | 2.93 | 0.0761 | 17.4851 | 0.1557 | 13.50 | 14.30 | 15.74 | 17.49 | 19.41 | 20.53 | 21.31 | 22.53 |
| 7 | 54 | 18.44 | 3.12 | 0.1135 | 18.1450 | 0.1649 | 13.78 | 14.65 | 16.22 | 18.14 | 20.27 | 21.49 | 22.36 | 23.70 |
| 8 | 60 | 19.32 | 3.88 | 0.1491 | 18.9270 | 0.1734 | 14.14 | 15.10 | 16.82 | 18.93 | 21.25 | 22.60 | 23.55 | 25.03 |
| 9 | 61 | 19.57 | 3.18 | 0.1836 | 19.8402 | 0.1810 | 14.61 | 15.65 | 17.54 | 19.84 | 22.39 | 23.86 | 24.90 | 26.51 |
| 10 | 45 | 20.75 | 4.12 | 0.2129 | 20.8954 | 0.1878 | 15.18 | 16.32 | 18.38 | 20.90 | 23.68 | 25.29 | 26.42 | 28.18 |
| 11 | 46 | 22.44 | 4.31 | 0.2358 | 22.0355 | 0.1937 | 15.82 | 17.06 | 19.30 | 22.04 | 25.06 | 26.81 | 28.05 | 29.96 |
| 12 | 46 | 24.04 | 5.23 | 0.2525 | 23.1548 | 0.1987 | 16.46 | 17.80 | 20.20 | 23.15 | 26.42 | 28.30 | 29.64 | 31.70 |
| 13 | 47 | 25.51 | 4.96 | 0.2652 | 24.1529 | 0.2029 | 17.03 | 18.45 | 21.01 | 24.15 | 27.63 | 29.64 | 31.06 | 33.26 |
| 14 | 44 | 25.75 | 4.73 | 0.2762 | 24.9738 | 0.2064 | 17.48 | 18.97 | 21.67 | 24.97 | 28.63 | 30.74 | 32.24 | 34.55 |
| 15 | 35 | 26.56 | 5.78 | 0.2878 | 25.6252 | 0.2093 | 17.83 | 19.38 | 22.19 | 25.63 | 29.43 | 31.63 | 33.18 | 35.58 |
| 16 | 37 | 26.40 | 5.92 | 0.3008 | 26.1495 | 0.2118 | 18.10 | 19.70 | 22.60 | 26.15 | 30.07 | 32.34 | 33.94 | 36.42 |
| 17 | 23 | 25.70 | 5.73 | 0.3136 | 26.6092 | 0.2137 | 18.33 | 19.98 | 22.96 | 26.61 | 30.64 | 32.96 | 34.61 | 37.14 |
| 18 | 20 | 25.94 | 5.11 | 0.3252 | 27.0592 | 0.2154 | 18.57 | 20.26 | 23.32 | 27.06 | 31.19 | 33.57 | 35.25 | 37.84 |
 curves for male children and adolescents with Down syndrome aged 2–18 years.")
 curves for female children and adolescents with Down syndrome aged 2–18 years.")
This study depicts the first Brazilian BMI-for-age charts for children and adolescents with DS aged 2–18 years. The study also found differences in BMI among the children and adolescents with DS enrolled in the present study and the normative values established by the CDC. The results have clinical and practical implications regarding the monitoring of the nutritional status of children and adolescents with DS in Brazil.
At 2 years of age, the mean BMI values of boys and girls with DS were below the standards established by the CDC. Studies show that children with DS are characterized by reduced body weight during the first two years of life.10,16 Low birthweight may be related to growth restriction and food intake disorders.17,18 Growth restriction is related to genetic factors.19 Suction/swallowing disorders are associated with muscle hypotonia and dysfunctions in the oral motor system.18 After 2 years of age, the mean BMI-for-age Z-scores of children and adolescents with DS resulted in approximately one standard deviation above the normative values of the CDC. Zemel et al.10 also reported higher values of BMI-for-age in U.S. children with DS after 2 years of age when compared to CDC standards. After that age, children with DS are likely to have higher prevalence of overweight and obesity when compared to children in the general population without DS.20,21 Risk factors for obesity in DS include leptin hormone disorders, decreased resting energy expenditure, unbalanced diet, and low levels of physical activity.22–25
The percentiles of BMI-for-age of children with DS increased gradually in the age range from 2 to 18 years; a similar pattern was observed in the BMI-for-age percentiles of U.S. children with DS aged 2–20 years.10 The uninterrupted increases in BMI observed in individuals with DS are not consistent with the BMI standards from the general population without DS. Growth international references show a rapid acceleration in median percentiles of BMI-for-age in the first year of life, followed by a decline until the age of 5 years, and a reacceleration at later ages.15,26,27
These BMI-for-age curves are descriptive standards of growth in children and adolescents with DS. However, these curves do not indicate an optimal standard of weight, to which all children with DS should grow. The use these curves, however, allows for comparison and monitoring of body weight status of individuals with DS in Brazil.
The Brazilian Ministry of Health recommends using the weight-for-age charts by Cronk et al.11 for monitoring the nutritional status of Brazilian children with DS. However, the clinical applicability has been questioned by the American Academy of Pediatrics.8 The distribution of BMI-for-age percentiles among the population of this study and the CDC has shown differences from the practical standpoint. For example, a male child with DS aged 14 years (BMI: 23.85kg/m2, 50th percentile, see Table 1) would be classified in the overweight category by the CDC/BMI parameters (CDC/BMI: 22.66kg/m2, 85th percentile). The results suggest that further studies are needed to examine the association between BMI cutoffs and the overall health of children and adolescents with DS.
This study has some limitations. First, the data were obtained from clinical records and may include measurement errors. However, the data screening was rigorously performed to minimize biases. Second, the sample was restricted to the state of São Paulo and does not represent the total population of children with DS in Brazil. Conversely, the state of São Paulo, with an estimated population of 44,035,304 individuals (21.7% of Brazil) can represent the economic and ethnical diversity of the country. Finally, the curves do not represent the optimal growth status of children with DS, considering that some growth-influencing factors were not controlled, such as breastfeeding, lactation support, comorbidities, maternal health, and socioeconomic status. Further studies should investigate the association between these factors and the growth of children and adolescents with DS.
In conclusion, the Brazilian individuals with DS showed different BMI-for-age when compared to CDC references. The curves developed in this study represent the first national reference of BMI-for-age for youth with DS. Therefore, it is expected that these curves can guide parents and professionals in assessing the nutritional status of children and adolescents with DS in Brazil.
FundingCoordenação de Aperfeiçoamento de Pessoal de Nível Superior (CAPES) and Conselho Nacional de Desenvolvimento Científico e Tecnológico (CNPq).
Conflicts of interestThe authors declare no conflicts of interest.
The authors received financial support from Coordenação de Aperfeiçoamento de Pessoal de Nível Superior (CAPES – BEX 3546/15-2) and from Conselho Nacional de Desenvolvimento Científico e Tecnológico (PIBIC – CNPq). The authors would like to thank Roberto A. Soares, João F. Cosmo, Alessandra C.P.D. Costa, Eliane T. Nogueira, Fabio Crozara, Célia de Oliveira, and Maria A. C. Pacheco for their excellent technical assistance. The authors would also like to thank the Associações de Pais e Amigos dos Excepcionais do Estado de São Paulo (APAEs/SP), Outpatient Clinic of Pediatric Specialty Integration of Faculdade de Ciências Médicas, Universidade Estadual de Campinas (AIEP/FCM/UNICAMP), Department of Medical Genetics (DGM/FCM/UNICAMP), Centro de Investigação em Pediatria (CIPED/FCM/Unicamp), Federação das APAEs do Estado de São Paulo (FEAPAES/SP), Centro de Educação Especial Síndrome de Down (CEESD), and Fundação Síndrome de Down (FSD) for their fundamental collaboration in this study.
Please cite this article as: Bertapelli F, Machado MR, Roso RV, Guerra-Júnior G. Body mass index reference charts for individuals with Down syndrome aged 2–18 years. J Pediatr (Rio J). 2017;93:94–9.
Study carried out at Universidade Estadual de Campinas (UNICAMP), Campinas, SP, Brazil.


