


The objective was to calculate weight/length (W/L) ratio values and percentiles by sex and gestational age (GA) to estimate fat mass (FM), fat-free mass (FFM) and body fat percentage (BF%) as well as to compare these indices in preterm, small (SGA), and large (LGA) for GA, stunted and wasted infants from a Brazilian cohort of newborns, comparing with the INTERGROWTH-21st.
MethodsSecondary, cross-sectional analysis of data obtained of 7427 live-born infants from the BRISA Cohort Study in the city of Ribeirão Preto, SP, Brazil in 2010. For body composition estimation, W/L ratio was used in multiple regression models. The 3rd, 50th, and 97th percentiles for W/L ratio and body composition measures (FM, FFM, and BF%) were calculated using fractional polynomial regression models.
ResultsAverage W/L ratio was 6.50 kg/m (SD 0.87), while for FM, BF%, and FFM the corresponding values were 359.64 g (145.76), 10.90% (3.05) and 2798.84 g (414.84), respectively. SGA (< 3rd percentile), and wasted infants showed the lowest W/L ratios and measures of body composition. The 3rd, 50th, and 97th percentiles charts of W/L, FM, BF%, and FFM by GA and sex are presented.
ConclusionsW/L ratio values of the RP-BRISA Cohort are higher than IG-21st. SGA (< 3rd) and wasted infants showed the lowest W/L ratio and measures of body composition. The body composition references presented here could be used to refine the nutritional assessment of Brazilian newborns and to facilitate comparisons across populations.
There is increasing evidence that intrauterine environment and, consequently, intrauterine growth, have immediate and long-term consequences for health.
Since the 1970s, abnormal neonatal growth phenotypes have been categorized as small (SGA) or large (LGA) for gestational age, stunted (i.e., low length for age), or wasted (i.e., low weight for length).1 Individual neonates are at risk of or might be born with more than one condition, and they may also change from one state to the other over time, accumulating risks to their health.
Adipose tissue development is particularly sensitive to variations in foetal growth. From an evolutionary perspective, mammalian fat provides an energy stock that supports rapid foetal brain growth and protects the newborn against the possibility of nutritional deprivation.2
However, birth weight does not accurately reflect the newborn body composition in terms of the relative contribution of fat mass (FM) and fat-free mass (FFM).3 Furthermore, FM and FFM contributions vary according to gestational age (GA), birth weight, and sexual dimorphism.4 Therefore, there is no agreement as to the most appropriate way to assess neonatal nutritional status. Newborn body composition, like in adults, has been studied using different models and techniques: anthropometry, bioelectrical impedance analysis, ultrasound, dual-energy X-ray absorptiometry, air displacement plethysmography, and magnetic resonance imaging, among others.5
These techniques are generally impractical for wide use in a neonatal population because they may be relatively invasive, expensive, time-consuming, and may involve radiation exposure.6 Therefore, it is important to have a reliable, non-invasive, easily obtainable measurement or ratio to better evaluate the quality of intrauterine growth.
Anthropometric indices have been used as a proxy for body composition, including combinations of weight, length, skinfold thickness, and various body circumferences. Indices such as weight/length, or those in which weight is normalized with the power of length, such as the body mass index (BMI), may be practical alternatives.
Several studies showed that the weight/length ratio (W/L ratio) best predicts newborn FM, FFM, and body fat percentage (BF%).4,7–9 There are different FM, FFM and BF% patterns by sex, GA, and size at birth. However, the reference values for W/L ratio and the correlations between W/L ratio and FM, FFM and BF were not validated in different cohorts of newborns.
The main objective of the present study was to calculate W/L ratio values in newborns of the 2010 Ribeirão Preto birth cohort, to produce reference charts for W/L ratio, by sex and GA, and to compare them with the INTERGROWTH-21st.10 The secondary objective was to estimate FM, FFM and BF%, using W/L ratio, in preterm, SGA, LGA, stunted, and wasted newborns.
MethodsStudy designSecondary cross-sectional analysis of data obtained from a cohort study, with a descriptive and analytical approach.
Study populationThis cohort is part of the Brazilian Ribeirão Preto and São Luís Birth Cohort Studies (BRISA, in the Portuguese acronym). The BRISA Project has been described elsewhere.11 During the study period (01/01–12/31/2010), 7701 newborns were evaluated in the city of Ribeirão Preto, São Paulo, comprising 98% of all hospital births in the city. The exclusion criteria for this study were a GA < 24 or > 42 weeks; lack of data on birth weight, length, GA, or sex; major congenital anomalies; and twin births.
Infants born to mothers with medical conditions (such as diabetes, smoking, alcohol or drug dependence, preeclampsia, or hypertension) were not excluded since the aim of the study was to describe community-based data rather than those of a ‘healthy’ population.
Primary outcomeW/L ratio, as compared to the INTERGROWTH-21st reference values.
Secondary outcomesMeasures of newborn body composition: fat mass (FM, grams of adipose tissue), fat-free mass (FFM, comprising water, muscle, and bone, in grams — a proxy for lean mass) and body fat percentage (BF%, a measure of relative FM that is complementary to FFM, calculated as a proportion of the FM divided by total mass). These values were analysed in subgroups of preterm (<37 weeks GA); SGA, birth weight (BW) < 3rd percentile; SGA, BW < 10th percentile; LGA, BW > 97th percentile; stunted, birth length < 3rd percentile (all according to the INTERGROWTH-21st Newborn Size Standards10); and wasted, birth BMI < 3rd percentile (Villar J, personal communication).
Maternal variablesAge, education, skin color, pre-gestational weight (kg), maternal height (m), BMI (kg/m2), marital status, head of family occupation, previous abortion and stillbirth, parity, chronic hypertension, gestational hypertension, diabetes, gestational diabetes, smoking, and caesarean section.
Newborn variablesSex, birth weight, birth length, head circumference, weight to length ratio (W/L ratio, kg/m), BMI (kg/m2), ponderal index (PI, kg/m3), and foetal growth ratio (FGR, the ratio between observed BW and mean BW for each gestational age).12 Gestational age was estimated by the date of the last menstrual period and information from the earliest ultrasound examination.
Statistical methodsThe variables were summarized in means with standard deviations or confidence intervals, or proportions, as appropriate, stratifying by sex and GA.
The following indices were calculated: W/L = weight (kg) ÷length(m); BMI = weight (kg) ÷ [length(m)]2, and PI = weight (kg) ÷ [length(m)].2
Body composition estimates (FM, FFM, and BF%) were calculated and plotted between 33 and 42 weeks, following the study by Villar et al.4 W/L ratio, GA (exact weeks), sex, and age at the time of body composition assessment (fixed in 24 h) were included in the multiple regression analysis.
To estimate the references of W/L ratio by GA and sex, fractional polynomial regression models were fitted. The 3rd, 50th and 97th percentiles were calculated and plotted. Goodness-of-fit was assessed by visual inspection and residual analysis. The curves of W/L ratio obtained were visually compared with those of IG-21st.4
Stata version 14.1 (StataCorp, Cary, USA) was used, along with the R statistical software version 3.2.4, the latter with the GAMLSS framework (https://cran.r-project.org/web/packages/gamlss/index.html). Graphics were produced with R.
Ethics approvalThe project was approved by the Research Ethics Committee of the Ribeirão Preto Medical School, at the University of São Paulo, Brazil (process No. 11157/2008).
ResultsAfter exclusions, data from 7427 newborns (3682 boys) were analysed (Fig. 1). The sociodemographic and gestational characteristics of the women are depicted in Supplementary Table 1. Most had an education of up to 12 years and were married or cohabiting; 41.5% were non-white, and 44% were primiparous. The relatively high number of associated morbidities and the high caesarean section rate (58.5%) are consistent with a high-risk population.
.")
Anthropometric and body composition measures of newborns (RP-BRISA Cohort 2010).
| Characteristica | Boys | Girls | Total | |||
|---|---|---|---|---|---|---|
| (n = 3682) | (n = 3745) | (n = 7427) | ||||
| Gestational age at delivery, w | 38.27 | 2.11 | 38.39 | 2.00 | 38.33 | 2.06 |
| 24–27, n (%) | 20 | 0.54 | 13 | 0.35 | 33 | 0.44 |
| 28–31 | 35 | 0.95 | 35 | 0.93 | 70 | 0.94 |
| 32–36 | 396 | 10.76 | 358 | 9.56 | 754 | 10.15 |
| 37–42 | 3231 | 88.17 | 3339 | 89.16 | 6570 | 88.46 |
| Preterm birth (<37 w) | 451 | 12.25 | 406 | 10.84 | 857 | 11.53 |
| Birth Weight, g | 3214 | 540 | 3105 | 502 | 3160 | 524 |
| 24–27 w | 940 | 410 | 760 | 250 | 870 | 360 |
| 28–31 w | 1340 | 540 | 1530 | 560 | 1440 | 550 |
| 32–36 w | 2700 | 510 | 2570 | 500 | 2640 | 510 |
| 37–42 w | 3310 | 430 | 3190 | 410 | 3250 | 420 |
| Birth weight z-scoreb | 0.10 | 1.01 | 0.06 | 1.01 | 0.08 | 1.01 |
| Birth length, cm | 48.65 | 2.75 | 48.03 | 2.55 | 48.34 | 2.67 |
| Birth length z-scoreb | −0.15 | 1.09 | −0.19 | 1.12 | −0.17 | 1.11 |
| Head circumference, cm | 34.54 | 1.98 | 34.08 | 1.89 | 34.31 | 1.95 |
| Head circumference z-scoreb | 0.66 | 1.27 | 0.65 | 1.26 | 0.66 | 1.27 |
| Weight to length ratio, kg/m | 6.57 | 0.88 | 6.44 | 0.84 | 6.50 | 0.87 |
| Weight to length ratio z-score | 0.32 | 1.02 | 0.28 | 1.02 | 0.30 | 1.02 |
| BMI, kg/m2 | 13.47 | 1.45 | 13.37 | 1.46 | 13.42 | 1.45 |
| Ponderal index, kg/m3 | 27.70 | 2.82 | 27.85 | 2.94 | 27.77 | 2.88 |
| SGA, <3rd percentile | 67 | 1.82 | 72 | 1.92 | 139 | 1.87 |
| SGA, <10th percentile | 227 | 6.17 | 260 | 6.94 | 487 | 6.56 |
| LGA, >97th percentile | 176 | 4.78 | 166 | 4.43 | 342 | 4.60 |
| Stunting, <3rd percentile of birth length | 135 | 3.67 | 190 | 5.07 | 325 | 4.38 |
| Wasting, <3rd percentile of BMI | 39 | 1.06 | 44 | 1.17 | 83 | 1.12 |
| FGRc | ||||||
| Normal | 3060 | 83.11 | 2806 | 74.93 | 5866 | 78.98 |
| Mild | 466 | 12.66 | 681 | 18.18 | 1147 | 15.44 |
| Moderate | 67 | 1.82 | 150 | 4.01 | 217 | 2.92 |
| Severe | 89 | 2.42 | 108 | 2.88 | 197 | 2.65 |
| Fat mass, g | 339.14 | 147.33 | 379.78 | 141.37 | 359.64 | 145.76 |
| Percentage of body fat, % | 10.06 | 2.98 | 11.73 | 2.87 | 10.90 | 3.05 |
| Fat-free mass, g | 2879.50 | 414.74 | 2729.01 | 393.26 | 2798.84 | 414.84 |
SGA, small-for-gestational age; LGA, large-for-gestational age; FGR, foetal growth ratio.
Data are mean (SD) for continuous variables or absolute frequency (%) for categorical.
Table 1 shows detailed information about newborn anthropometric and body composition estimates, by sex. There were essentially equal proportions of male (49.6%) and female neonates (50.4%) in the study cohort. The preterm rate was 11.5%, almost all being late preterm (GA between 32 and 36 weeks). The frequencies of SGA (<3rd and <10th percentile) were 1.9% and 6.6%, respectively. There were 4.6% LGA, 4.4% stunting, 1.1% wasting, and 21.0% abnormal FGR. These results are compatible with a relatively well-nourished population during pregnancy.
However, when the growth phenotypes were analysed by GA, preterm birth showed higher proportions of SGA (<3rd and <10th percentiles), LGA, stunting, and abnormal FGR, compared with term infants (all p < 0.001), whereas no difference was observed for wasting (p = 0.593) (data not shown).
Newborn girls presented higher FM and BF%, and lower W/L and FFM than boys (all p < 0.001). Body composition by GA categories showed a gradual increase with maximal values at term, compared with preterm. Each weekly increment in GA corresponded to an additional 22.3 g in FM, 0.34% in BF%, and 139.6 g in FFM (Supplementary Table 2).
Wasted newborns had considerably lower FM values than non-wasted (83.8% difference), although the FFM differences were relatively modest (21.6% difference). On the other hand, although stunted newborns had overall lower body weights, they had a FM reduction of 47.8% compared with the non-stunted newborns (Supplementary Table 3).
We further explored the estimated body composition measures associated with preterm and term birth, SGA, LGA, stunting, and wasting, according to the IG-21st charts (Table 2).10 There was an increase in body composition measures in terms compared with preterm infants. Newborn SGA < 3rd had the lowest measures of body composition among the five growth phenotypes.
Estimation of body composition measures for preterm, term, SGA, LGA, stunting and wasting newborns (RP-BRISA Cohort 2010).
| W/L ratio, kg/m | FM, g | Percent body fat, % | Fat-free mass, g | |||||
|---|---|---|---|---|---|---|---|---|
| Preterm (n = 857) | 5.41 | 1.19 | 276.07 | 140.06 | 8.90 | 3.87 | 2179.21 | 572.38 |
| Term (n = 6570) | 6.65 | 0.70 | 378.19 | 126.84 | 11.16 | 2.82 | 2879.67 | 308.53 |
| SGA <3 (n = 139) | 4.65 | 1.10 | 97.64 | 47.13 | 3.77 | 2.55 | 2031.75 | 612.09 |
| SGA <10 (n = 487) | 5.25 | 0.88 | 158.66 | 65.26 | 5.76 | 2.32 | 2305.94 | 478.84 |
| LGA >97 (n = 342) | 7.78 | 0.90 | 615.25 | 126.02 | 16.52 | 2.51 | 3268.75 | 472.65 |
| Stunting (n = 325) | 5.56 | 1.27 | 249.93 | 153.96 | 7.41 | 4.12 | 2402.08 | 621.71 |
| Wasting (n = 83) | 4.94 | 0.67 | 103.25 | 59.44 | 4.34 | 2.04 | 2198.74 | 360.35 |
W/L, weight/length; SGA, small for gestational age, defined as <3rd or <10th centile of birth weight for gestational age; LGA, large for gestational age, defined as >97th centile of birth weight for gestational age; FM, fat mass; FFM, fat-free mass.
Data are mean (SD).
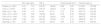
The RP-BRISA Cohort 3rd, 50th, and 97th percentile curves of W/L ratio were compared with the IG-21st curves by GA and sex (Fig. 2). In both sexes, the three percentiles of the RP-BRISA Cohort are higher than IG-21st between 33+0 and 40+6 weeks; then, the RP-BRISA percentiles cross the IG-21st curves and descend until week 42+6. In numerical terms, e.g. the divergence between RP-BRISA and IG-21st at the 3rd percentile was more pronounced among term newborns (37–41 weeks), where the average difference between the two populations (RP-BRISA vs IG-21st) was +0.99 kg/m for boys. Among preterm newborns (33–36 weeks), the average difference was less marked, with +0.35 kg/m for boys. In the post-term period (>42 weeks) the average difference was small, with −0.23 kg/m for boys. Similar results were observed for girls (data not shown).
, according to gestational age and sex (RP-BRISA Cohort 2010).")
Supplementary Fig. 1 presents the 3rd, 50th, and 97th centiles of estimated FM, BF%, and FFM according to GA and sex in the RP-BRISA Cohort. There was a large variability in FM and BF% values across GAs, all compatible with high-risk pregnancies. Conversely, FFM and W/L ratio increased with GA in a more linear way and with less variability than FM.
DiscussionThis study addresses the issue of body composition estimation in the neonate by commonly used measures of intrauterine growth, showing that: (i) W/L ratio percentiles of the RP-BRISA Cohort are higher than IG-21st before 41+6 weeks; (ii) FFM deposition per week has a dominant role compared with FM or BF%; (iii) body composition patterns at birth are only slightly different by sex; (iv) preterm newborns have less FM, FFM, and BF% than term newborns; (v) SGA <3rd centile and wasted infants had the lowest W/L ratio, FM, BF%, and FFM values at birth; (vi) there was very large variability in FM and BF% values across GAs; (vii) finally, we present reference charts for W/L ratio and estimated FM, FFM, and BF%, by GA and sex.
Although many anthropometric indices can be used in the assessment of neonatal nutritional status, reference values for Brazilian newborns are unavailable. The few Brazilian studies describing anthropometric measurements at birth had small sample sizes, studied predominantly white populations and did not provide reference curves for the common body composition indices by sex and GA,13 which improves our ability to generalize our findings.
W/L ratio correlates strongly with body fat stock and is the best morphometric measure of the nutritional component of intrauterine growth. This ratio can be used to predict metabolic complications, morbidity, and mortality in both term and preterm newborns.9,14,15 Villar et al.4 found that W/L ratio by GA at birth was systematically more closely correlated with the actual values of FM, FFM, and BF% than BMI or PI. We were unable to reproduce these correlations because our FM, BF%, and FFM values were estimated from regression models that included W/L ratio as an independent variable. On the other hand, a cohort study of 1027 infants in Colorado (USA) concluded that the W/L ratio was a poor surrogate for newborn adiposity.16 These conflicting findings may reflect different populations and different estimation methods. Another potential explanation is that inaccurate or inconsistent length assessment, due to the difficulties of working with newborns, could have contributed to a non-systematic measurement error, distorting the results of anthropometric indexes that rely on length.17
Although neonatal FM constituted only 14% of total birth weight, it accounted for 46% of its variance in newborns.6 Changes in foetal FM may reflect changes in the intrauterine environment, while changes in FFM may be more representative of genetic factors.18 Foetal fat deposition accelerates as a quadratic function, hence, foetal growth of FM and FFM follow unique patterns and offer an additional means to assess normal and abnormal growth.19 Lean body mass represents metabolically active tissue and is relatively stable in utero compared with the alterations in the maternal metabolic milieu. In contrast, foetal fat mass accumulation may be more sensitive to factors that affect foetal growth.18
One of the difficulties in estimating neonatal body composition is that a standard does not currently exist. All methods of neonatal body composition analysis have limitations.
Relatively few studies have addressed neonatal whole-body adiposity shortly after birth, especially before 38 weeks of gestation.10,20–22 In a small Chilean study, neonatal FM and BF% values were estimated according to Dauncey’s formula, and the results were very similar to our study.23 In a Brazilian study including 124 full-term newborns using air-displacement plethysmography, FM, BF%, and FFM were lower than in this study.24 On the other hand, in the IG-21st, the corresponding values for W/L ratio, FM, BF%, and FFM were similar to the present study.4 In a recent systematic revue using air displacement plethysmography, body components were very similar to our data.25
Given that infants in the present study at lower GAs have different body composition, including a near six-fold lower BF% than those born at term, it appears that even the best anthropometric proxies do not predict them equally well in early and late preterm infants.18
The increase in foetal weight late in pregnancy is mostly due to an increase in FFM in both sexes. In IG-21st, the mean increase in FFM was 162 g/week, which is greater than in the present study. This is attributable to the prescriptive design of IG-21st.26
The main limitation of this study was the risk of heterogeneity in data collection, primarily for GA and length, despite the comprehensive revision performed on the initial database aimed at identifying and excluding cases with gross discrepancies between morphometric data and GA. Nevertheless, some variability in these populations remained, mostly because of residual secular trends, true inter-ethnic differences, unstable estimations due to the small sample sizes at the extremes of gestational age, or simply differences in protocol implementation despite our best efforts to standardize the procedures across the study sites.
In conclusion, W/L ratio values of the RP-BRISA Cohort are higher than IG-21st. SGA (<3rd percentile) and wasted newborns showed the lowest W/L ratios and measures of body composition. The body composition references presented here could be used to refine the nutritional assessment of Brazilian newborns and to facilitate comparisons across populations.
FundingThis study was supported by the São Paulo State Research Support Foundation [grant number 08/53593-0].
Conflicts of interestThe authors declare no conflicts of interest.
The following is Supplementary data to this article:

Study conducted at the Departamento de Puericultura e Pediatria, Faculdade de Medicina de Ribeirão Preto, Universidade de São Paulo, Ribeirão Preto, SP, Brazil.


