


To compare the values of the markers for volumetric capnography and spirometry and their ability to classify children and adolescents with asthma, cystic fibrosis (CF), and healthy controls.
MethodsThis was a cross-sectional study that included 103 patients with controlled persistent allergic asthma, 53 with CF and a healthy control group with 40 volunteers (aged 6 to 15 years), of both sexes. The individuals underwent volumetric capnography and spirometry.
ResultsPhase III slope (SIII), SIII standardized by exhaled tidal volume (SIII/TV) and capnographic index (SIII/SII)×100 (KPIv) were different among the three groups assessed, with highest values for CF. The relation between the forced expiratory volume in one second and the forced vital capacity (FEV1/FVC) was the only spirometric marker that presented difference on the three groups. On individuals with normal spirometry, KPIv and FEV1/FVC were different among the three groups. The ROC curve identified the individuals with asthma or CF from the control group, both through volumetric capnography (better to identify CF in relation to the control using KPIv) and through spirometry (better to identify asthma in relation to the control). KPIv was the best parameter to distinguish asthma from CF, even in individuals with normal spirometry.
ConclusionVolumetric capnography and spirometry identified different alterations in lung function on asthma, CF, and healthy controls, allowing the three groups to be distinguished.
Comparar os valores dos marcadores para capnografia volumétrica e espirometria e sua capacidade de classificar crianças e adolescentes com asma, fibrose cística (FC) e controles saudáveis.
MétodosComparar os valores dos marcadores para capnografia volumétrica e espirometria e sua capacidade de classificar crianças e adolescentes com asma, fibrose cística (FC) e controles saudáveis.
MétodosFoi realizado um estudo transversal que incluiu 103 pacientes com asma alérgica persistente controlada, 53 com FC e um grupo controle saudável com 40 voluntários (6 a 15 anos), de ambos os sexos. Os indivíduos foram submetidos a capnografia volumétrica e espirometria.
ResultadosO slope da fase III (SIII), SIII padronizada pelo volume tidal exalado (SIII/VT) e o índice capnográfico (SIII/SII)×100 (KPIv) foram diferentes entre os três grupos avaliados, com maiores valores para o grupo FC. A relação entre o volume expiratório forçado no primeiro segundo e a capacidade vital forçada (VEF1/CVF) foi o único marcador de espirometria com diferenças nos três grupos. Nos indivíduos com espirometria normal, o KPIv e VEF1/CVF foram diferentes entre os três grupos. A curva ROC diferenciou os indivíduos com asma ou FC daqueles do grupo controle, ambos através da capnografia volumétrica (melhor para identificar a FC em relação aos controles pelo KPIv) e por meio da espirometria (melhor para identificar a asma em relação aos controles). O KPIv foi o melhor parâmetro para distinguir a asma da FC, mesmo em indivíduos com espirometria normal.
ConclusãoA capnografia volumétrica e a espirometria identificaram diferentes alterações de função pulmonar na asma, na FC e nos controles saudáveis, permitiram que os três grupos fossem diferenciados.
Asthma is among the most common chronic disease in children and adolescents; in turn, cystic fibrosis (CF) is little prevalent.1 Both chronic lung diseases (CF and asthma) present with airway obstruction, but each has a different pathophysiology. Several instruments have been studied and proposed to assess the anatomical and functional damage caused by both diseases. Volumetric capnography (VCap) allows the graphical analysis of the concentration pattern of carbon dioxide (CO2) in the exhaled air volume, representing the anatomical source of CO2. Three phases can be identified during VCap,2,3 including the phase III slope (SIII), which is directly correlated with the degree of variation on the ventilation/perfusion in pulmonary injury model and varies in a high number of diseases.4–7 For newborns, SIII can possibly identify preterm infants with bronchopulmonary dysplasia from preterm infants with no pulmonary disease.8 The angle between the slopes in phases II and III is known as capnographic index (KPIv) and can be used as a screening test for the severity of pulmonary disease in CF.9 When compared with other tests of pulmonary function evaluation, VCap has the advantage of being portable, non-invasive, not using expensive gases, and being performed with spontaneous breathing.10–12
Also, the authors had observed that the SIII standardized by the exhaled tidal volume (SIII/TV) is higher in children with asthma, and may reflect the in homogeneity of ventilation, suggesting chronic structural respiratory diseases. After the methacholine challenge test, SIII increased, and subsequently decreased after inhalation therapy with bronchodilator agents. This fact suggests the asynchronism on the emptying of the alveolar units due to the constrictor action of methacholine on the peripheral airways.10 An increase of the SIII value was observed on people with CF when compared with healthy children and adolescents. SIII values were higher in patients with normal spirometry, suggesting that VCap can identify patients with alterations in ventilation homogeneity very early.13
In hypothesis, the authors believe the VCap can pick up early pulmonary function abnormalities in the context of normal spirometry. Furthermore, while asthma is primarily an airway disease that can be described by spirometric abnormalities, CF is a mixed parenchymal/small airway disease that would be better described by VCap and in SIII of the capnogram. Thus, the objective of this study was to compare the markers for VCap and spirometry among children and adolescents with asthma, CF, and healthy controls. Moreover, the authors assessed the ability of the markers to identify to which group each individual belonged.
MethodsThis was a cross-sectional, analytical, observational, and non-randomized study, conducted for three years at the Pulmonary Function Laboratory (LAFIP) of the University of Campinas to complete the recruitment. The project was approved by the Research Ethics Committee of the Institution (No. 419/2005 and No. 430/2008). The guardians of the children signed an informed consent form.
The study included three groups of individuals: (i) 103 with controlled persistent allergic asthma (AAG); (ii) 53 with CF (CFG) – outside the period of pulmonary exacerbations; and (iii) 40 volunteers as healthy controls (HCG). Patients were aged from six to 15 years, of both sexes. They were followed-up at the Pediatric Pulmonology Outpatient Clinic from University Hospital of the institution and were recruited during routine visits. All the patients followed-up at the service were invited to participate in the study and only those who accepted to participate were included.
The diagnosis and classification of asthma followed the criteria of the Global Initiative for Asthma (GINA). Patients with asthma presented a dosage of serum immunoglobulin E greater than 180IU/mL on at least one blood sample, peripheral blood eosinophils >4%, and positive response to at least one tested antigen on skin tests of immediate hypersensitivity. The inclusion criteria for patients with asthma were those who used inhaled corticosteroid (budesonide) as dry powder at a dosage of 400–800mcg/day, and formoterol 12mcg twice/day, for at least 30 days. No patient had history of asthma attack requiring hospitalization in intensive care unit in the previous year, exacerbation or worsening of symptoms with need for increased use of inhaled bronchodilators or systemic corticosteroids for four weeks before the tests were performed.
The CF was diagnosed using the sweat test with stimulation of sweating through pilocarpine iontophoresis (at least two doses of chloride concentration greater than 60mEq/L) and/or identification of two cystic fibrosis transmembrane conductance regulator (CFTR) mutations recognized as pathogenic mutations.
The HCG was composed of healthy volunteers, with no history of active or passive smoking, without prior or current respiratory disease, who used no medication and had no known comorbidities. The individuals included presented no great difficulties to perform spirometry and VCap.
The clinical characteristics of the participants were documented by the medical staff during the visits to perform the spirometry and VCap.
Volumetric capnographyTo perform the VCap, the respiratory profile monitor CO2SMO Plus® model DX-8100 (Novametrix, Wallingford, USA) was used; the software Analysis Plus (Oasis Analysis Plus®, MS, USA) was used to register the measurements and curves of the VCap. Participants were asked to sit with their back to the monitor, to use a nasal clip, and to breath through the mouthpiece. VCap markers were recorded for five minutes after observing the normalization of the respiratory pattern, and an offline sequence of the respiratory cycles of patients was selected after the collection, excluding the cycles of the first minute, considering it as a period of adaptation of the individual. After that procedure, the respiratory cycles that showed irregular patterns of the VCap curve, such as the absence of the plateau due to air leak or depression of the plateau due to cough, were excluded. The cycles in which the TV variation was greater or less than 25% of the average and in which the exhaled CO2 was greater or less than 5% of the average were also excluded.10,13,14
The average of the markers of the remaining cycles were calculated and considered as the final result. Three phases can be identified during VCap: phase I corresponds to the anatomic dead space; phase II, to a rapid increase of CO2; phase III, to the formation of the plateau of exhaled CO2 corresponding to the alveolar air volume.2,3 The markers analyzed were: SII and SIII. The capnographic index [(SIII/SII)×100] (KPIv) was also used.8,9,15 The normalization of SII and SIII by TV (SII/TV and SIII/TV) was performed to compensate for variations on the size of the individuals.
SpirometryFor the evaluation of spirometry the spirometer CPFS/D and the BREEZE PF® version 3.8 B software (MedGraphics, MN, USA) were used. The screening was performed according to the recommendations of the European Respiratory Society and American Thoracic Society.16 Patients were instructed not to use bronchodilators of short or long duration for 12h before the exam. The spirometry markers were adjusted to the Z-score using the GLI2012 software provided by the Global Lung initiative (GLI) of the European Respiratory Society.17 The following markers were used in this study: forced vital capacity (FVC), forced expiratory volume in one second of the FVC (FEV1), index of obstruction (FEV1/FVC), and forced expiratory flow between 25% and 75% of the FVC (FEF25–75%), expressed as Z-score and predicted percentage.
Statistical analysisComparisons between independent markers without normal distribution were performed using the Mann–Whitney test.
The receiver operating characteristic (ROC) curve and the area under the ROC curve (AUC) were calculated to assess the potential of the spirometry and VCap markers to identify patients with asthma from healthy controls, patients with CF from healthy controls, and between patients with CF from those with asthma. VCap markers that were different in the three groups in the association study were used for the analysis of the ROC curve.
The predicted percentage was used due to its extensive use in clinical practice.18 Values below 80% of the predicted for spirometry markers were considered to be below the lower limit of normal (LLN). The Z-scores of the VCap markers for the HCG were calculated. The LLN and the upper limit of normal (ULN) for the VCap markers were considered as <−2 and >+2 of the HCG Z-score. A subgroup of individuals from the three groups was considered to have “normal” spirometry, using as inclusion criteria the results of FVC, FEV1, and FEV1/FVC greater than the LLN (at least 80% of the predicted to all these markers from spirometry).
To compare the groups and analyze the ROC curve, SPSS (SPSS Inc., Statistical Package for Social Sciences, version 16.0, Chicago, IL, USA) was used. The value of alpha adopted was of 0.05.
The graphs for median and confidence interval were performed using MedCalc 16.4.3 (MedCalc Software bvba – Ostend, Belgium; https://www.medcalc.org, 2016).
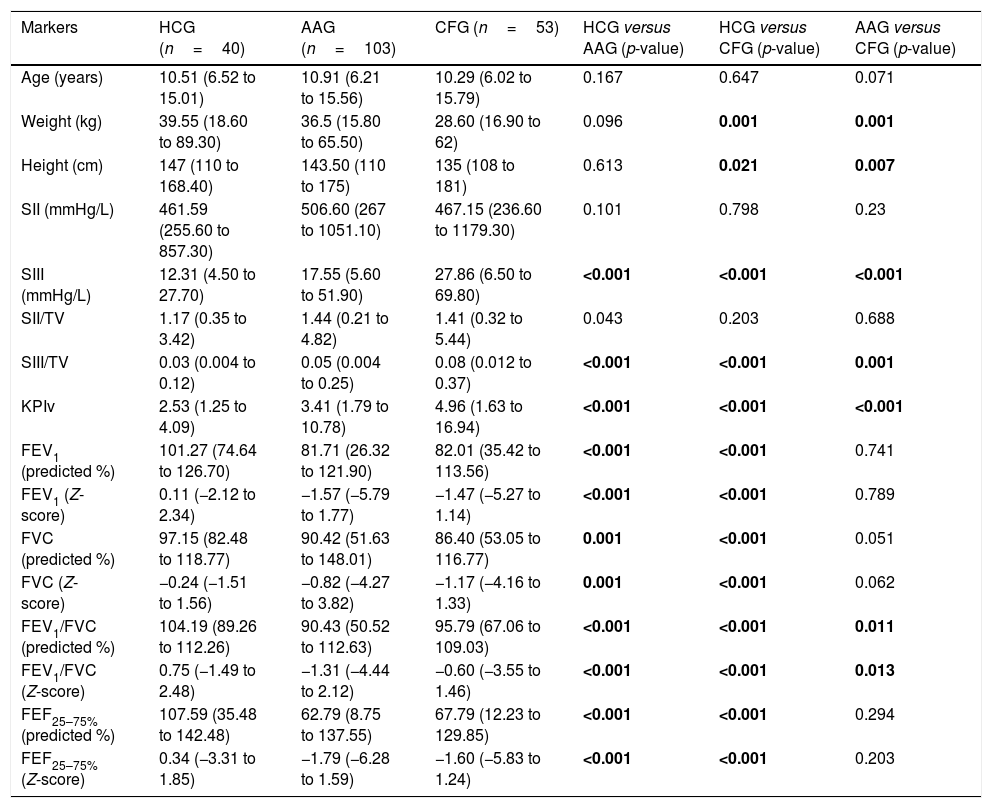
ResultsThe descriptive analysis of the anthropometric variables and data obtained from the VCap and spirometry between AAG, CFG and HCG are presented in Table 1 and Fig. 1. CF patients had smaller height and weight when compared with healthy controls and patients with asthma. The SIII, SIII/TV, and KPIv were higher in the groups of respiratory diseases in relation to the control group, being worse in the CFG. Only the FEV1/FVC presented the same degree of evidence (p-value <0.05), with the lowest values on the AAG. With the exception of SII, the other markers of VCap and all markers of spirometry separated the HCG from the AAG and CFG (p-value <0.05).
Association of anthropometric variables and data obtained through volumetric capnography and spirometry between the healthy control group (HCG) and patients with asthma (AAG) or cystic fibrosis (CFG).
| Markers | HCG (n=40) | AAG (n=103) | CFG (n=53) | HCG versus AAG (p-value) | HCG versus CFG (p-value) | AAG versus CFG (p-value) |
|---|---|---|---|---|---|---|
| Age (years) | 10.51 (6.52 to 15.01) | 10.91 (6.21 to 15.56) | 10.29 (6.02 to 15.79) | 0.167 | 0.647 | 0.071 |
| Weight (kg) | 39.55 (18.60 to 89.30) | 36.5 (15.80 to 65.50) | 28.60 (16.90 to 62) | 0.096 | 0.001 | 0.001 |
| Height (cm) | 147 (110 to 168.40) | 143.50 (110 to 175) | 135 (108 to 181) | 0.613 | 0.021 | 0.007 |
| SII (mmHg/L) | 461.59 (255.60 to 857.30) | 506.60 (267 to 1051.10) | 467.15 (236.60 to 1179.30) | 0.101 | 0.798 | 0.23 |
| SIII (mmHg/L) | 12.31 (4.50 to 27.70) | 17.55 (5.60 to 51.90) | 27.86 (6.50 to 69.80) | <0.001 | <0.001 | <0.001 |
| SII/TV | 1.17 (0.35 to 3.42) | 1.44 (0.21 to 4.82) | 1.41 (0.32 to 5.44) | 0.043 | 0.203 | 0.688 |
| SIII/TV | 0.03 (0.004 to 0.12) | 0.05 (0.004 to 0.25) | 0.08 (0.012 to 0.37) | <0.001 | <0.001 | 0.001 |
| KPIv | 2.53 (1.25 to 4.09) | 3.41 (1.79 to 10.78) | 4.96 (1.63 to 16.94) | <0.001 | <0.001 | <0.001 |
| FEV1 (predicted %) | 101.27 (74.64 to 126.70) | 81.71 (26.32 to 121.90) | 82.01 (35.42 to 113.56) | <0.001 | <0.001 | 0.741 |
| FEV1 (Z-score) | 0.11 (−2.12 to 2.34) | −1.57 (−5.79 to 1.77) | −1.47 (−5.27 to 1.14) | <0.001 | <0.001 | 0.789 |
| FVC (predicted %) | 97.15 (82.48 to 118.77) | 90.42 (51.63 to 148.01) | 86.40 (53.05 to 116.77) | 0.001 | <0.001 | 0.051 |
| FVC (Z-score) | −0.24 (−1.51 to 1.56) | −0.82 (−4.27 to 3.82) | −1.17 (−4.16 to 1.33) | 0.001 | <0.001 | 0.062 |
| FEV1/FVC (predicted %) | 104.19 (89.26 to 112.26) | 90.43 (50.52 to 112.63) | 95.79 (67.06 to 109.03) | <0.001 | <0.001 | 0.011 |
| FEV1/FVC (Z-score) | 0.75 (−1.49 to 2.48) | −1.31 (−4.44 to 2.12) | −0.60 (−3.55 to 1.46) | <0.001 | <0.001 | 0.013 |
| FEF25–75% (predicted %) | 107.59 (35.48 to 142.48) | 62.79 (8.75 to 137.55) | 67.79 (12.23 to 129.85) | <0.001 | <0.001 | 0.294 |
| FEF25–75% (Z-score) | 0.34 (−3.31 to 1.85) | −1.79 (−6.28 to 1.59) | −1.60 (−5.83 to 1.24) | <0.001 | <0.001 | 0.203 |
| Individuals with normal spirometry values | ||||||
|---|---|---|---|---|---|---|
| Markers | HCG (n=39) | AAG (n=57) | CFG (n=28) | HCG versus AAG (p-value) | HCG versus CFG (p-value) | AAG versus CFG (p-value) |
| SIII (mmHg/L) | 12.31 (4.53 to 27.73) | 16.88 (6.78 to 37.85) | 21.77 (6.46 to 56.82) | <0.001 | <0.001 | 0.065 |
| SIII/TV | 0.03 (0.004 to 0.13) | 0.05 (0.01 to 0.18) | 0.08 (0.01 to 0.32) | <0.001 | 0.001 | 0.350 |
| KPIv | 2.55 (1.25 to 4.09) | 3.14 (1.79 to 10.78) | 4.47 (1.63 to 14.33) | 0.002 | <0.001 | 0.003 |
| FEV1 (predicted %) | 101.41 (84.27 to 126.70) | 90.93 (80.23 to 121.90) | 92.78 (80.65 to 113.56) | <0.001 | 0.003 | 0.779 |
| FEV1 (Z-score) | 0.13 (−1.30 to 2.34) | −0.75 (−1.67 to 1.77) | −0.61 (−1.67 to 1.14) | <0.001 | 0.003 | 0.793 |
| FVC (predicted %) | 97.25 (82.48 to 118.77) | 95.79 (80.14 to 148.01) | 92.15 (81.70 to 112.46) | 0.389 | 0.069 | 0.266 |
| FVC (Z-score) | −0.23 (−1.51 to 1.56) | −0.37 (−1.65 to 3.82) | −0.67 (−1.57 to 1) | 0.389 | 0.071 | 0.282 |
| FEV1/FVC (predicted %) | 104.31 (90.67 to 112.26) | 95.23 (80.58 to 112.63) | 99.67 (90.30 to 109.03) | <0.001 | 0.005 | 0.006 |
| FEV1/FVC (Z-score) | 0.77 (−1.27 to 2.48) | −0.69 (−2.32 to 2.12) | −0.06 (−1.37 to 1.46) | <0.001 | 0.005 | 0.007 |
| FEF25–75% (predicted %) | 108.20 (63.49 to 142.48) | 82.61 (63.28 to 135.56) | 90.56 (72.94 to 129.85) | <0.001 | 0.221 | 0.081 |
| FEF25–75% (Z-score) | 0.35 (−1.64 to 1.85) | −0.78 (−1.64 to 1.59) | −0.42 (−1.19 to 1.24) | <0.001 | 0.204 | 0.069 |
| Area under the curve for volumetric capnography and spirometry between control group (HCG; n=40), group of patients with asthma (AAG; n=103) and group of patients with cystic fibrosis (CFG; n=53) | ||||||
|---|---|---|---|---|---|---|
| Markers | HCG versus CFG | HCG versus CFG | AAG versus CFG | HCG versus AAG (p-value) | HCG versus CFG (p-value) | AAG versus CFG (p-value) |
| SIII (mmHg/L) | 0.782a | 0.899a | 0.722a | <0.001 | <0.001 | <0.001 |
| SIII/TV | 0.732a | 0.831a | 0.660a | <0.001 | <0.001 | 0.001 |
| KPIv | 0.737a | 0.927a | 0.763a | <0.001 | <0.001 | <0.001 |
| FEV1 (predicted %) | 0.836b | 0.836b | 0.516b | <0.001 | <0.001 | 0.741 |
| FEV1 (Z-score) | 0.839b | 0.838b | 0.513b | <0.001 | <0.001 | 0.789 |
| FVC (predicted %) | 0.685b | 0.756b | 0.596b | 0.001 | <0.001 | 0.051 |
| FVC (Z-score) | 0.686b | 0.754b | 0.591b | 0.001 | <0.001 | 0.062 |
| FEV1/FVC (predicted %) | 0.863b | 0.799b | 0.624a | <0.001 | <0.001 | 0.011 |
| FEV1/FVC (Z-score) | 0.864b | 0.800b | 0.622a | <0.001 | <0.001 | 0.013 |
| FEF25–75% (predicted %) | 0.839b | 0.778b | 0.551a | <0.001 | <0.001 | 0.294 |
| FEF25–75% (Z-score) | 0.843b | 0.780b | 0.562a | <0.001 | <0.001 | 0.203 |
| Patients with normal spirometry. HCG (n=39), AAG (n=57) and CFG (n=28) | ||||||
|---|---|---|---|---|---|---|
| Markers | HCG versus CFG | HCG versus CFG | AAG versus CFG | HCG versus AAG (p-value) | HCG versus CFG(p-value) | AAG versus CFG(p-value) |
| SIII (mmHg/L) | 0.768a | 0.822a | 0.623a | <0.001 | <0.001 | 0.065 |
| SIII/TV | 0.730a | 0.742a | 0.563a | <0.001 | 0.001 | 0.350 |
| KPIv | 0.686a | 0.866a | 0.702a | 0.002 | <0.001 | 0.003 |
| FEV1 (predicted %) | 0.726b | 0.712b | 0.519b | <0.001 | 0.003 | 0.779 |
| FEV1 (Z-score) | 0.732b | 0.717b | 0.518b | <0.001 | 0.003 | 0.793 |
| FVC (predicted %) | 0.552b | 0.631b | 0.575b | 0.389 | 0.069 | 0.266 |
| FVC (Z-score) | 0.552b | 0.630b | 0.572b | 0.389 | 0.071 | 0.282 |
| FEV1/FVC (predicted %) | 0.814b | 0.702b | 0.683a | <0.001 | 0.005 | 0.006 |
| FEV1/FVC (Z-score) | 0.815b | 0.701b | 0.681a | <0.001 | 0.005 | 0.007 |
| FEF25a75% (predicted %) | 0.740b | 0.596b | 0.634a | <0.001 | 0.221 | 0.081 |
| FEF25a75% (Z-score) | 0.745b | 0.600b | 0.640a | <0.001 | 0.204 | 0.069 |
kg, kilogram; cm, centimeter; mL, milliliters; mmHg, millimeters of mercury; L, liters; TV, exhaled tidal volume; SII, phase II slope; SIII, phase III slope; KPIv, ratio between the SII and the SIII multiplied by 100; FEV1, forced expiratory volume in one second of the FVC; FVC, forced vital capacity; FEF25–75%, forced expiratory flow between 25% and 75% of the FVC. Data are presented as median (minimum–maximum). Statistical analysis was performed using the Mann–Whitney test, and the authors compared two groups each time. Alpha=0.05. p-Values with positive association are presented in bold. The area under the curve was measured by the ROC curve.
 and patients with asthma (n=103), and cystic fibrosis (n=53). Data presented by the median (red dot) and 95% confidence interval (green intersection). (A) SIII (healthy control) 12.08; (asthma) 17.55; (cystic fibrosis – CFG) 27.86. (B) SIII/TV: SIII: (healthy control) 0.03; (asthma) 0.05; (CFG) 0.08. (C). KPIv: (healthy control) 2.53; (asthma) 3.41; (CFG) 4.96. Data are presented as median. Alpha=0.05. All data presented p-value with positive association (p-value<0.05). The SII and SIII are presented in mmHg, millimeters of mercury. Statistical analysis was performed using the Mann–Whitney test, and the authors compared two groups each time. mmHg, millimeters of mercury; L, liters; TV, exhaled tidal volume; SII, phase II slope; SIII, phase III slope; KPIv, ratio between the SII and SIII multiplied by 100.")
Association of the parameters measured in volumetric capnography between healthy control individuals (n=40) and patients with asthma (n=103), and cystic fibrosis (n=53). Data presented by the median (red dot) and 95% confidence interval (green intersection). (A) SIII (healthy control) 12.08; (asthma) 17.55; (cystic fibrosis – CFG) 27.86. (B) SIII/TV: SIII: (healthy control) 0.03; (asthma) 0.05; (CFG) 0.08. (C). KPIv: (healthy control) 2.53; (asthma) 3.41; (CFG) 4.96. Data are presented as median. Alpha=0.05. All data presented p-value with positive association (p-value<0.05). The SII and SIII are presented in mmHg, millimeters of mercury. Statistical analysis was performed using the Mann–Whitney test, and the authors compared two groups each time. mmHg, millimeters of mercury; L, liters; TV, exhaled tidal volume; SII, phase II slope; SIII, phase III slope; KPIv, ratio between the SII and SIII multiplied by 100.
The analysis of individuals with normal spirometry evidenced that, with the exception of FVC, all markers were different between the HCG and patients (AAG and CFG). However, only the values of KPIv (higher on the CFG) and FEV1/FVC (lower on the AAG) were different between the AAG and CFG.
The AUC for the VCap and spirometry between the HCG and patients (AAG and CFG), as well as between the AAG and CFG, are presented in Table 1 and Fig. 2. On the discrimination of the HCG from the AAG, the markers were different (p-value <0.05); however, only FEV1 and FEV1/FVC presented AUC values greater than 0.800.
, the group of patients with asthma (AAG, n=103), and the group of patients with cystic fibrosis (CFG, n=53). TV, exhaled tidal volume; SIII, phase III slope; KPIv, ratio between the SII and SIII multiplied by 100; FEV1, forced expiratory volume in one second of the FVC; FVC, forced vital capacity; FEF25–75%, forced expiratory flow between 25% and 75% of the FVC.")
Area under the curve for volumetric capnography and spirometry between the control group (HCG, n=40), the group of patients with asthma (AAG, n=103), and the group of patients with cystic fibrosis (CFG, n=53). TV, exhaled tidal volume; SIII, phase III slope; KPIv, ratio between the SII and SIII multiplied by 100; FEV1, forced expiratory volume in one second of the FVC; FVC, forced vital capacity; FEF25–75%, forced expiratory flow between 25% and 75% of the FVC.
On the discrimination of the HCG from the CFG, the markers presented differences between the groups (p-value <0.05), with the highest AUC value for FEV1/FVC and VCap markers; the highest AUC value was observed for KPIv (0.900). Similarly, the VCap and FEV1/FVC markers differentiated the AAG and CFG, and KPIv presented the highest AUC value (0.763).
When the individuals with normal spirometry were evaluated, the VCap presented AUC values capable of discriminating the HCG from the AAG (SIII=0.768, p-value <0.001; SIII/TV=0.730, p-value <0.001; KPIv=0.686, p-value=0.002); as well as the HCG from the CFG (KPIv=0.866, p-value <0.001; SIII=0.822, p-value <0.001; SIII/TV=0.742, p-value=0.001). The AUCs that differentiated the HCG from the AAG in spirometry were: FEV1/FVC (predicted %)=0.814 (p-value<0.001) and FEV1 (predicted %)=0.726 (p-value<0.001). Between the HCG and CFG, the FEV1 and FEV1/FVC (predicted %) values were different (p-value<0.05; AUC=0.712 and 0.702, respectively).
The discrimination of the AAG from the CFG in individuals with normal spirometry was done by KPIv (AUC=0.702, p-value=0.003) and FEV1/FVC (%) (AUC=0.683, p-value=0.006).
Fig. 3 presents the relation between spirometry and KPIv markers on the three groups studied.
 and patients with asthma (n=103) or cystic fibrosis (n=53), considering the distinction between spirometry markers above and below the LLN (80%) and KPIv above and below the ULN (KPIv=4.23). (A) KPIv versus FEV1 (predicted %). (B) KPIv versus FVC (predicted %). (C) KPIv versus FEV1/FVC (predicted %). (D) KPIv versus FEF25–75% (predicted %). Each graph is divided into four quadrants corresponding to the following conditions: Altered KPIv and spirometry marker; altered KPIv and normal spirometry marker; normal KPIv and altered spirometry marker; normal KPIv and spirometry marker. KPIv, ratio between the SII and SIII multiplied by 100; FEV1, forced expiratory volume in one second of the FVC; FVC, forced vital capacity; FEF25–75%, forced expiratory flow between 25% and 75% of the FVC; LLN, lower limit of normal; ULN, upper limit of normal. Black circle, healthy control individuals; green circle, patients with asthma; red triangle, patients with cystic fibrosis.")
Association of KPIv on volumetric capnography with spirometry markers between healthy control individuals (n=40) and patients with asthma (n=103) or cystic fibrosis (n=53), considering the distinction between spirometry markers above and below the LLN (80%) and KPIv above and below the ULN (KPIv=4.23). (A) KPIv versus FEV1 (predicted %). (B) KPIv versus FVC (predicted %). (C) KPIv versus FEV1/FVC (predicted %). (D) KPIv versus FEF25–75% (predicted %). Each graph is divided into four quadrants corresponding to the following conditions: Altered KPIv and spirometry marker; altered KPIv and normal spirometry marker; normal KPIv and altered spirometry marker; normal KPIv and spirometry marker. KPIv, ratio between the SII and SIII multiplied by 100; FEV1, forced expiratory volume in one second of the FVC; FVC, forced vital capacity; FEF25–75%, forced expiratory flow between 25% and 75% of the FVC; LLN, lower limit of normal; ULN, upper limit of normal. Black circle, healthy control individuals; green circle, patients with asthma; red triangle, patients with cystic fibrosis.
To the best of the authors’ knowledge, no other studies assessed the ability of the VCap markers to discriminate individuals with asthma from individuals with CF and healthy controls, in comparison to spirometry markers. Moreover, an unprecedented and robust finding was that SIII, SIII/TV and KPIv were different among the three groups assessed, with highest values for CF. The FEV1/FVC was the only marker of spirometry with difference on the three groups. In addition, on individuals with normal spirometry, KPIv, and FEV1/FVC were different among the three groups. Moreover, the ROC curve identified the individuals with asthma or CF from the control group, both through VCap (better to identify CF in relation to the control using KPIv) and spirometry (better to identify asthma in relation to the control). KPIv was the best parameter to distinguish asthma from CF, even in individuals with normal spirometry.
The search for methods to evaluate pulmonary function in children and adolescents with chronic lung diseases with airway obstruction is a constant struggle in the scientific community. Spirometry is the most used instrument for randomized clinical trials as primary outcome.19–22 However, the use of spirometry will always be criticized, despite its importance, mainly due to the large intrapersonal variability and the lack of equations for distinct populations. Therefore, comparing spirometry to other methods is promising.
Children present numerous chronic lung diseases with airway obstruction, and each of them presents greater or lesser degrees of inflammation and bronchial reactivity on upper and/or lower airways.1 Each assessment instrument will most likely have greater or lesser effectiveness depending on the chronic lung disease, as shown in Fig. 3 for VCap and spirometry. The search to characterize the usefulness of these methods focuses on finding anatomical (computed tomography of the thorax) and functional (spirometry, impulse oscillometry system, lung clereance index [LCI], and plestimography, among others) alterations. Among the diseases included in the present study, asthma differs from CF considering the initial predominance of obstruction, maintenance, and progression of the fixed airway obstruction. Asthma affects the larger airways; if left untreated, progresses to the smaller airways.23 In turn, the opposite happens in CF: the disease starts on the small airways and progresses toward the large airways.24 These findings are illustrated in Fig. 3.
VCap slopes assess the volumetric part of the airways, where the movement of gases occurs by diffusion. Conversely, spirometry better evaluates flow alterations on the conducting airways, as the movement of gases in this region is more intense due to convection. Therefore, it was expected that there were differences between the results of these instruments on the evaluation of the numerous chronic lung diseases with airway obstruction in children, resulting from compromises in proximal or distal airways.
Gustafsson et al. compared asthma and CF using LCI and spirometry; their results, as well as the present results, suggest that the airway alterations in CF affect the lung periphery more extensively than in asthma.25 Moreover, Fuchs et al. presented the association between KPIv from VCap and LCI.9 In the present data, differences were observed between spirometry and VCap in the HCG, AAG, and CFG, as well as the presence of concurrently altered spirometry and KPIv in the CFG. Additionally, normal spirometry occurred in the CFG and AAG (as well as in the HCG group). Numerous patients with CF and normal spirometry presented altered KPIv, suggesting that the alterations assessed by VCap can occur earlier than in spirometry; this fact was previously documented regarding other VCap markers and LCI.13,26 A similar behavior was observed between the LCI and FEV1 in CF.27 In turn, patients with asthma may present altered spirometry with normal KPIv, suggesting that flow alterations are more frequent and affect the proximal airways. Patients with asthma who present normal spirometry and altered KPIv would be harder to explain. These individuals could present less known phenotypes that should be assessed with functional and inflammatory biomarkers to characterize the type of asthma.
To highlight the importance of VCap on the assessment of pulmonary diseases versus spirometry, the authors used the ROC curve to discriminate between the different groups. In the present data, VCap was proven to be a useful instrument to differentiate patients with CF from healthy controls (on both adults and children)6,13 and to differentiate children, adolescents, and adults with asthma from their healthy peers.10,28
The spirometry markers (FEV1 and FEV1/FVC) were better than the VCap to differentiate the AAG and HCG on the ROC curve. Conversely, VCap markers presented a greater AUC to distinguish CFG and HCG. O’Neal et al. found a higher AUC with LCI than with spirometry, when differentiating CF and healthy controls.18
Spirometry and VCap were effective to differentiate healthy individuals from patients with pulmonary disease. Regarding the difference between AAG and CFG, only KPIv and FEV1/FVC were significant, and KPIv was higher (AUC>0.700).
When evaluating the individuals with normal spirometry, VCap markers indicated a greater compromise of the ventilation homogeneity on CF and AAG compared to the control group. However, VCap was better than spirometry to differentiate the HCG from the CFG. In this situation, VCap was also better than spirometry to discriminate between the CFG and AAG, considering an AUC≥0.700.
The present study had some limitations: (i) it did not have a prospective design and the VCap measures were not repeated; (ii) VCap is limited to assess clinimetric properties and this does not change the perception of the potential of VCap as clinical and scientific instrument in the context of pulmonary diseases in pediatrics; (iii) the sample size was chosen by convenience; and (iv) only one center was enrolled.
In conclusion, the present study showed that the SIII, SIII/TV, and KPIv obtained from VCap, and the FEV1 and FEV1/FVC from spirometry, were good markers to discriminate the HCG from AAG and CFG. The authors believe that for each chronic lung diseases with airway obstruction, different markers of pulmonary function deterioration will be more useful. Finally, VCap can describe earlier and more accurately the pathophysiology of CF than spirometry.
Conflicts of interestThe authors declare no conflicts of interest.
FALM: Fundação de Amparo à Pesquisa do Estado de São Paulo (FAPESP) for research grants and scholarships #2011/12939-4, #2011/18845-1, #2015/12183-8 and #2015/12858-5; Fundo de Apoio à Pesquisa, ao Ensino e à Extensão da Universidade Estadual de Campinas for research support #0648/2015; JDR: FAPESP for research assistance 2011/18845-1 and #2015/12183-8.
To Luciana Montes Rezende, Luciana Cardoso Bonadia, Maria de Fátima Corrêa Pimenta Servidoni, Carlos Emílio Levy, Adressa Oliveira Peixoto, Adyléia Aparecida Contrera Dalbo Toro, Renan Marrichi Mauch, Roberto José Negrão Nogueira, Eulália Sakano, Antônio Fernando Ribeiro, Carla Cristina de Souza Gomez, Elizete Aparecida Lomazi, Paloma Lopes Francisco Parazzi, Larissa Lazzarini Furlan, Emília da Silva Gonçalves, Aline Cristina Gonçalves, Milena Baptistella Grotta Silva, and Alethea Guimarães Faria, who contribute to studies carried out on cystic fibrosis in our reference center.
Please cite this article as: Almeida-Junior A, Marson FA, Almeida CC, Ribeiro MÂ, Paschoal IA, Moreira MM, et al. Volumetric capnography versus spirometry for the evaluation of pulmonary function in cystic fibrosis and allergic asthma. J Pediatr (Rio J). 2020;96:255–63.
The study was performed at the Laboratório de Fisiologia Pulmonar (Lafip), Centro de Investigação em Pediatria (Ciped), Faculdade de Ciências Médicas, Universidade Estadual de Campinas, Campinas, SP, Brazil.


