To evaluate the validity of the triage system CLARIPED in a pediatric population in the city of São Paulo, Brazil.
MethodsProspective, observational study in a secondary-level pediatric emergency service from Sep-2018 to Ago-2019. A convenience sample of all patients aged 0–18 years triaged by the computerized CLARIPED system was selected. Associations between urgency levels and patient outcomes were analyzed to assess construct validity. Sensitivity, specificity, and positive and negative predictive values (PPV and NPV) to identify the most urgent patients were estimated, as well as under-triage and over-triage rates.
ResultsThe distribution of 24,338 visits was: RED 0.02%, ORANGE 0.9%, YELLOW 23.5%, GREEN 47.9%, and BLUE 27.7% (highest to the lowest level of urgency). The frequency of the following outcomes increased with increasing urgency: hospital admission (0.0%, 0.02%, 0.1%, 7.1% and 20%); stay in ED observation room (1.9%, 2,4%, 4.8%, 24.1%, 60%); use of ≥ 2 diagnostic/therapeutic resources (2.3%, 3.0%, 5.9%, 28.8%, 40%); ED length of stay (12, 12, 15, 99.5, 362 min). The most urgent patients (RED, ORANGE, and YELLOW) exhibited higher chances of using ≥ 2 resources (OR 2.55; 95%CI: 2.23–2.92) or of being hospitalized (OR 23.9; 95%CI: 7.17–79.62), compared to the least urgent (GREEN and BLUE). The sensitivity to identify urgency was 0.88 (95%CI: 0.70–0.98); specificity, 0.76 (95%CI: 0.75–0.76); NPV, 0.99 (95%CI: 0.99–1.00); overtriage rate, 23.0%, and undertriage, 11.5%.
ConclusionThis study corroborates the validity and safety of CLARIPED, demonstrating significant correlations with clinical outcomes, good sensitivity, and low undertriage rate in a secondary-level Brazilian pediatric emergency service.
Emergency triage scales aim to optimize patients' waiting time according to their degree of urgency and reduce the negative impact of delayed medical care on the prognosis of patients.1,2 However, triage in the pediatric population is a complex and challenging task. The limited communication skills, variability of vital signs (VS) according to age, and subclinical presentations in young children, among other factors, pose many challenges to pediatric triage. 3
Currently, the most used five-level triage systems in the world for adult and pediatric populations are the Australian Screening Scale (ATS), the Canadian Screening and Acuity Scale (CTAS), the Manchester Screening System (MTS), and the Emergency Severity Index (ESI).1,4 They were primarily developed for adults and posteriorly adapted for children. Their performance in the pediatric population is better in the countries where they were created than in other countries.5 Besides, there are no valid studies of these instruments in children in low-middle-income countries. Some are too complex or extensive, and others lack specific discriminators for children. Implementing these instruments for pediatric emergency care in Brazil on a large scale would require an intense training program and significant investments, with the possibility of low adherence and performance.
`In Brazil, the Ministry of Health guideline for Risk Classification has been available since 2004,6 but it is a four-level system and does not contemplate the pediatric population. The 2014 resolution of the Federal Council of Medicine7 makes implementing a valid risk classification scale mandatory in urgent and emergency services. Yet, the use of triage systems in Brazil is still incipient and based on local preferences.8
To fill this gap, the CLARIPED System was developed between 2012 and 2013 by a group of emergency pediatric physicians and nurses from Rio de Janeiro, with a collaboration between the D'Or Institute for Research and Education (IDOR) and the State University of Rio de Janeiro (UERJ). The first version of the tool, for manual application, proved to be valid and reliable in a pediatric population aged 0 to 18 who visited the emergency department of a private tertiary hospital in Rio de Janeiro. Since then, a computerized version has been developed and adopted in other public and private services in the city of Rio de Janeiro, as well as in other cities (São Paulo and Belo Horizonte). A few modifications were incorporated overtime at the request of CLARIPED users to improve the discriminative capacity of the tool. In 2021, a second validity study of the third and current computerized version of CLARIPED carried out in another private tertiary hospital's emergency service in Rio de Janeiro showed an even better discriminative capacity than the manual version (10). This study aimed to evaluate the validity of the computerized CLARIPED system in secondary-level emergency service in the city of São Paulo.
Materials and methodsStudy design, participants, and settingThis prospective, observational study was conducted in a private secondary-level pediatric emergency service situated in the city of São Paulo, Brazil, with the following structure: emergency unit, pediatric specialties outpatient clinic, and vaccination unit. The emergency unit attends an average of 30,000 patient visits aged 0 to 18 years per year. It has the following facilities: reception with waiting and triage rooms, medical offices, a medication room, an inhalation room, and an observation room with five beds. The emergency unit performs simple X-rays but no laboratory tests or more complex images. If additional exams are necessary to define the patient's condition, the patient is referred by their own means to a referral hospital; or if hospitalization is indicated, the patient is transferred by ambulance to the referral hospital. A convenience sample of all patients aged 0 to 18, triaged by the computerized CLARIPED system from September 1, 2018, to August 31, 2019, was selected. The Research Ethics Committee of the D'Or Institute for Research and Education (IDOR) approved the study under No. 2,665,936.
CLARIPEDThe CLARIPED recommends a 2 to 5-minutes-long triage process performed by a registered nurse, using two steps. The first one involves six objective questions related to demographics, drug allergies, and complaints, followed by measuring four vital signs (respiratory rate, heart rate, oxygen saturation, and cutaneous temperature) to calculate the pediatric vital signs score (VIPE score). The VIPE score ranges from 0 to 12 and is classified into five levels of urgency defined by colors: 0 = BLUE [no urgency]; 1–2 = GREEN [little urgent]; 3–5 = YELLOW [urgent]; 6–9 = ORANGE [very urgent] and 10–12 = RED [emergency]. The second step involves the identification of discriminators of urgency consisting of predetermined signs, symptoms, and complaints, also distributed in five levels of urgency defined by the same colors. If a discriminator corresponding to a higher level than the one assigned by the VIPE score is identified, the final classification is the highest level of urgency. Both steps are fully computerized, which added substantial simplification and agility to the triage process. As the triage nurse enters the collected data, the software processes the information according to the rationale described above, presenting filtered screens until the final classification. A more detailed description of CLARIPED is available in the Supplementary material.
Data collection, processing, and statical analysisThe computerized CLARIPED triage system was implemented at the study center in July 2017. It was integrated into the computerized system of the emergency unit, which records patient outcomes. The triage was performed by previously trained nurses submitted to a three-hour standardized training program. In this center, a share of the patients was not classified by the computerized CLARIPED due to the following reasons: no queue in the waiting room, mainly in night shifts, when a doctor immediately sees the patient; or a rare computer management system crash, when triage is done manually. The urgency levels and patient outcomes were extracted from the emergency unit computerized system reports. The other triage variables were extracted from the CLARIPED automated system reports. These data were merged using the patient's registration number and treated anonymously. Because there is no gold standard in the literature for triage systems, patient outcomes such as destination, number of diagnostic/therapeutic resources used, and length of stay in the emergency room were used as proxies of urgency. The outcomes' frequencies were estimated according to the urgency levels assigned by CLARIPED to assess the construct validity. The hypothesis was that the frequency of those outcomes would increase with increasing levels of urgency. The statistical significance of the variation in outcome frequencies was analyzed using the chi-square test for trends.
Multiple logistic regressions were performed using the outcomes "hospitalization" and "use of two or more resources" as dependent variables. The independent variable was the urgency level in the two regressions, dichotomized into most urgent (RED, ORANGE, and YELLOW) or less urgent (BLUE and GREEN). The covariates were age, time, and weekday of the emergency unit visit. The sensitivity, specificity, positive predictive value (PPV), and negative predictive value (NPV) of the CLARIPED system to discriminate the most urgent from the less urgent patients were estimated based on the outcome of "hospitalization". The under-triage rate was calculated as the proportion of patients classified as less urgent but hospitalized. The over-triage rate was estimated as the proportion of patients classified as most urgent but discharged home after medical consultation, with no admission to the observation room or hospitalization. Statistical analyzes performed in the R 4.0.3 software considered a significance level of 5% and confidence intervals of 95%.
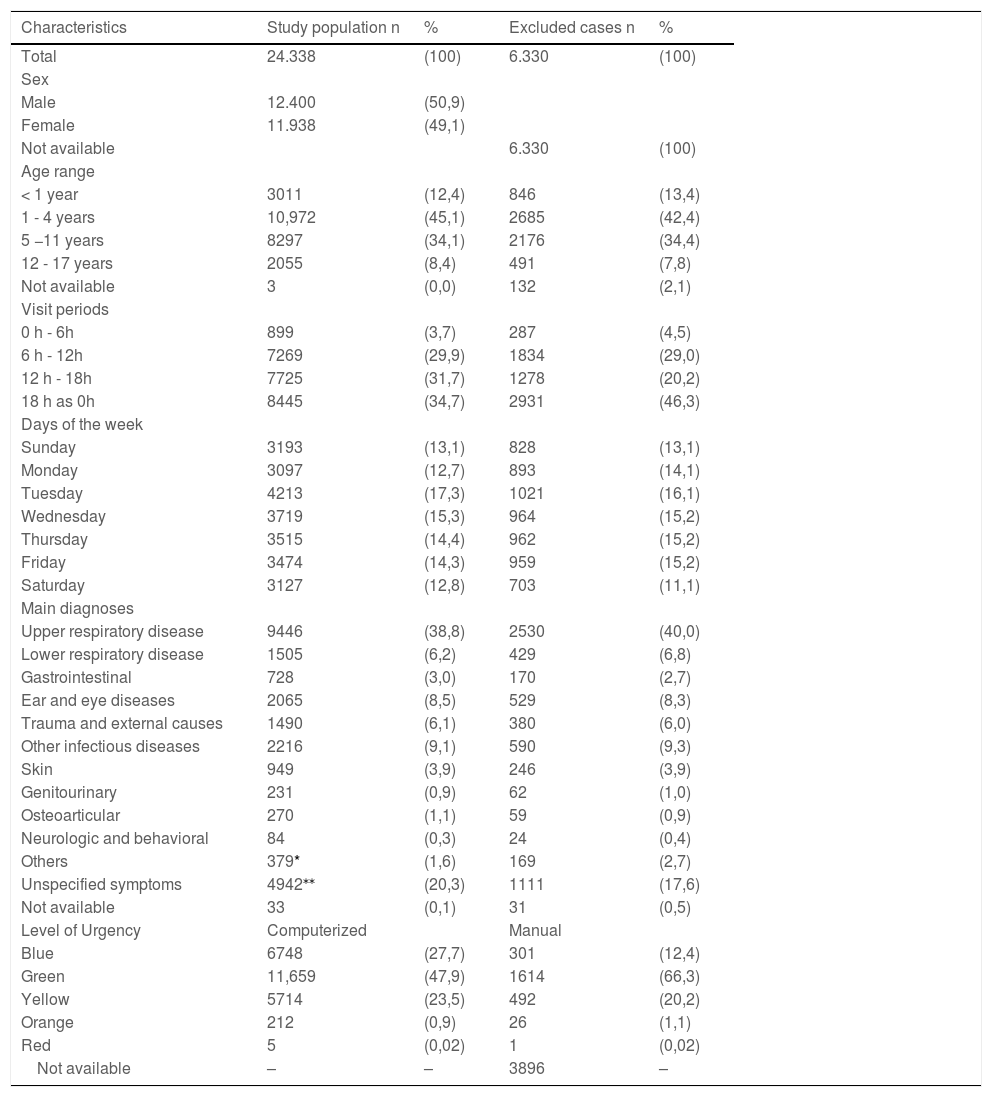
ResultsThe authors included 24,338 (79.4%) patients out of the 30,668 visits to the pediatric emergency unit during the study period. Of the 6330 (20.6%) excluded patients, 3896 (61.5%) had no triage (doctors immediately attended them) due to the absence of a waiting list, especially during night shifts, and 2434 (38.5%) underwent manual triage due to problems in the computerized data management system. The most frequent age groups were 1 to 4 years (45%) and 5 to 11 years (34.1%); the highest number of visits occurred from 12 to 18 h (31.7%) and 18 to 0 h (34.7%); the percentage of visits on each day of the week ranged from 12.7% on Monday to 17.3% on Tuesday, and respiratory diseases accounted for 38,8% of the visits. The distribution of the urgency categories was: 27.7% BLUE (no urgency), 47.9% GREEN (low urgency), 23.5% YELLOW (urgency), 0.9% ORANGE (high urgency), and 0.02% RED (emergency). There was no relevant difference between the demographic and clinical characteristics of the study population and the excluded visits (Table 1).
Characteristics of the study population and the total population attended in the pediatric emergency department during the study period (January 2018 to January-2019).
| Characteristics | Study population n | % | Excluded cases n | % |
|---|---|---|---|---|
| Total | 24.338 | (100) | 6.330 | (100) |
| Sex | ||||
| Male | 12.400 | (50,9) | ||
| Female | 11.938 | (49,1) | ||
| Not available | 6.330 | (100) | ||
| Age range | ||||
| < 1 year | 3011 | (12,4) | 846 | (13,4) |
| 1 - 4 years | 10,972 | (45,1) | 2685 | (42,4) |
| 5 −11 years | 8297 | (34,1) | 2176 | (34,4) |
| 12 - 17 years | 2055 | (8,4) | 491 | (7,8) |
| Not available | 3 | (0,0) | 132 | (2,1) |
| Visit periods | ||||
| 0 h - 6h | 899 | (3,7) | 287 | (4,5) |
| 6 h - 12h | 7269 | (29,9) | 1834 | (29,0) |
| 12 h - 18h | 7725 | (31,7) | 1278 | (20,2) |
| 18 h as 0h | 8445 | (34,7) | 2931 | (46,3) |
| Days of the week | ||||
| Sunday | 3193 | (13,1) | 828 | (13,1) |
| Monday | 3097 | (12,7) | 893 | (14,1) |
| Tuesday | 4213 | (17,3) | 1021 | (16,1) |
| Wednesday | 3719 | (15,3) | 964 | (15,2) |
| Thursday | 3515 | (14,4) | 962 | (15,2) |
| Friday | 3474 | (14,3) | 959 | (15,2) |
| Saturday | 3127 | (12,8) | 703 | (11,1) |
| Main diagnoses | ||||
| Upper respiratory disease | 9446 | (38,8) | 2530 | (40,0) |
| Lower respiratory disease | 1505 | (6,2) | 429 | (6,8) |
| Gastrointestinal | 728 | (3,0) | 170 | (2,7) |
| Ear and eye diseases | 2065 | (8,5) | 529 | (8,3) |
| Trauma and external causes | 1490 | (6,1) | 380 | (6,0) |
| Other infectious diseases | 2216 | (9,1) | 590 | (9,3) |
| Skin | 949 | (3,9) | 246 | (3,9) |
| Genitourinary | 231 | (0,9) | 62 | (1,0) |
| Osteoarticular | 270 | (1,1) | 59 | (0,9) |
| Neurologic and behavioral | 84 | (0,3) | 24 | (0,4) |
| Others | 379* | (1,6) | 169 | (2,7) |
| Unspecified symptoms | 4942⁎⁎ | (20,3) | 1111 | (17,6) |
| Not available | 33 | (0,1) | 31 | (0,5) |
| Level of Urgency | Computerized | Manual | ||
| Blue | 6748 | (27,7) | 301 | (12,4) |
| Green | 11,659 | (47,9) | 1614 | (66,3) |
| Yellow | 5714 | (23,5) | 492 | (20,2) |
| Orange | 212 | (0,9) | 26 | (1,1) |
| Red | 5 | (0,02) | 1 | (0,02) |
| Not available | – | – | 3896 | – |
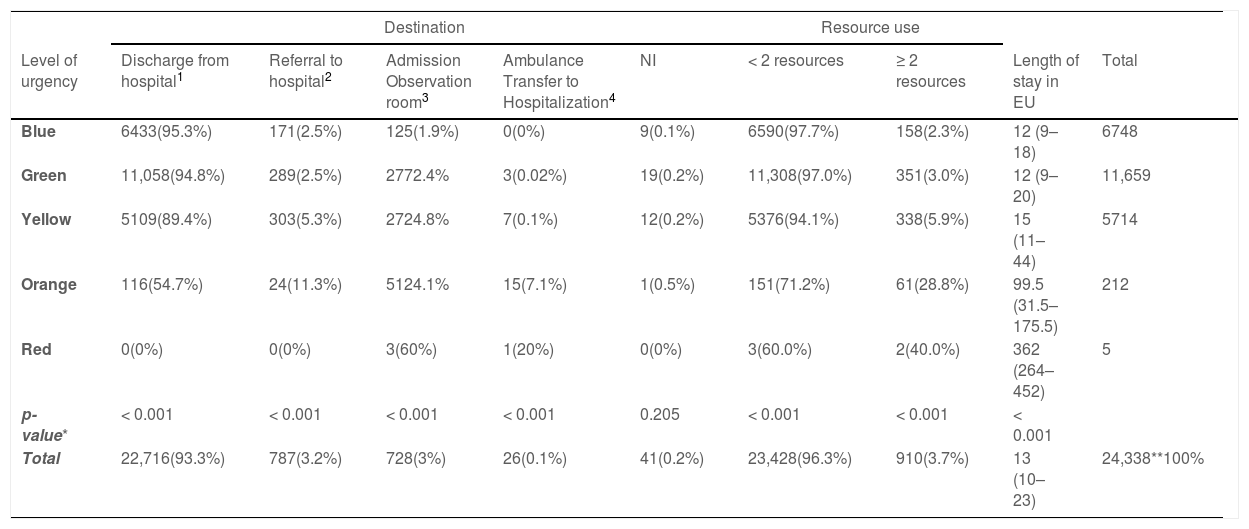
The frequency of patient outcomes increased according to increasing levels of urgency: referral to hospital by own means (2.5%, 2.5%, 5.3%, 11.3%, 0%; p < .001); admission to the observation room (1.9%, 2.4%, 4.8%, 24.1%, 60%; p < .001); ambulance transfer to hospitalization (0%, 0.02%, 0.1%, 7.1%, 20%; p < .001); use of ≥ 2 resources (2.3%, 3%, 5.9%, 28.8%, 40%; p < .001); and length of stay in the emergency unit (12, 12, 15, 99.5, 362 min; p < .001) (Table 2).
Distribution of the frequency of outcomes according to the level of urgency assigned by CLARIPED.
| Destination | Resource use | ||||||||
|---|---|---|---|---|---|---|---|---|---|
| Level of urgency | Discharge from hospital1 | Referral to hospital2 | Admission Observation room3 | Ambulance Transfer to Hospitalization4 | NI | < 2 resources | ≥ 2 resources | Length of stay in EU | Total |
| Blue | 6433(95.3%) | 171(2.5%) | 125(1.9%) | 0(0%) | 9(0.1%) | 6590(97.7%) | 158(2.3%) | 12 (9–18) | 6748 |
| Green | 11,058(94.8%) | 289(2.5%) | 2772.4% | 3(0.02%) | 19(0.2%) | 11,308(97.0%) | 351(3.0%) | 12 (9–20) | 11,659 |
| Yellow | 5109(89.4%) | 303(5.3%) | 2724.8% | 7(0.1%) | 12(0.2%) | 5376(94.1%) | 338(5.9%) | 15 (11–44) | 5714 |
| Orange | 116(54.7%) | 24(11.3%) | 5124.1% | 15(7.1%) | 1(0.5%) | 151(71.2%) | 61(28.8%) | 99.5 (31.5–175.5) | 212 |
| Red | 0(0%) | 0(0%) | 3(60%) | 1(20%) | 0(0%) | 3(60.0%) | 2(40.0%) | 362 (264–452) | 5 |
| p-value* | < 0.001 | < 0.001 | < 0.001 | < 0.001 | 0.205 | < 0.001 | < 0.001 | < 0.001 | |
| Total | 22,716(93.3%) | 787(3.2%) | 728(3%) | 26(0.1%) | 41(0.2%) | 23,428(96.3%) | 910(3.7%) | 13 (10–23) | 24,338**100% |
NA, not available; EU, emergency unit.
* chi-square for trend.
** In 40 visits, the patient had left without being seen by a doctor or was discharged by request.
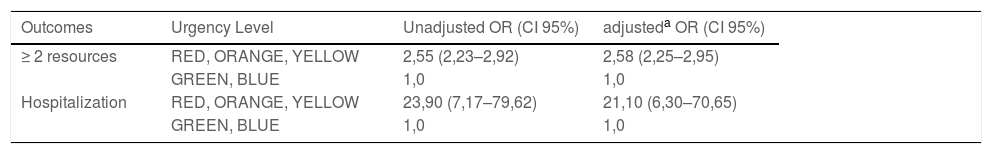
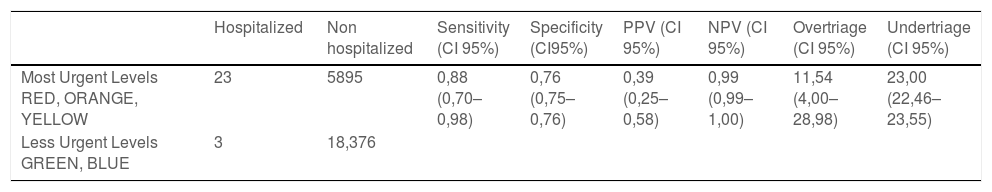
The odds ratio (OR) was 2.58 (95% CI: 2.25–2.95) for the use of two or more resources and 21.1 (95% CI: 6.3–70.65) for hospitalization in the most urgent levels (YELLOW, ORANGE, and RED), compared to the less urgent levels (BLUE and GREEN) as a reference, with adjustments for age, visit time and visit day of the week (Table 3). The sensitivity and specificity of CLARIPED to identify the most urgent patients, based on the outcome of "hospitalization" was 0.88 (95% CI: 0.70–0.98) and 0.76 (95% CI: 0.75 0.76), respectively. The negative predictive value (NPV) was 0.99 (95% CI: 0.99–1.00), and the over-triage and the under-triage rate were 23% and 11.5%, respectively (Table 4). The median duration of the triage process was 3 min (IQ 2–4).
Odds ratio for resource utilization and hospitalization in the study population using CLARIPED.
| Outcomes | Urgency Level | Unadjusted OR (CI 95%) | adjusteda OR (CI 95%) |
|---|---|---|---|
| ≥ 2 resources | RED, ORANGE, YELLOW | 2,55 (2,23–2,92) | 2,58 (2,25–2,95) |
| GREEN, BLUE | 1,0 | 1,0 | |
| Hospitalization | RED, ORANGE, YELLOW | 23,90 (7,17–79,62) | 21,10 (6,30–70,65) |
| GREEN, BLUE | 1,0 | 1,0 |
CI, confidence interval; OR, Odds ratio.
aAdjusted for age, visit time, and day of the week.
Sensitivity, specificity, PPV, and NPV of CLARIPED to discriminate high urgency and rates of overtriage and undertriage.
CI, confidence interval.
Sensitivity - number of most urgent and hospitalized patients (red, orange, and yellow) / total number of hospitalized patients.
Specificity - number of less urgent and unadmitted patients (green and blue) / total number of not admitted patients.
PPV (positive predictive value) - number of hospitalized patients/numbers of most urgent patients (red, orange, and yellow).
NPV (negative predictive value) - number of outpatients / numbers of less urgent patients.
Undertriage - number of less urgent patients (blue and green) admitted / total number of hospitalized patients x 100.
Overtriage - number of most urgent patients (red, orange, and yellow) discharged home / total number of patients discharged after prescription x 10.
One of the reasons for adopting structured risk classification systems is to provide the triage team with objective clues to assess the level of urgency and thus ensure a valid and safe standardized process. The instrument must be simple enough to ensure good adherence and a quick triage process so as not to delay the flow of patients through the emergency unit. In the present study, the computerized CLARIPED system demonstrated a strong association between levels of urgency and clinical outcomes, high sensitivity to discriminate the most urgent from the less urgent patients, high negative predictive value, and low under-triage rate in a secondary-level emergency service. More than 85% of the visits had computerized or manual risk classification with CLARIPED, representing excellent adherence to the tool. The duration of the risk classification process was within the internationally recommended time of 2 to 5 min. These findings reinforce and extend the validity of the computerized CLARIPED system, already demonstrated in a previous study carried out in a tertiary emergency service,9 in addition to corroborating the feasibility of its use in secondary-level emergency services.
As expected, the distribution of levels of urgency and the hospitalization rate in this study population was quite different from those found in the previous validity studies of CLARIPED. In the tertiary settings of the earlier studies, the hospitalization rate was 1.8 to 2.4%, 3 to 6% of the patients were in the levels RED or ORANGE, more than 90% were in the levels YELLOW or GREEN, and around 3% were in the level BLUE.9,10 In the secondary level setting of the present study, the hospitalization rate was about 0.1%, less than 1% of the patients were classified as level RED or ORANGE, 99% of patients were level 3, 4, or 5 (YELLOW, GREEN, or BLUE) and more than 75% were level GREEN or BLUE.
Despite this difference from previous publications, this study showed an increasing and discriminative frequency of all outcomes from the lowest to the highest level of urgency: hospitalization rate (0 to 20%); admission to the observation room (1.9 to 60%); referral to the hospital (2.5 to 11.3%); and use of ≥ 2 resources (2.3 to 40%). The difference in the frequency of the outcomes was more marked between the ORANGE and YELLOW levels. The gradient between the YELLOW and GREEN levels, although decreasing, was less marked.
As the main interest of the present study was to evaluate the discriminative capacity of CLARIPED in a context where most patients were in intermediate levels of urgency or without urgency, that is, less heterogeneous in terms of urgency levels than tertiary services. In such a context, the YELLOW level (23.5% of visits) needs to be distinguished from the GREEN and BLUE levels (75.6% of consultations), as it can represent the difference between a cold and pneumonia or between an innocent abdominal pain and appendicitis, for example. In these cases, the difference between the clinical presentation can be more subtle. Given the volume of patients at these levels of urgency, non-discrimination of urgent cases (YELLOW) may represent an inadequate waiting time with a risk of worsening the clinical condition of the patients. For this reason, the authors chose to dichotomize the levels of urgency by grouping the RED, ORANGE, and YELLOW (more urgent) and the GREEN and BLUE (less urgent).
In the urgent group (levels RED, ORANGE, and YELLOW), the chance of hospitalization and of using two or more resources were 24 times and 2,6 times greater than in the less urgent group (levels GREEN and BLUE), demonstrating an excellent discriminative capacity between the more urgent levels and the less urgent levels. Noteworthy is the extremely low hospitalization rate in the BLUE and GREEN levels (0 to 0.02%), also found in the previous validity studies of CLARIPED (0 to 0.6%). Even considering that several aspects can influence the hospitalization rate, such as infrastructure, case mix, and variable policies among different institutions, the authors can say that CLARIPED proved to be a very safe and efficient tool. This study showed a very high negative predictive value and a much lower hospitalization rate of less urgent patients than the rates observed in other triage systems (1 to 12%).11–20
The emergency unit length of stay ranged from 12 to 362 min from the lowest to the highest level of urgency, corroborating the discriminative capacity of CLARIPED. The length of stay was considered the time between the beginning of medical consultation and discharge from the emergency unit. Studies on PedCTAS14,15 and ESI v.412 that measured the time from arrival to discharge from the emergency department found less discriminatory times, as the waiting time between triage and medical consultation is inversely proportional to the level of urgency.
A triage system should focus on safety as a screening tool and exhibit good sensitivity and a low under-triage rate.10 In the present study, based on the outcome of hospitalization, CLARIPED showed higher sensitivity and specificity (0.88 and 0.76, respectively) to discriminate most urgent patients (YELLOW, ORANGE, and RED) from less urgent patients (GREEN and BLUE) compared to the two previous validity studies (0.82 and 0.62, respectively; 0.74 and 0.62, respectively). The low under-triage rate (11.5%) and the high VPN (0.99) corroborate the safety of the computerized tool.
The present study has strengths and limitations. The positive points are the large sample size (n = 24.338) compared to most validity studies in pediatrics (median = 1496)10 and the secondary-level pediatric care setting, which is a health context different from the first two validity studies of CLARIPED. As a first limitation, the authors can point out the low number of the highest urgent patients (ORANGE and RED), characteristic of most emergency pediatric services worldwide. Nevertheless, CLARIPED showed an excellent ability to discriminate the most urgent from the less urgent patients, as demonstrated by the odds ratio for hospitalization and resource utilization and the outcomes’ frequency in each level of urgency. Another possible limitation is the influence that the lack of blinding of the emergency physicians to the assigned triage level could have on the outcomes. However, the researchers extracted data from computerized reports and did not interfere with the team's care routine. The ED professionals were unaware of the study, and the authors believe that the physician's awareness of the urgency level in real life does not influence his decision-making. Finally, another limitation inherent to all validity studies of triage systems is the lack of a gold standard. There is no consensus on the best method to assess the validity of triage tools. In the first validity study of the manual version of CLARIPED, the authors used a reference standard adapted from one developed by experts and used in some validity studies on the MTS.21–23 This reference standard defines the "true urgency" based on the combination of several clinical outcomes and vital signs. However, there is no evidence of the validity of this reference standard. In the previous and the present study of the computerized version of CLARIPED, the authors opted to evaluate the construct validity through associations with each clinical outcome separately, like most other validity studies on triage systems. Nevertheless, there are methodological problems with the use of this type of validity, particularly external validity (inferences generalized to other populations). Clinical outcomes such as hospitalization, resource utilization, and length of stay used as proxies of urgency can be influenced by a myriad of variables related to the morbidity and mortality features of the target population, quality and amount of technical and human resources, variability in triage nurse decisions, quality and efficacy of the treatment, and institutional policies, among others. These may be responsible for the variability of the performance of triage tools in different health contexts and limit external validity. It is therefore more appropriate to apply a locally developed tool that is meaningful in the local context and assess internal validity (inferences about the source population).24 In the present study, it was assumed that there was systematic recording and effective treatment in the pediatric emergency service. The results showed good performance of CLARIPED in this setting (internal validity), but inferences to other settings can only be made if the populations are similar to that of the present study (external validity).
The findings of this study corroborate and extend the validity of CLARIPED, characterizing it as a Brazilian tool with good performance and discriminative capacity between the levels of urgency in a secondary-level pediatric emergency setting. It is the only pediatric triage system with evidence of safety and validity in Brazilian children, supporting its implementation and validity assessment in other pediatric urgency and emergency settings around the country.
No funding was received.
Institution to which the study is linked: Instituto D'Or de Pesquisa e Ensino (IDOR).


