

Advances in medicine have increased the life expectancy of pediatric patients with chronic illnesses, and challenges with the guided transition of adolescents and young adults from pediatric clinics to adult clinics have grown. The aim of this study was to better understand readiness and factors related to this transition process in Brazil.
MethodIn this cross-sectional study of 308 patients aged from 16 to 21 years under follow-up in pediatric specialties, the degree of readiness for transition was assessed using the Transition Readiness Assessment Questionnaire (TRAQ) and its domains. Associations with demographic data, clinical data, socio-economic level, medication adherence, family functionality, and parental satisfaction with health care were evaluated.
ResultsThe median TRAQ score was 3.7 (3.2 – 4.2). Better readiness was associated with female patients, socio-economic class A-B, current active employment, higher level of education, not failing any school year, attending medical appointments alone, functional family, and a good knowledge of disease and medications. A low correlation was observed between TRAQ and age. TRAQ presented good internal consistency (alpha-Cronbach 0.86). In the multiple linear regression, TRAQ score showed a significant association with female gender, advanced age, socio-economic class A-B, better knowledge of disease and medications, and independence to attend appointments alone.
ConclusionTRAQ instrument can guide healthcare professionals to identify specific areas of approach, in order to support adolescents with chronic disease to set goals for their own personal development and improve their readiness to enter into the adult healthcare system. In this study, some factors were related to better TRAQ scores.
All over the world, the number of children and adolescents with chronic diseases has been increasing due to advances in modern medicine with a consequent reduction in mortality.1,2 With the improvement of social and health indicators, early diagnosis, and progression in the quality of clinical treatment and the emergence of new therapies, the survival of patients cared for by different medical specialists has increased.3,4 Consequently, other concerns have arisen in relation to morbidity, quality of life, and optimization of follow-up treatment of these patients in pediatric clinics and in the transition process to adult clinics.
Currently, the exact model for transition has not been identified, as this process involves the clinical characteristics of patients and the medical unit in which they are being treated. It is known that most units still do not have well-established transition protocols. American data reports that only 17% of adolescents with special needs participate in a transition program.5
Abrupt transition can cause harm such as anxiety, lack of confidence in new professionals, and negative consequences to the health of these adolescents with an impact on psychosocial issues and adherence to treatment.6,7
Some tools were developed to measure patients' readiness to transition to adult care, including the Transition Readiness Assessment Questionnaire (TRAQ) which can be applied across all populations and has been translated into and validated in Portuguese.8–10
Given the relevance of the topic and the need to adopt a transition model for pediatric patients with the chronic disease across various pediatric specialties, in the process of transitioning to the adult clinic, the authors aimed to carry out this study. The present study's objective was to better understand demographic, social, and clinical factors that might influence TRAQ measures.
MethodStudy design and populationThis is a cross-sectional study carried out in a tertiary public hospital in São Paulo through a convenience sample from June 2017 to February 2020.
Data was collected from patients aged between 16 and 21 years in the outpatient clinic and with a diagnosis time greater than six months. The specialties and their respective diseases were: hematology [sickle cell anemia], pneumology [cystic fibrosis (CF)], nephrology [tubulopathy, chronic kidney disease (CKD) undergoing conservative treatment)], rheumatology [juvenile idiopathic arthritis (JIA), juvenile systemic lupus erythematosus (jSLE), juvenile dermatomyositis, juvenile scleroderma, Takayasu's arteritis], gastroenterology [celiac disease, Crohn's disease, ulcerative colitis], and cardiology [cardiomyopathy and pulmonary arterial hypertension]. At the time of evaluation in the study, only those patients with rheumatic diseases were able to participate in a structured transition program.
Patients with more than one chronic disease, with cognitive impairment, since these patients would not be able to answer the questionnaires, and patients and/or parents who refused to participate in the study were excluded.
Ethics committee approval was obtained, and informed consent terms were signed.
Demographic data such as age, sex, adolescent schooling, and data related to diseases, such as diagnosis, time of follow-up, and opinion about the personal knowledge of disease were collected by the researcher by consulting medical records and filling out a structured questionnaire. The participants themselves answered the questionnaires: Transition Readiness Assessment Questionnaire (TRAQ),10 family APGAR instrument,11 Morisky-Green-Levine Test (MGT),12 socioeconomic classification questionnaire of the Brazilian Association of Research Companies13 (ABEP) and the PedsQL™ (Pediatric Quality of Life) Satisfaction version 3.0 with the Health care questionnaire.14,15 Patients were recruited and answered the questionnaires in the outpatient clinics of their respective specialties while they were awaiting their appointments. TRAQ and the other questionnaires were applied at any given time, not necessarily at the first visit to the outpatient clinic.
Transition readiness assessment questionnaire (TRAQ)TRAQ is a self-administered, easy-to-answer questionnaire that contains twenty questions divided into five domains: “Taking medication”, “Going to appointments”, “Tracking health problems”, “Talking to the medical team”, and “In daily activities". The answers are on a cardinal scale, ranging from 1 to 5 and with five options, namely: “No, I don't know how to do this”, “No, but I want to learn”, “No, but I am learning”, “Yes, I have started doing this”, and “Yes, I always do this when I need to”. Estimated scale scores are calculated using the average score of items in each domain and resulting in an overall scale score also ranging from 1 to 5, with a higher score reflecting greater readiness for transition.9
Family APGAR instrumentThe questionnaire consists of five questions each with five possible answers (“always”, “almost always”, “sometimes”, “rarely” or “never”) according to the degree of satisfaction for each question. The score ranges from 0 to 4 points for each question. The final score can range between 0 and 20 points and the family can be characterized as functional (13-20 points), with moderate dysfunction (9-12 points), and with high dysfunction (1-8 points).11
Morisky-Green-Levin test (MGT)To assess medication adherence, the MGT was used, consisting only of four simple questions that allow the assessment of intake of medication with a binary answer, yes or no. The questions are: “Do you sometimes have trouble remembering to take your medication?”, “Do you sometimes forget to take your medication?”, “When you are feeling better, do you sometimes stop taking your medication?”, and “Sometimes, if you feel worse when taking the medication, do you stop taking it?”. The classification is based on affirmative answers: high adherence = no affirmative answers, medium adherence = one or two affirmative answers, and low adherence = three or four affirmative answers.12
Instrument of the Brazilian association of research companies (ABEP)For socio-economic classification and consumption in Brazil, the ABEP questionnaire was used. The socio-economic strata are divided into A, B1, B2, C1, C2, D, and E according to the scores.13 In this study, the classification was grouped into three categories: A-B, C, and D-E.
Pediatric life quality inventory (PedsQL™) health service satisfaction instrument version 3.0To assess patient and family satisfaction/dissatisfaction, the PedsQL™ version 3.0 instrument was used, which was translated and validated into Portuguese.15 It consists of 24 items divided into six domains (Information, Family Inclusion, Communication, Technical Skills, Emotional Needs, and General Satisfaction). Responses are given on a 5-points Likert scale for satisfaction, ranging from 0 (never) to 4 (always) and not applicable. The total score was calculated as the average of the values, ranging from 0 to 100; the higher the score the greater the satisfaction.14
Statistical analysisData was entered into the RedCap tool (Research Electronic Data Capture).16 Descriptive statistics for quantitative variables were presented by means and standard deviations represented by mean ± SD or medians and interquartile ranges, represented by median [Q1; Q3]. For qualitative variables, absolute and relative frequencies were considered, n (%).
For the statistical tests, a significance level of 0.5 was adopted. To compare the scores, the Wilcoxon and Mann-Whitney (2 groups) or Kruskal-Wallis (more than 2 groups) tests were used. Spearman's coefficient was used to measure the non-parametric correlations between the dimensions and the total scores of the questionnaire, and also to assess the correlations between the TRAQ scores and their domains with continuous variables.
To identify the variables that were candidates for multiple linear regression, a final model having the TRAQ score as the dependent variable was performed after selection by the stepwise method. The global internal consistency of the final questionnaires was analyzed using Cronbach's alpha coefficient.
ResultsIn this study, 331 patients were selected. Nineteen (5.7%) were excluded due to cognitive impairment and 4 (1.2%) due to refusal to participate. The sample consisted of 308 patients with the following diagnosis: jSLE (55; 17.9%), JIA (34; 11.0%), juvenile dermatomyositis (7; 2.3%), juvenile scleroderma (3; 1.0 %), Takayasu's arteritis (2; 0.6%), sickle cell anemia (84; 27.3%), celiac disease (14; 4.5%), Crohn's disease (24; 7.8%), ulcerative colitis disease (7; 2.3%), CF (22; 7.1%), tubulopathy (4; 1.3%), CKD with comprehensive conservative care (18; 5.8%), cardiomyopathy (31; 10.1 %) and pulmonary arterial hypertension (3; 1.0%).
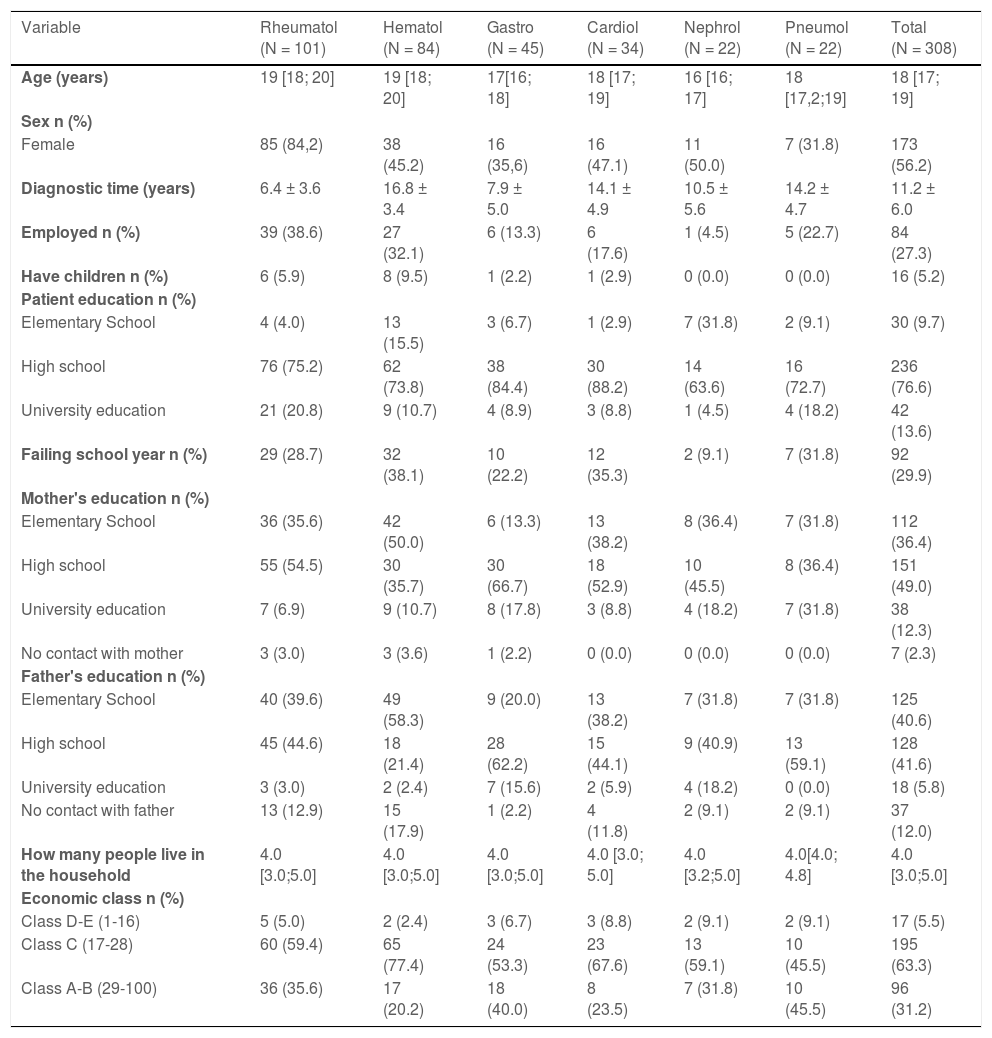
The median age of the patients was 18 years, the majority being female (56.2%), attending high school (76.6%), with a mean time of diagnosis of 11.2 years, and belonging to socio-economic class C (63.3%). Demographic and social characteristics according to the specialty are represented in Table 1.
Sociodemographic characteristics according to medical speciality.
Median and interquartile ranges [Q1;Q3] or mean (±SD).
Rheumatol – Rheumatology, Hematol – Hematology, Gastro - Gastroenterology, Cardiol – Cardiology, Nephrol - Nephrology, Pneumol – Pneumology.
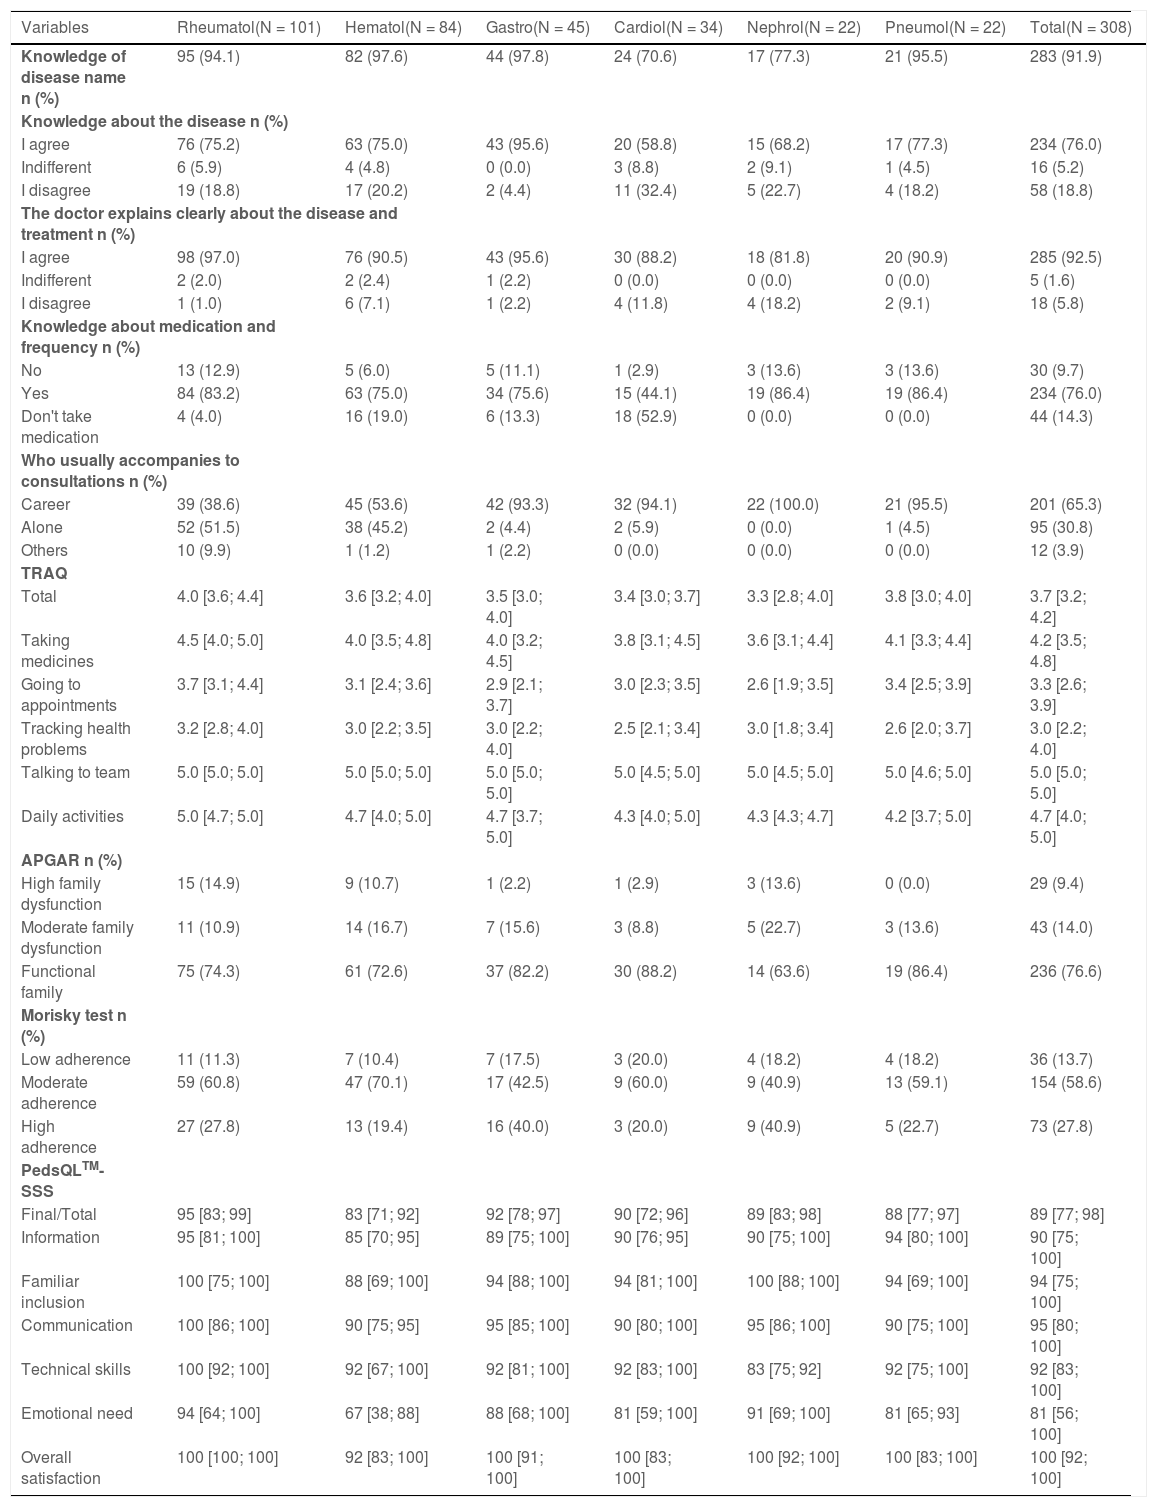
Table 2 presents the data related to the questionnaires according to medical specialty. Regarding the total data, the median TRAQ was 3.7 [3.2;4.2], 91.9% of patients knew the name of their disease, 76% agreed that they had good knowledge about their disease and 92.5% agreed that the doctor clearly explains their disease and treatment. Families were considered functional in 76.6% of the sample, moderate medication adherence was 58.6% and the PedsQLTM - SSS questionnaire revealed good service satisfaction with a median score of 89 [77;98]. Twelve participants (3.9%) did not respond to the PedsQLTM - SSS due to no guardian being present or because they had been attending for less than one year.
Data related to the questionnaires studied (semi-structured questionnaire, TRAQ, APGAR, Morisky-Green Test and PedsQLTM- SSS) according to medical speciality.
Median e interquartile ranges [Q1;Q3]
TRAQ - Transition Readiness Assessment Questionnaire; APGAR – Adaptation/Participation/Growth/Affection/Resolution; PedsQLTM- SSS - Pediatric Quality of Life - Satisfaction with Health Service.
Rheumatol – Rheumatology, Hematol – Hematology, Gastro - Gastroenterology, Cardiol – Cardiology, Nephrol - Nephrology, Pneumol – Pneumology.
The supplementary table represents the association of the TRAQ score (total and domains) with the sociodemographic variables and the questionnaires studied. It was observed that female patients have a better total TRAQ score in four of the five domains. The authors also observed that patients with the best assessment of readiness for transition were those patients from socio-economic A-B, who worked, with a higher level of education, who attended medical appointments alone, who did not fail any school year, who were part of a functional family and who claimed to have good knowledge of their disease and of the names and frequency of medication use. The authors observed that the domain “Talking to the medical team” showed no association in most of these results.
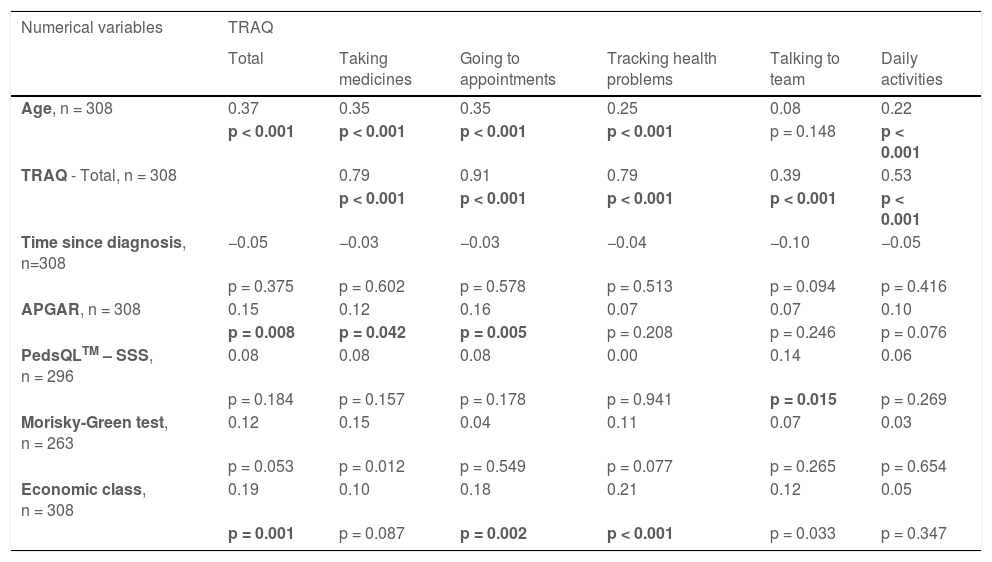
The correlations between the TRAQ responses (total and each domain) and the other quantitative measures are shown in Table 3. The different domains of the TRAQ questionnaire were correlated with each other. There was a correlation, however low, between age and TRAQ scores, except for “Talking to the team”. Correlations were positive, generally indicating higher scores for older individuals. No correlation was observed between TRAQ scores and time to diagnosis.
Correlations between the scores of the TRAQ questionnaire (total and each of the domains) and demographic and clinical variables and the ABEP, APGAR, Morisky-Green Test and PedsQLTM – SSS questionnaires with numerical measures.
TRAQ - Transition Readiness Assessment Questionnaire; APGAR – Adaptation/Participation/Growth/Affection/Resolution; PedsQLTM- SSS - Pediatric Quality of Life - Satisfaction with Health Service.
There were no relevant correlations between the TRAQ questionnaire and the APGAR, PedsQLTM, Morisky-Green test, or ABEP questionnaires.
Cronbach's alpha was high in the total TRAQ [0.86 (0.84; 0.88)], in the domains “Going to appointments” [0.74 (0.70; 0.79)], and “Talking to the team” [0.84 (0.80; 0.87)], and also in the APGAR [0.85 (0.82; 0.88)], and PedsQLTM – SSS [0.86 (0.83; 0.88) questionnaires)]. The TRAQ domains “In daily activities” [0.61 (0.54; 0.68)], “Tracking health problems” [0.55 (0.47; 0.64)], “Taking medication” [0.66 (0.60; 0.72)], and the Morisky-Green Test [0.53 (0.44; 0.62)], and the ABEP questionnaire [0.62 (0.57; 0.67)] showed moderate Cronbach's alpha.
According to univariate analysis, variables that were associated with the total TRAQ questionnaire were eligible for multiple linear regression.
Table 4 shows the final model using the TRAQ score as the dependent variable after selection via the stepwise method. For this model, the authors have age as a significant variable, so that for each year of age, the mean TRAQ score was 0.113 higher; the gender variable, so those female patients had a mean score of 0.229 higher than male patients; patients in class A-B had a mean score of 0.373 higher than those in class D-E; patients who are aware of the disease and know their medications had an average of 0.415 and 0.401 higher in the value of the TRAQ score (respectively), and patients who go to the doctor alone had an average of 0.18 higher in the TRAQ score than those who are accompanied by a guardian.
Results of the adjustment of the final multiple linear regression model (stepwise) considering TRAQ as the dependent variable.
The present study identified factors related to the process of transitioning from chronic pediatric patients to care in an adult clinic, in addition to evaluating the preparation and transition in patients of various specialties. It was observed that better preparation was associated with female patients, socio-economic class A-B, working class, higher level of education, no failing of any school year, attending medical appointments alone, having a functional family, and having good knowledge of the disease and of medications. The sample showed a low correlation between TRAQ and age. The authors also concluded that the TRAQ questionnaire had good internal consistency.
Female patients showed better preparation for the transition from pediatric clinic to adult clinic, data that corroborates with the literature, in which women had significantly higher TRAQ scores.8,17,18 Some studies showed that girls seem to reach developmental milestones such as marriage, living independently, and having children earlier than boys.19,20
Older patients also presented higher scores in the TRAQ questionnaire domains, and the older the patient, the higher the score, as demonstrated in other studies.8,21 This data suggests that, as adolescents grow, their maturity and the development of skills related to health management increase.
The associations observed in this study between the transition preparation questionnaire and socio-economic class A-B, work activity, higher level of education, and better school performance, showed that these patients are somehow more mature and seek autonomy. Furthermore, attending consultations without a companion, having a good knowledge of the disease and of medications, and having a functional family, were factors related to the best preparation for a successful transition. These factors reveal better autonomy, independence, focus on education, and clarity about the disease and treatment. Although these factors seem evident, the authors did not find descriptions of these associations in the literature, with the exceptions of sex and advanced age.8,17,18,21
Higher socio-economic status was associated with a higher score on the TRAQ questionnaire. The authors know that socioeconomic level is directly related to better access to medication, ease of transport, and greater general knowledge; these, in turn, lead to better preparation for independence. When patients have a lower socioeconomic status, the challenge of transitioning into public services is greater.
The TRAQ domain “Talking to the team” was not associated with most of the variables studied and was also the only domain that did not present a correlation with the total TRAQ. This data can be explained by the fact that younger adolescents, communicated with the health team through their parents and/or guardians, and during the transition period, they enter a new stage of independence where they themselves, report their complaints and questions. The doubts of the medical and multi-professional team will have to be answered by themselves. The study of patients with inflammatory bowel disease, which used another methodology to assess readiness for transition, found that communication with the medical team did not improve with age, despite being fundamental in the adult healthcare model.22
Adherence to medication is a topic widely studied in populations with chronic diseases, but little addressed in the pediatric population.23 Studies report that non-adherence to medication is a significant problem in adolescents under special care.24 Estimates for adherence rates in various chronic conditions for adolescents and young adults are around 32-55%.25,26 In the present study, high adherence to medication, measured by the MGT, was present in about a quarter of the sample, and had a correlation with having knowledge of medications but not with transition readiness. Some factors that can interfere with adherence to medication include frustration with the disease, complexity of the medication regimen, forgetfulness, and even adolescents' opinions about the effectiveness of the medication. In addition, it is known that poor adherence to treatment can negatively affect the clinical course of the disease, as well as the personal and socioeconomic life of patients.27
Transition can impact individuals and families and can lead to the development of anxiety and worries on the part of both. Therefore, health professionals need to work with adolescents and their families, supporting both maturing patients, and concerned parents, in the process. In the sample of this study, about three-quarters of adolescents had a functional family according to the APGAR questionnaire, which showed better results in readiness for transition. Thus, the moment of transfer to the adult clinic will depend on the preparation and characteristics of the adolescent and family, as well as the complexity of the health problems and the availability of qualified adult health professionals.28
The satisfaction/dissatisfaction of patients and family members has grown in importance in recent years as it can directly influence the clinical follow-up of patients. A good relationship with the health team, and effective communication, can improve adherence to treatment, and consequently the retention of patients in health services.29 The authors did not observe a correlation between the PEDsQLTM-SSS scores and the TRAQ scores.
The TRAQ questionnaire can be useful to pediatricians and other healthcare professionals, as it can identify deficient areas in patient education and transition readiness, and can track progress throughout the transition process, as well as improving transition programs, and consequently can impact health quality outcomes. In Brazil, it was translated into Portuguese and culturally adapted and validated.10 In the original study, the reliability was 0.94,9 in Anneli's study it was 0.7710 and in the present study, it was 0.86, demonstrating good internal consistency.
Although the present study aimed to evaluate transition readiness, it is important to emphasize that a transition-ready patient does not mean that he will be successful in the adult clinic after his transition. Indeed, the absence of risk factors does not guarantee a good follow-up prospectively. An American longitudinal study that followed patients with chronic rheumatologic, endocrine, and gastrointestinal diseases, by telephone for 3 years through interviews, found that about half of adolescents failed to transition to adult care, and almost half reported not discussing the transition with their physician. In this study, demographics and TRAQ scores at the first assessment were not predictors of a good transition or time to transition, only advanced age was shown to be a predictor.30 TRAQ measures transition readiness but not the overall transition process.
In the original TRAQ study, which included patients from different medical specialties, scores differed based on the respondent's main diagnosis.8 In the present study, patients from the pediatric rheumatology outpatient clinic had better scores in the total TRAQ and other domains when compared to other patients. This may be due to the influence of the implementation of a structured program of transition to an adult clinic which has been in process for 7 years. In this program, patients participate in an educational agenda with a multidisciplinary team (psychologist, social worker, physiotherapist, doctor). The medical professionals from the adult clinic meet the patients alongside their pediatric rheumatologists in consultations. When the patients have booked an appointment at the adult clinic, they return for their last pediatric appointment as a release meeting to verify their satisfaction with the transfer.
This study evaluated a large number of adolescents and young adults from different medical specialties and used objective and validated data to assess transition readiness and associated factors.
This study has some limitations. The TRAQ data was based on the adolescent's self-reporting of skills and knowledge and did not include any objective measures that confirmed that the adolescent had actually achieved these skills, which could be considered a limitation. Additionally, the wide range of ages with different developmental stages could have influenced the answers in the questionnaires. However, although subject to bias, the adolescent's self-reporting was considered an important and valid perspective on their behavior. Furthermore, the study is cross-sectional and did not have the main objective of measuring the results of the transition, that is, the authors cannot assess the predictive validity of the TRAQ instrument. Finally, this study is limited since it is single-center, of a convenience sample, and even though it contains results from different clinical specialties, this may impact the external validity of the results. The authors acknowledge that each clinical condition presents its own unique transition issues. However, this study is important because it included a significant sample of patients and evaluated the transition process in several pediatric specialties.
The findings of this study have important implications that can be influenced by the medical, multi-professional, family team and the environment in which the adolescent is inserted, which must be considered when working with young people at a transitional age. Assessment of transition readiness capability should be considered a tool for continuous improvement in transition care. A critical look at the risk factors that may influence an appropriate transition is needed. It is important for the elaboration of a structured program that facilitates discussion and helps to define and track goals for the patient, family, and health team, in which a successful transition, can be considered an indicator of the quality of health and an indispensable requirement for a good prognosis for patients. Later mid-term evaluations will indicate whether these patients have benefited from this process after the transition period and follow-up in the adult clinic.
FundingThis study was financed in part by the Coordenação de Aperfeiçoamento de Pessoal de Nível Superior - Brasil (CAPES) - Finance Code 001.


