

a) Establish reference values for bone parameters by using the speed of sound (SOS, m/s) of broadband ultrasound attenuation (BUA, dB/MHz) and establish a bone quality index (BQI=αSOS+βBUA) for children and adolescents living in a region of moderate altitude, b) compare bone parameters with an international standard (with different ethnic, socio-economic, and lifestyle backgrounds) by using ultrasound of the calcaneus (heel bone) (QUS).
MethodsA descriptive cross-sectional study was carried out with children and adolescents between the ages of 6.0 and 16.9 years old. The sample was selected randomly. A total of 1322 subjects were studied. Weight, height, and bone parameters, using ultrasound of the calcaneus, were evaluated SOS, BUA, and BQI. Body Mass Index BMI was calculated.
ResultsThe average age of males was 11.44±0.35 years old, and for females, it was 11.43±0.35 years old. The students in this research showed slightly higher values of SOS, BUA, and BQI for both sexes when compared with the international reference (the 50th percentile). Percentiles were generated (P3, P10, P25, P50, P75, P90, and P97) using the LMS method [median (M), standard deviation (S), and power of the Box-Cox transformation (L)] by age and sex.
ConclusionThe students living at a moderate altitude showed slightly higher values in bone parameters in relation to the international reference. This pattern depicted a population with a better state of bone health. The proposed percentiles may be used to categorize adequate to at risk bone parameters based on age and sex.
Assessment of bone health is becoming more important in today’s world. Bone mass with a high peak value appears to diminish the risk of future osteoporosis.1
In general, environmental risk factors are crucial in developing osteoporosis since typically they are associated with a Western lifestyle, characterized by low levels of physical activity, and deficient diets that include processed foods, such as coffee and carbonated drinks. In addition, a number of congenital or acquired diseases also affect bone development and growth during childhood and adolescence.2
In fact, the gold standard method for diagnosing osteoporosis recommended by the World Health Organization (WHO) is the dual X-ray absorptiometry (DXA) method.3 However, the quantitative ultrasound (QUS) is widely considered to be a fast, economical alternative means of evaluation without the use of radiation. Moreover, it is highly portable for evaluating bone health in large populations.4–6
QUS evaluates parameters commonly generated for the calcaneus. These are derived from the following measures: speed of sound (SOS, m/s), wide band ultrasound attenuation (BUA, dB/MHz); and bone quality index (BQI= αSOS+βBUA, αβ: temperature corrections). These parameters are recognized as determinant measures of the health status of the calcaneus in terms of the micro-architecture and bone mineral density (BMD).3 Thus, in the past few years, the use of the QUS technology has increased. This has been used in a number of research studies carried out with samples of children and adolescents in diverse regions of the world.6–9 These findings reflect ethnic differences between populations.
As a result, the lack of information about BMD in populations living at a moderate altitude and, especially, countries under development, like Peru, need to be studied. Thus, as far as we know, no research exists about bone health of students living in regions of moderate and high altitudes.
This gap in the literature limits the ability of health professionals and others to evaluate the prevalence and the risk of osteoporosis during the early ages. This lack of knowledge complicates prevention efforts and developing intervention programs for the groups in most need, especially students during the development and growth periods.
In general, researchers studying groups living at moderate altitudes in Peru10 and Columbia11 are affected by decreased physical growth patterns when compared with international references. Furthermore, the positive changes observed in secular physical growth trends and body adiposity of students living at moderate altitudes in Peru,12 and the increase in food intake during the past few years in 14.8%13 of the Peruvian population may influence the bone parameters of children and adolescents living at a moderate altitude in Peru (2,320 meters above sea level).
Therefore, the objectives of this research study include: a) establish reference values for bone parameters using the speed of sound (SOS, m/s), Broadband ultrasound attenuation (BUA, dB/MHz); and the bone quality index (BQI=αSOS+βBUA) for children and adolescents living in a region of moderate altitude in Peru, and b) compare bone parameters with an international standard (with different ethnic, socio-economic, and lifestyle backgrounds) by using ultrasound of the calcaneus (heel bone) (QUS).
MethodsType of study and sampleA descriptive cross sectional study was carried out with children and adolescents between the ages of 6.0 and 16.9 years old. The sample population was composed of 10,502 subjects 5,209 males and 5,293 females. The sample was selected randomly. Twelve percent of the sample consisted of 1322 subjects [620 5.9%) males and 702 (6.7%) females, IC: 95%]. This included 6 schools from the province of Arequipa, Peru (moderate altitude). The average age for males was 11.44±0.35 years, and for females, it was 11.43±0.35 years.
Arequipa is located at 2,320m above sea level (moderate altitude). Relative humidity during the year is between 46% and 70%, and the temperature varies between 10° to 25°C.14 This city is considered to be an example of development for the country, particularly in industry, agriculture, and commerce. The Human Development Index (HDI) for Peru in 2013 was 0.741, and for Arequipa, it was 0.745.15
Criteria for including subjects in this study were that the individuals needed to be students registered in a state school. Students also needed to be from elementary (ages 6.0–11.9) or secondary school (12.0–16.9 years old) to be included in the study. Additionally, the schools and students needed to belong to urban areas of the province of Arequipa (Peru). Students excluded included those with a sports injury on the right foot and at the time of the evaluation took any kind of medication (n=34 subjects).
The research was carried out in keeping with the Declaration of Helsinki for Human Subjects. Ethical approval was obtained from the Research and Ethics Committee from Universidad Católica Santa Maria (2017).
ProceduresData collection took place at each school. A small laboratory was prepared and equipped in order to collect and evaluate the variables for the study. Initially, the anthropometric variables were collected, and, afterwards, the bone parameters were taken (a scan of the right foot). The evaluations took place between April and July of 2017 and 2018 during school hours (8:00 a.m. to 13:00 p.m.).
To evaluate weight and height, the protocol developed by Ross and Marfell-Jones16 was followed. The anthropometric variables were collected with the students barefoot and the least amount of clothing possible (shorts and a T-shirt). Students were weighed with a Tanita (United Kingdom, Ltd.) digital scale with an accuracy of 0.1kg. Standing height was measured with a portable stadiometer (Hamburg, Seca, Ltd.) with an accuracy of 0.1mm according to the Plane of Frankfurt. Body Mass Index (BMI) was obtained from weight and height. The formula proposed by Quetelet [BMI=weight (kg)/height (m)2] was used to calculate the BMI.
Using ultrasound scans (QUS), the bone parameter measurements of the calcaneus were recorded using a bone densitometer SONOST 3000 (Seoul, South Korea). The parameters measured with the QUS included the following: the speed of sound (SOS, m/s), wide broadband ultrasound attenuation (BUA, dB/MHz), and the bone quality index (BQI=αSOS+βBUA, αβ: temperature correction). The evaluation of each subject lasted 15s. The entire procedure was carried out by one trained evaluator with significant experience. Ten percent of the sample was evaluated two times (n=120). The intra-evaluator Technical Error of Measurement (TEM) was 1.2%.
StatisticsThe Kolmogorov-Smirnov (K–S) test was used to verify the normality of the data. Afterwards, descriptive statistical analysis (arithmetic mean, standard deviation, and range) was carried out. To determine the differences between both sexes, the student t-test for independent samples was used. Z-scores were calculated with the goal of comparing data from weight, height, and body mass index of the students from the present study with the normative references established by the CDC-2012. The following equation was used to calculate the Z-scores: Z= [(X/M) L–1]/L*S, where X was the measure observed (weight, height, and BMI) for each subject; M the median, L the asymmetry value, −1 the constant, and S the coefficient of variation. The L, M, and S values were obtained from the normative tables from the CDC-2012. When the L, M, and S values were not available, the Z-scare was used: Z= (X–M)/SD, where X is the observed value, M the average, and SD the standard deviation. M and SD were obtained from the CDC-2012 reference for age and sex.
The LMS17 statistical method was used to create reference curves for bone parameters for children and adolescents living at a moderate altitude in Peru (BQI, SOS, and BUA) based on age and sex. The following percentiles were calculated: p3, p10, p15, p25, p50, p75, p85, p90, and p97. LMS was used to estimate three parameters: LMS [median (M), standard deviation (S), and power of the Box-Cox transformation (L)]. These three parameters were based on the function of age.
The comparisons of the percentiles between both sexes studied were carried out by plotting the 50th percentile. LMS Chartmaker Pro version 2.318 and SPSS for Windows v. 20 (SPSS Inc., Chicago, IL) software were used. In all cases, p<0.05 was adopted.
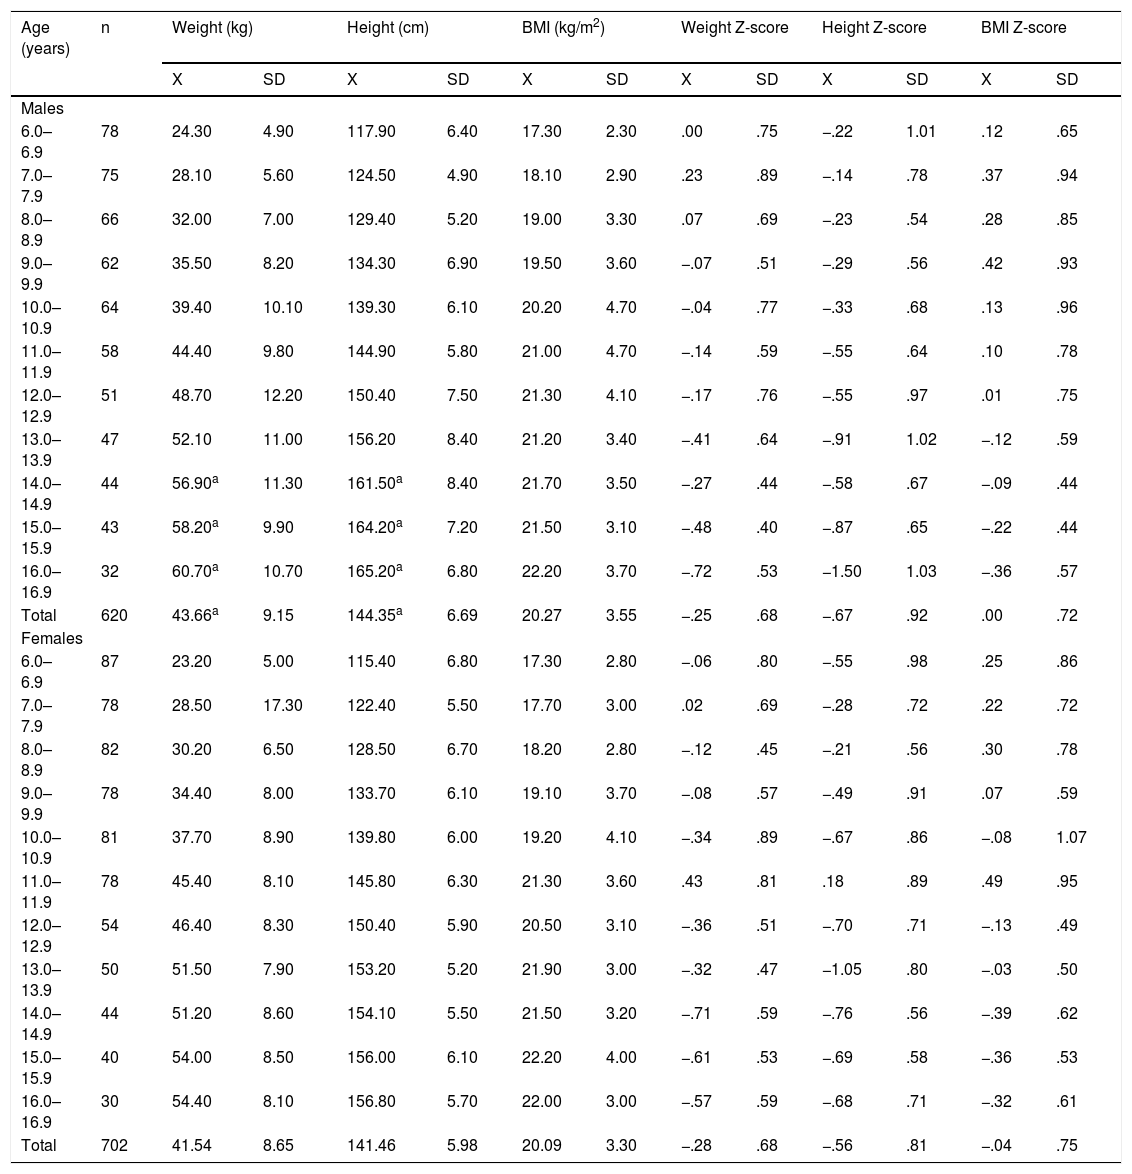
ResultsThe variables for weight, height, and BMI by age are illustrated in Table 1. The anthropometric variable values increased as age advanced from 6.0 to 16.9 years old. In general, no significant differences occurred in weight and height between the sexes. Values were similar until age 14.9 years old. On the contrary, during the last two ages (15.0–16.9), males weighed more, and they were taller in comparison to the females (p<0.05). With regard to BMI, no differences were observed in both sexes at any age range (p>0.05).
Anthropometric characteristics and Body Mass Index of children and adolescents studied.
| Age (years) | n | Weight (kg) | Height (cm) | BMI (kg/m2) | Weight Z-score | Height Z-score | BMI Z-score | ||||||
|---|---|---|---|---|---|---|---|---|---|---|---|---|---|
| X | SD | X | SD | X | SD | X | SD | X | SD | X | SD | ||
| Males | |||||||||||||
| 6.0–6.9 | 78 | 24.30 | 4.90 | 117.90 | 6.40 | 17.30 | 2.30 | .00 | .75 | −.22 | 1.01 | .12 | .65 |
| 7.0–7.9 | 75 | 28.10 | 5.60 | 124.50 | 4.90 | 18.10 | 2.90 | .23 | .89 | −.14 | .78 | .37 | .94 |
| 8.0–8.9 | 66 | 32.00 | 7.00 | 129.40 | 5.20 | 19.00 | 3.30 | .07 | .69 | −.23 | .54 | .28 | .85 |
| 9.0–9.9 | 62 | 35.50 | 8.20 | 134.30 | 6.90 | 19.50 | 3.60 | −.07 | .51 | −.29 | .56 | .42 | .93 |
| 10.0–10.9 | 64 | 39.40 | 10.10 | 139.30 | 6.10 | 20.20 | 4.70 | −.04 | .77 | −.33 | .68 | .13 | .96 |
| 11.0–11.9 | 58 | 44.40 | 9.80 | 144.90 | 5.80 | 21.00 | 4.70 | −.14 | .59 | −.55 | .64 | .10 | .78 |
| 12.0–12.9 | 51 | 48.70 | 12.20 | 150.40 | 7.50 | 21.30 | 4.10 | −.17 | .76 | −.55 | .97 | .01 | .75 |
| 13.0–13.9 | 47 | 52.10 | 11.00 | 156.20 | 8.40 | 21.20 | 3.40 | −.41 | .64 | −.91 | 1.02 | −.12 | .59 |
| 14.0–14.9 | 44 | 56.90a | 11.30 | 161.50a | 8.40 | 21.70 | 3.50 | −.27 | .44 | −.58 | .67 | −.09 | .44 |
| 15.0–15.9 | 43 | 58.20a | 9.90 | 164.20a | 7.20 | 21.50 | 3.10 | −.48 | .40 | −.87 | .65 | −.22 | .44 |
| 16.0–16.9 | 32 | 60.70a | 10.70 | 165.20a | 6.80 | 22.20 | 3.70 | −.72 | .53 | −1.50 | 1.03 | −.36 | .57 |
| Total | 620 | 43.66a | 9.15 | 144.35a | 6.69 | 20.27 | 3.55 | −.25 | .68 | −.67 | .92 | .00 | .72 |
| Females | |||||||||||||
| 6.0–6.9 | 87 | 23.20 | 5.00 | 115.40 | 6.80 | 17.30 | 2.80 | −.06 | .80 | −.55 | .98 | .25 | .86 |
| 7.0–7.9 | 78 | 28.50 | 17.30 | 122.40 | 5.50 | 17.70 | 3.00 | .02 | .69 | −.28 | .72 | .22 | .72 |
| 8.0–8.9 | 82 | 30.20 | 6.50 | 128.50 | 6.70 | 18.20 | 2.80 | −.12 | .45 | −.21 | .56 | .30 | .78 |
| 9.0–9.9 | 78 | 34.40 | 8.00 | 133.70 | 6.10 | 19.10 | 3.70 | −.08 | .57 | −.49 | .91 | .07 | .59 |
| 10.0–10.9 | 81 | 37.70 | 8.90 | 139.80 | 6.00 | 19.20 | 4.10 | −.34 | .89 | −.67 | .86 | −.08 | 1.07 |
| 11.0–11.9 | 78 | 45.40 | 8.10 | 145.80 | 6.30 | 21.30 | 3.60 | .43 | .81 | .18 | .89 | .49 | .95 |
| 12.0–12.9 | 54 | 46.40 | 8.30 | 150.40 | 5.90 | 20.50 | 3.10 | −.36 | .51 | −.70 | .71 | −.13 | .49 |
| 13.0–13.9 | 50 | 51.50 | 7.90 | 153.20 | 5.20 | 21.90 | 3.00 | −.32 | .47 | −1.05 | .80 | −.03 | .50 |
| 14.0–14.9 | 44 | 51.20 | 8.60 | 154.10 | 5.50 | 21.50 | 3.20 | −.71 | .59 | −.76 | .56 | −.39 | .62 |
| 15.0–15.9 | 40 | 54.00 | 8.50 | 156.00 | 6.10 | 22.20 | 4.00 | −.61 | .53 | −.69 | .58 | −.36 | .53 |
| 16.0–16.9 | 30 | 54.40 | 8.10 | 156.80 | 5.70 | 22.00 | 3.00 | −.57 | .59 | −.68 | .71 | −.32 | .61 |
| Total | 702 | 41.54 | 8.65 | 141.46 | 5.98 | 20.09 | 3.30 | −.28 | .68 | −.56 | .81 | −.04 | .75 |
X, average; SD, standard deviation; BMI, body mass index.
The prevalence of overweight in males was 7.6%. For females, 4.4% were found to be overweight.
With regard to comparisons for the weight, height, and BMI variables between children and adolescents living in a region of moderate altitude and the CDC-2012 references based on Z-scores, the results for weight presented lower values than the CDC-2012 average. Negative Z-score values ranged between −0.14 to −0.72 for males ages 11.0–16.9 and −0.32 to −0.71 for females 10.0–16.9 years old. In addition, the values were similar between ages 6.0 and 9.9 years for both sexes.
The results for height represented a lower value than the CDC-2012 average. Negative Z-scores occurred at all ages. These varied from −0.14 to −1.50 for males, and for females, Z-scores varied from −0.21 to −1.05.
On the contrary, at early ages, BMI Z-score values were higher. From age 13.0 years, lower values were observed in both sexes. In general, children and adolescents living at a moderate altitude showed lower weight and height in comparison to the international reference.
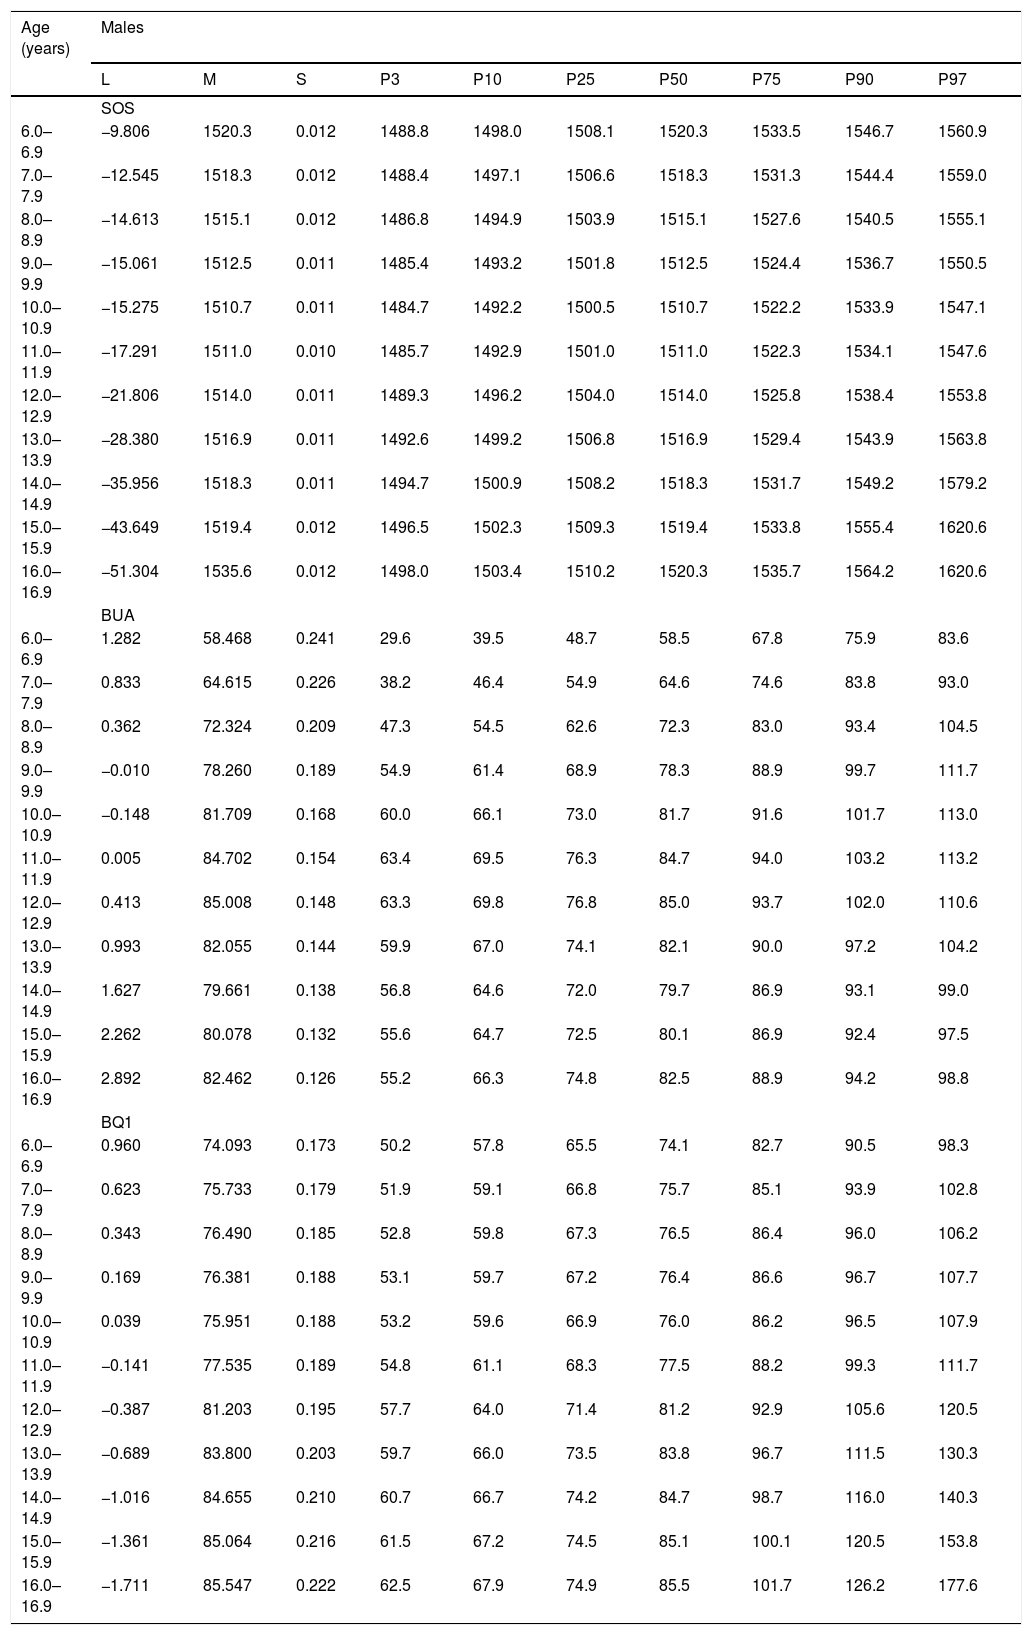
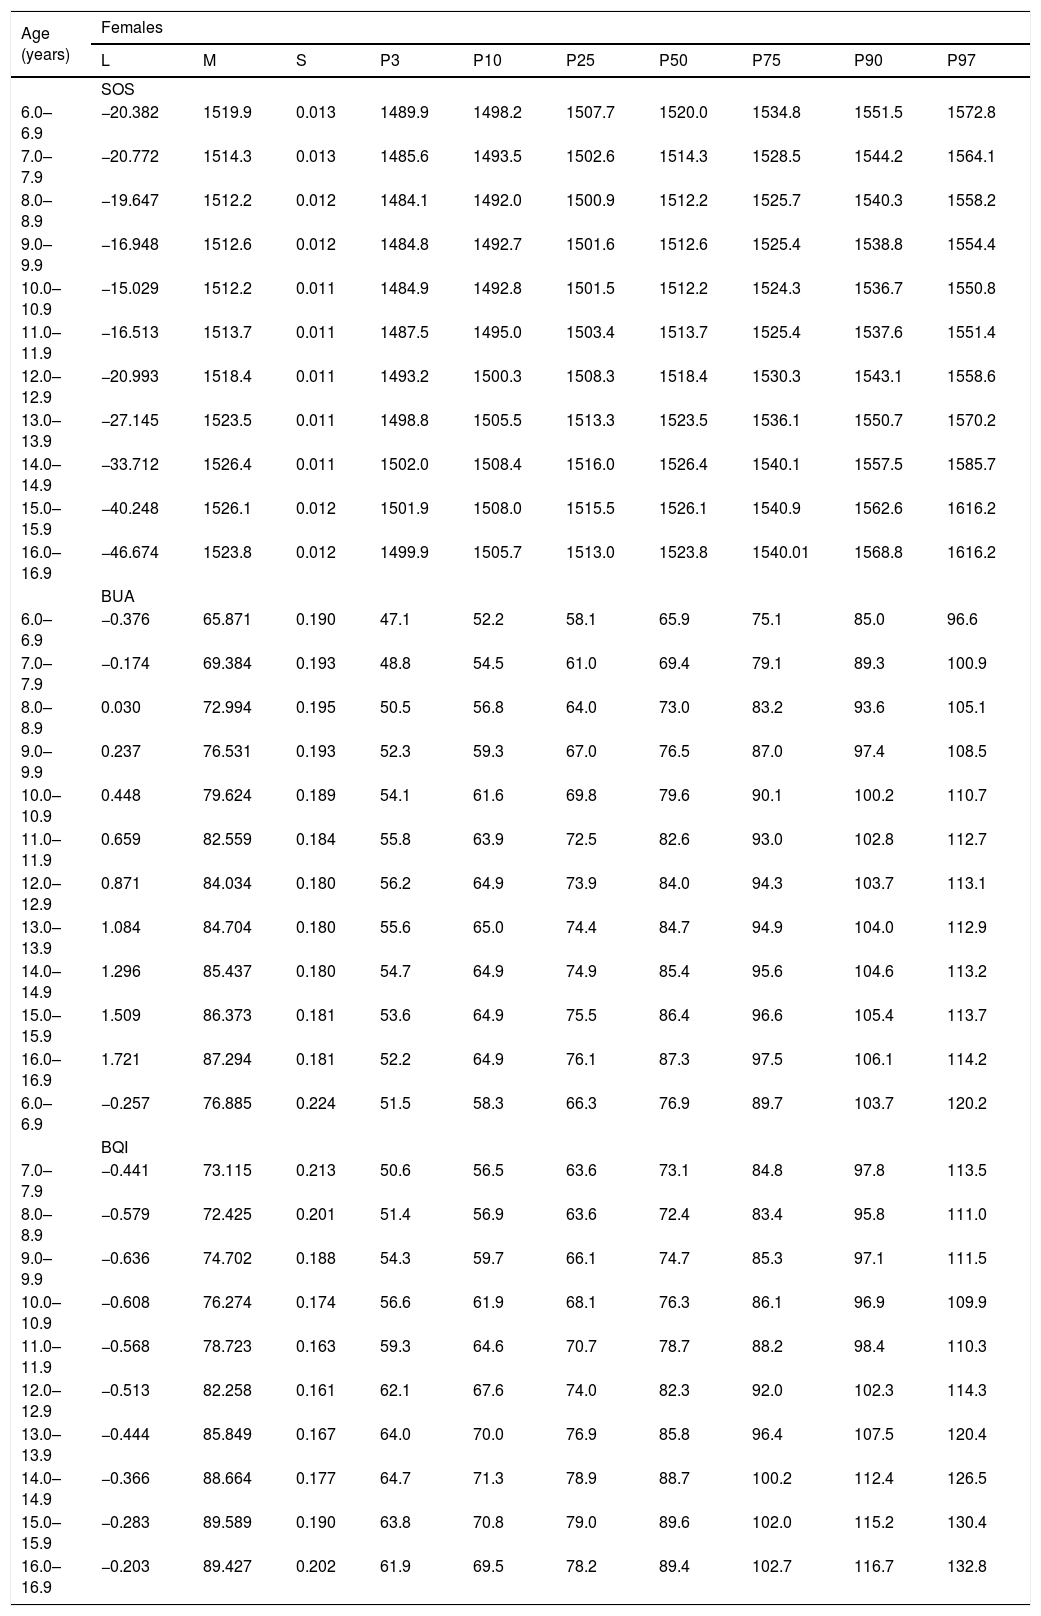
The percentile distribution by age and sex for the SOS, BUA, and BQI is illustrated in Tables 2 and 3. In all cases, values rose slightly as age advanced.
Percentiles for bone parameters [SOS (m/s), BUA (dB/MHz), and BQI (αSOS+βBUA)] for children and adolescents from Arequipa (Peru).
| Age (years) | Males | |||||||||
|---|---|---|---|---|---|---|---|---|---|---|
| L | M | S | P3 | P10 | P25 | P50 | P75 | P90 | P97 | |
| SOS | ||||||||||
| 6.0–6.9 | −9.806 | 1520.3 | 0.012 | 1488.8 | 1498.0 | 1508.1 | 1520.3 | 1533.5 | 1546.7 | 1560.9 |
| 7.0–7.9 | −12.545 | 1518.3 | 0.012 | 1488.4 | 1497.1 | 1506.6 | 1518.3 | 1531.3 | 1544.4 | 1559.0 |
| 8.0–8.9 | −14.613 | 1515.1 | 0.012 | 1486.8 | 1494.9 | 1503.9 | 1515.1 | 1527.6 | 1540.5 | 1555.1 |
| 9.0–9.9 | −15.061 | 1512.5 | 0.011 | 1485.4 | 1493.2 | 1501.8 | 1512.5 | 1524.4 | 1536.7 | 1550.5 |
| 10.0–10.9 | −15.275 | 1510.7 | 0.011 | 1484.7 | 1492.2 | 1500.5 | 1510.7 | 1522.2 | 1533.9 | 1547.1 |
| 11.0–11.9 | −17.291 | 1511.0 | 0.010 | 1485.7 | 1492.9 | 1501.0 | 1511.0 | 1522.3 | 1534.1 | 1547.6 |
| 12.0–12.9 | −21.806 | 1514.0 | 0.011 | 1489.3 | 1496.2 | 1504.0 | 1514.0 | 1525.8 | 1538.4 | 1553.8 |
| 13.0–13.9 | −28.380 | 1516.9 | 0.011 | 1492.6 | 1499.2 | 1506.8 | 1516.9 | 1529.4 | 1543.9 | 1563.8 |
| 14.0–14.9 | −35.956 | 1518.3 | 0.011 | 1494.7 | 1500.9 | 1508.2 | 1518.3 | 1531.7 | 1549.2 | 1579.2 |
| 15.0–15.9 | −43.649 | 1519.4 | 0.012 | 1496.5 | 1502.3 | 1509.3 | 1519.4 | 1533.8 | 1555.4 | 1620.6 |
| 16.0–16.9 | −51.304 | 1535.6 | 0.012 | 1498.0 | 1503.4 | 1510.2 | 1520.3 | 1535.7 | 1564.2 | 1620.6 |
| BUA | ||||||||||
| 6.0–6.9 | 1.282 | 58.468 | 0.241 | 29.6 | 39.5 | 48.7 | 58.5 | 67.8 | 75.9 | 83.6 |
| 7.0–7.9 | 0.833 | 64.615 | 0.226 | 38.2 | 46.4 | 54.9 | 64.6 | 74.6 | 83.8 | 93.0 |
| 8.0–8.9 | 0.362 | 72.324 | 0.209 | 47.3 | 54.5 | 62.6 | 72.3 | 83.0 | 93.4 | 104.5 |
| 9.0–9.9 | −0.010 | 78.260 | 0.189 | 54.9 | 61.4 | 68.9 | 78.3 | 88.9 | 99.7 | 111.7 |
| 10.0–10.9 | −0.148 | 81.709 | 0.168 | 60.0 | 66.1 | 73.0 | 81.7 | 91.6 | 101.7 | 113.0 |
| 11.0–11.9 | 0.005 | 84.702 | 0.154 | 63.4 | 69.5 | 76.3 | 84.7 | 94.0 | 103.2 | 113.2 |
| 12.0–12.9 | 0.413 | 85.008 | 0.148 | 63.3 | 69.8 | 76.8 | 85.0 | 93.7 | 102.0 | 110.6 |
| 13.0–13.9 | 0.993 | 82.055 | 0.144 | 59.9 | 67.0 | 74.1 | 82.1 | 90.0 | 97.2 | 104.2 |
| 14.0–14.9 | 1.627 | 79.661 | 0.138 | 56.8 | 64.6 | 72.0 | 79.7 | 86.9 | 93.1 | 99.0 |
| 15.0–15.9 | 2.262 | 80.078 | 0.132 | 55.6 | 64.7 | 72.5 | 80.1 | 86.9 | 92.4 | 97.5 |
| 16.0–16.9 | 2.892 | 82.462 | 0.126 | 55.2 | 66.3 | 74.8 | 82.5 | 88.9 | 94.2 | 98.8 |
| BQ1 | ||||||||||
| 6.0–6.9 | 0.960 | 74.093 | 0.173 | 50.2 | 57.8 | 65.5 | 74.1 | 82.7 | 90.5 | 98.3 |
| 7.0–7.9 | 0.623 | 75.733 | 0.179 | 51.9 | 59.1 | 66.8 | 75.7 | 85.1 | 93.9 | 102.8 |
| 8.0–8.9 | 0.343 | 76.490 | 0.185 | 52.8 | 59.8 | 67.3 | 76.5 | 86.4 | 96.0 | 106.2 |
| 9.0–9.9 | 0.169 | 76.381 | 0.188 | 53.1 | 59.7 | 67.2 | 76.4 | 86.6 | 96.7 | 107.7 |
| 10.0–10.9 | 0.039 | 75.951 | 0.188 | 53.2 | 59.6 | 66.9 | 76.0 | 86.2 | 96.5 | 107.9 |
| 11.0–11.9 | −0.141 | 77.535 | 0.189 | 54.8 | 61.1 | 68.3 | 77.5 | 88.2 | 99.3 | 111.7 |
| 12.0–12.9 | −0.387 | 81.203 | 0.195 | 57.7 | 64.0 | 71.4 | 81.2 | 92.9 | 105.6 | 120.5 |
| 13.0–13.9 | −0.689 | 83.800 | 0.203 | 59.7 | 66.0 | 73.5 | 83.8 | 96.7 | 111.5 | 130.3 |
| 14.0–14.9 | −1.016 | 84.655 | 0.210 | 60.7 | 66.7 | 74.2 | 84.7 | 98.7 | 116.0 | 140.3 |
| 15.0–15.9 | −1.361 | 85.064 | 0.216 | 61.5 | 67.2 | 74.5 | 85.1 | 100.1 | 120.5 | 153.8 |
| 16.0–16.9 | −1.711 | 85.547 | 0.222 | 62.5 | 67.9 | 74.9 | 85.5 | 101.7 | 126.2 | 177.6 |
M, median; S, coefficient of variation; L, power in the Box-Cox transformation; SOS, speed of sound (m/s), at broadband ultrasound attenuation (BUA, dB/MHz), bone quality index (BQI=αSOS+βBUA).
Percentiles for bone parameters [SOS (m/s), BUA (dB/MHz), and BQI (αSOS+βBUA)] for children and adolescents form Arequipa (Peru).
| Age (years) | Females | |||||||||
|---|---|---|---|---|---|---|---|---|---|---|
| L | M | S | P3 | P10 | P25 | P50 | P75 | P90 | P97 | |
| SOS | ||||||||||
| 6.0–6.9 | −20.382 | 1519.9 | 0.013 | 1489.9 | 1498.2 | 1507.7 | 1520.0 | 1534.8 | 1551.5 | 1572.8 |
| 7.0–7.9 | −20.772 | 1514.3 | 0.013 | 1485.6 | 1493.5 | 1502.6 | 1514.3 | 1528.5 | 1544.2 | 1564.1 |
| 8.0–8.9 | −19.647 | 1512.2 | 0.012 | 1484.1 | 1492.0 | 1500.9 | 1512.2 | 1525.7 | 1540.3 | 1558.2 |
| 9.0–9.9 | −16.948 | 1512.6 | 0.012 | 1484.8 | 1492.7 | 1501.6 | 1512.6 | 1525.4 | 1538.8 | 1554.4 |
| 10.0–10.9 | −15.029 | 1512.2 | 0.011 | 1484.9 | 1492.8 | 1501.5 | 1512.2 | 1524.3 | 1536.7 | 1550.8 |
| 11.0–11.9 | −16.513 | 1513.7 | 0.011 | 1487.5 | 1495.0 | 1503.4 | 1513.7 | 1525.4 | 1537.6 | 1551.4 |
| 12.0–12.9 | −20.993 | 1518.4 | 0.011 | 1493.2 | 1500.3 | 1508.3 | 1518.4 | 1530.3 | 1543.1 | 1558.6 |
| 13.0–13.9 | −27.145 | 1523.5 | 0.011 | 1498.8 | 1505.5 | 1513.3 | 1523.5 | 1536.1 | 1550.7 | 1570.2 |
| 14.0–14.9 | −33.712 | 1526.4 | 0.011 | 1502.0 | 1508.4 | 1516.0 | 1526.4 | 1540.1 | 1557.5 | 1585.7 |
| 15.0–15.9 | −40.248 | 1526.1 | 0.012 | 1501.9 | 1508.0 | 1515.5 | 1526.1 | 1540.9 | 1562.6 | 1616.2 |
| 16.0–16.9 | −46.674 | 1523.8 | 0.012 | 1499.9 | 1505.7 | 1513.0 | 1523.8 | 1540.01 | 1568.8 | 1616.2 |
| BUA | ||||||||||
| 6.0–6.9 | −0.376 | 65.871 | 0.190 | 47.1 | 52.2 | 58.1 | 65.9 | 75.1 | 85.0 | 96.6 |
| 7.0–7.9 | −0.174 | 69.384 | 0.193 | 48.8 | 54.5 | 61.0 | 69.4 | 79.1 | 89.3 | 100.9 |
| 8.0–8.9 | 0.030 | 72.994 | 0.195 | 50.5 | 56.8 | 64.0 | 73.0 | 83.2 | 93.6 | 105.1 |
| 9.0–9.9 | 0.237 | 76.531 | 0.193 | 52.3 | 59.3 | 67.0 | 76.5 | 87.0 | 97.4 | 108.5 |
| 10.0–10.9 | 0.448 | 79.624 | 0.189 | 54.1 | 61.6 | 69.8 | 79.6 | 90.1 | 100.2 | 110.7 |
| 11.0–11.9 | 0.659 | 82.559 | 0.184 | 55.8 | 63.9 | 72.5 | 82.6 | 93.0 | 102.8 | 112.7 |
| 12.0–12.9 | 0.871 | 84.034 | 0.180 | 56.2 | 64.9 | 73.9 | 84.0 | 94.3 | 103.7 | 113.1 |
| 13.0–13.9 | 1.084 | 84.704 | 0.180 | 55.6 | 65.0 | 74.4 | 84.7 | 94.9 | 104.0 | 112.9 |
| 14.0–14.9 | 1.296 | 85.437 | 0.180 | 54.7 | 64.9 | 74.9 | 85.4 | 95.6 | 104.6 | 113.2 |
| 15.0–15.9 | 1.509 | 86.373 | 0.181 | 53.6 | 64.9 | 75.5 | 86.4 | 96.6 | 105.4 | 113.7 |
| 16.0–16.9 | 1.721 | 87.294 | 0.181 | 52.2 | 64.9 | 76.1 | 87.3 | 97.5 | 106.1 | 114.2 |
| 6.0–6.9 | −0.257 | 76.885 | 0.224 | 51.5 | 58.3 | 66.3 | 76.9 | 89.7 | 103.7 | 120.2 |
| BQI | ||||||||||
| 7.0–7.9 | −0.441 | 73.115 | 0.213 | 50.6 | 56.5 | 63.6 | 73.1 | 84.8 | 97.8 | 113.5 |
| 8.0–8.9 | −0.579 | 72.425 | 0.201 | 51.4 | 56.9 | 63.6 | 72.4 | 83.4 | 95.8 | 111.0 |
| 9.0–9.9 | −0.636 | 74.702 | 0.188 | 54.3 | 59.7 | 66.1 | 74.7 | 85.3 | 97.1 | 111.5 |
| 10.0–10.9 | −0.608 | 76.274 | 0.174 | 56.6 | 61.9 | 68.1 | 76.3 | 86.1 | 96.9 | 109.9 |
| 11.0–11.9 | −0.568 | 78.723 | 0.163 | 59.3 | 64.6 | 70.7 | 78.7 | 88.2 | 98.4 | 110.3 |
| 12.0–12.9 | −0.513 | 82.258 | 0.161 | 62.1 | 67.6 | 74.0 | 82.3 | 92.0 | 102.3 | 114.3 |
| 13.0–13.9 | −0.444 | 85.849 | 0.167 | 64.0 | 70.0 | 76.9 | 85.8 | 96.4 | 107.5 | 120.4 |
| 14.0–14.9 | −0.366 | 88.664 | 0.177 | 64.7 | 71.3 | 78.9 | 88.7 | 100.2 | 112.4 | 126.5 |
| 15.0–15.9 | −0.283 | 89.589 | 0.190 | 63.8 | 70.8 | 79.0 | 89.6 | 102.0 | 115.2 | 130.4 |
| 16.0–16.9 | −0.203 | 89.427 | 0.202 | 61.9 | 69.5 | 78.2 | 89.4 | 102.7 | 116.7 | 132.8 |
M, median; S, coefficient of variation; L, power in the Box-Cox transformation; SOS, speed of sound (m/s), at broadband ultrasound attenuation (BUA, dB/MHz), Bone quality index (BQI=αSOS+βBUA).
Comparison of the bone parameters of this present research study conducted in Arequipa (Peru) and those in Hungary are graphically illustrated in Fig. 1. Comparisons began commencing with percentile 50 (LMS) for all of the age ranges.
 of the bone parameters (QUS) of children and adolescents from Arequipa (Peru) and the Hungarian international reference. SOS, speed of sound; BUA, broadband ultrasound attenuation; BQI, bone quality index.")
The children and adolescents from Arequipa presented higher SOS values than t those for the reference group from Hungary. The SOS values were higher for males: 17.8–39.5m/s, and for females: 47.7–69.5m/s. For the BQI, males and females from Arequipa showed higher values in relation to the Hungarian reference. These values were greater for males starting from 29.7 to 40.3 and for females from 19.1 to 29.3, respectively. These comparisons were calculated mathematically.
With regard to the broadband ultrasound attenuation (BUA), the females from Arequipa showed higher values in all age ranges when compared with the international reference, except for age 16.9 years old. At this age, the values were similar. Elevated values began at 1.7–14.5 (dB/MHz). However, for males, the pattern of higher values was maintained until age 13.9 years old, and later the attenuation diminished drastically to −1.9 to −4.8dB/MHz until age 14.0. At 16.0 years old, the values resembled the international reference.
DiscussionThe researchers of this study proposed percentiles to evaluate the bone health of children and adolescents living at a moderate altitude. The quantitative ultrasound technique was used to analyze bone micro-structures, BMD of the calcaneus (heel bone),5 and bone elasticity.19
The calcaneus is the site most commonly used in the skeleton for ultrasound.20 It represents 95% of the trabecular bone and is composed of two lateral surfaces that facilitate the use of the ultrasound.3
In this sense, a number of studies used bone parameters (BUA, SOS, and BQI) to report values in percentiles. The results from those studies coincide with the results described in this current study, organized based on age and sex.2,6,9,21 Furthermore, the maximum bone mass is reached between the ages of 16.0–18 years old in both sexes, and they are similar to those in studies cited previously.
Consequently, as a result of the different ethnicities, genders, and protocols used, the researchers proposed reference values to evaluate bone parameters (SOS, BUA, and BQI) for students living at a moderate altitude in Peru. The percentiles, in general, are widely used in medical practice for identifying individuals differing from the normal distribution of their population.22
The specific reference values proposed here may be used to assess bone health in different categories (normal, low quality, and very low bone quality). These are approximations for identifying subjects with greater risk in their skeletal status based on age and sex. These categories may be interpreted as normal (>p10), low quality (p3–p10), and at very low quality (23 Therefore, they need to be analyzed with caution.
In essence, osteoporosis is a systemic bone disease that is characterized by low bone mass and a rapid deterioration of the micro-structures of the bone, resulting in bone fragility and eventual fractures.24 In this context, QUS technology is a valuable tool to assess general bone resistance and strength quickly and accurately in student centers. Therefore, the proposed percentiles could assist in decision making at the student level (physical education classes) and in clinical settings (clinics, hospitals, and health centers).
The results of this research have shown that the bone parameters of children and adolescents from Arequipa (Peru) are higher values of the SOS, and BQI when compared with the international reference.6 However, with regard to the attenuation (BUA), until the onset of adolescence, both sexes of the students from Arequipa presented higher attention values than those of the international reference. However, for females in the last ages (15.0–16.9 years old), the attenuation values were similar to those of the reference. On the other hand, the males showed a drastic fall, but at advanced ages, they resembled the Hungarians. Perhaps, these patterns observed in the males are temporary changes produced by biological maturation since the fall seems to disappear at more advanced ages and close to adulthood.
The results from this current research could be related to a combination of factors that generally contribute to bone strength of the students studied. Apparently, this observed phenomenon in children and adolescents living at a moderate altitude could be due to a greater width of the bones. These change slowly during the growth process. Consequently, in the long term, they are considered to be the determinants of bone strength throughout life.25
In fact, these physical characteristics observed in this study are related to ethnic factors since, according to Eveleth and Micozzi,26 the mestizos from Peru, Bolivia, Guatemala, and Mexico, typically, are robust and short. In part, these factors could explain the results obtained in the present study. In spite of this, other factors could be at play, such as the impact of genetics, nutrition, and levels of physical activity.27 However, in the past few years, 2001–2013, the Peruvian population has improved its caloric intake by 14.8%.13 In part, this may explain the relatively higher bon parameter values observed in this research.
In general, the increase in bone width is functionally driven by muscle growth.28 These, in turn, are determined by nutrition with a high calcium intake (favors the periosteum) and the daily practice of physical activity.29 The sum of these factors and ethnicity could account for the typical bone health characteristics of children and adolescents of diverse geographical regions around the world.
These parameters, in general, characterize modern societies independent of the altitude where individuals live and their lifestyle. Thus, it is well known that they change over time. Generally, these parameters reflect modifications in the bone structure and in bone mineral content as well as combinations of these.30
More studies are needed to verify the state of bone health of students living at a moderate altitude in Peru. Furthermore, conducting longitudinal studies could contribute to a more critical analysis of this type of population. In general, cross-sectional studies are limited to examining occurrences in a determined moment in time and place. In addition, it is necessary to control for the degree of physical activity, bone diameters, and the type of nutrition. These criteria could help characterize students living at a moderate altitude in Peru. However, on the contrary, this research study is the first one of its kind carried out in Peru. It could make a contribution as a reference study for researchers as well as for health care and sports professionals. The calculations for this research may be accessed online: http://reidebihu.net/calcaneo_aqp.php.
In conclusion, the students living at a moderate altitude in Peru presented slightly higher bone parameters when compared with the international reference. This pattern depicts a population with a better state of bone health. Furthermore, the proposed percentiles may be used with children and adolescents living at a moderate altitude in Peru. These percentiles may be used to identify, categorize, and monitor the degree of risk for bone disease based on age and sex.
Conflict of interestThe authors declare no conflicts of interest.
Santa Maria Catholic University Project, Arequipa, Peru.
Please cite this article as: Gómez-Campos R, Sulla-Torres J, Andruske CL, Campos LF, Luarte-Rocha C, Cossio-Bolaños W, et al. Ultrasound reference values for the calcaneus of children and adolescents at moderate altitudes in Peru. J Pediatr (Rio J). 2020;97:88–95.


