


To evaluate the reliability and validity of the Brazilian version of the Pittsburgh Sleep Quality Index.
Methods309 adolescents, subdivided into a sample of 209 subjects, of whom 25 were reassessed, and another sample of 100 adolescents. Reliability was assessed using Cronbach's α-values, intraclass correlation coefficient, Standard Error of Measure, Minimum Detectable Change, and Bland–Altman plotting. Exploratory analysis of the questionnaire components was performed based on the sample of 209 adolescents. Confirmatory factor analysis was performed with a sample of 100 individuals.
ResultsThe sample of 209 participants had a mean age of 14.38 (±1.94) years, comprising 80 (38.3%) girls and 129 (61.7%) boys. The sample of 100 adolescents had a mean age of 13.66 (±2.35) years, comprising 51 (51%) girls and 49 (49%) boys. The questionnaire obtained a Standard Error of Measure=1.12 and Minimum Detectable Change=3.10. Cronbach's α was 0.71 and the Intraclass Correlation Coefficient was 0.65 (95% CI: 0.21–0.85). The factor analysis showed that the best model of components was the one that consisted of two factors, excluding the component on the use of sleep medications.
ConclusionThe questionnaire showed high internal consistency and moderate reliability. Furthermore, a model with two factors seems to be the most appropriate to evaluate the quality of sleep in adolescents.
Avaliar a confiabilidade e validade da versão brasileira do Índice de Qualidade do Sono de Pittsburgh.
Métodos309 adolescentes, subdivididos em uma amostra de 209 indivíduos, dos quais 25 foram reavaliados, e outra amostra de 100 adolescentes. A confiabilidade foi avaliada por meio dos valores de α de Cronbach, Coeficiente de Correlação Intraclasse, Erro Padrão da Medida, Mínima Mudança Detectável e plotado gráfico Bland-Altman. A análise exploratória dos componentes do questionário foi realizada com base na amostra de 209 adolescentes. A análise fatorial confirmatória foi realizada com a amostra de 100 indivíduos.
ResultadosA amostra de 209 participantes teve uma média de idade de 14,38 (± 1,94) anos, sendo 80 (38,3%) meninas e 129 (61,7%) meninos. A amostra composta por 100 adolescentes, teve uma média de idade de 13,66 (± 2,35) anos, sendo 51 (51%) meninas e 49 (49%) meninos. O questionário obteve Erro padrão da Medida=1,12 e Mudança mínima detectável=3,10. O α de Cronbach foi de 0,71 e Coeficiente de Correlação Intraclasse de 0,65 (IC95% 0,21 - 0,85). As análises fatoriais apontaram como melhor modelo de componentes aquele composto por dois fatores, com exclusão do componente sobre uso de medicamentos para dormir.
ConclusãoO questionário obteve elevada consistência interna e confiabilidade moderada. Além disso, um modelo de dois fatores parece ser o mais adequado para avaliar a qualidade do sono em adolescentes.
Sleep is a fundamental biological process, especially in the adolescent population, as growth hormone, which is essential for the individual's physical development, is secreted during sleep.1 Inadequate sleep can cause damage to psychosocial health and academic performance, and can result in risk behavior development.2
Many tools can be used to assess the presence of sleep disorders, including questionnaires that can be used in clinical practice and epidemiological studies.3 In Brazil, some tools that evaluate sleep habits have been validated, such as the Children's Sleep Habits Questionnaire (CSHQ), which aims to assess sleep problems in individuals, but is restricted to children.4 The Morning/Evening Scale was validated for adolescents, which is limited to assessing wake-up and bedtime hours in adolescents, calling them morning and evening.5
The Pittsburgh Sleep Quality Index (PSQI) is a self-administered tool used to evaluate sleep quality and possible disorders in the previous month. It was developed by Buysse et al. in 1989 and validated in Brazil, in the adult population, by Bertolazi et al. in 2011. The questionnaire has been widely used in different populations, having been translated into and validated for different languages.6–10
In 2006, when assessing the structure of the PSQI in healthy adults and those with depression, Cole et al. questioned the capacity of the single PSQI score to measure the multidimensional nature of sleep disorders.11 After factorial analyses of the components, the authors suggested that a three-factor score model would more appropriate to assess sleep characteristics. Other studies also provided evidence that a model with one more factor would be more appropriate to evaluate sleep characteristics in specific populations.12–15 However, the study population characteristics can modify the structure of the questionnaire factors.
The Brazilian version of this tool was validated in an adult population; however, there is a lack of studies assessing the reliability of this tool in adolescent populations. Given this fact and the need to assess the factorial structure of the questionnaire in different populations, this study had a dual purpose: assessing the reliability of this sleep quality assessment tool and performing the factorial analysis of the PSQI components in adolescents.
MethodsParticipantsThe study population consisted of male and female adolescents, aged between 10 and 19 years, who engaged in amateur sports practice, from the city of Petrolina, state of Pernambuco, Brazil, in 2014. After performing a survey in schools and sports centers, a population of 521 young amateur athletes was identified. As the study performed three different analyses, it was necessary to perform different sampling procedures, as described below.
In the first stage, to perform the exploratory factor analysis, the following criteria were considered: estimated population of 521 amateur athletes; confidence interval of 95%; sampling error of five percentage points; estimated prevalence of sleep disorders of 30%,16 which yielded the minimum sample of 200 adolescents. However, this subsample was constituted by 209 adolescents.
To quantify the necessary sample to carry out the second stage, which included the analysis of the interday reliability (test–retest) of the questionnaire, the GPower 3.1.7 program was used, considering an α=0.05; β=0.10 (90% power), proportion of correlation for the null hypothesis (H0 ρ)=0.40, and proportion of correlation for the alternative hypothesis (H1 ρ)=0.80, resulting in a minimum necessary sample size of 25 adolescents. These subjects were recruited at random from the initial sample of 209 adolescents.
In the third stage, to perform the confirmatory factor analysis, the study evaluated 100 adolescents, who belonged to an independent sample, according to the recommendations from guidelines on factor analysis.17
Therefore, 309 adolescents participated in the study, and all participants who had the Free and Informed Consent form signed by the parents/guardians or signed by participants over 18 years of age were included. The exclusion criterion was considered as inadequate questionnaire completion. The study was approved by the Research Ethics Committee of Universidade de Pernambuco.
ToolThe tool used in the study was the Brazilian version of the Pittsburg Sleep Quality Index (PSQI), which was translated and validated by Bertolazi et al. in 2011. It is noteworthy that no adjustment was made in the original tool to carry out this study. The questionnaire was developed by Buysse et al. in 1989, with 19 questions regarding sleep quality and disorders in the previous month. The questionnaire evaluates seven sleep components: subjective quality of sleep, sleep latency, sleep duration, sleep efficiency, sleep disorders, medication use, and daytime dysfunction. The score can range from 0 to 3 for each component, with a maximum total score of 21 points. Scores above 5 points indicate poor quality of sleep.
Statistical analysisThe mean and standard deviation values were calculated for numerical variables. Cronbach's α-value was calculated for the analysis of internal consistency, with values above 0.70 indicating high internal consistency.18 The standard error of measure (SEM) and the minimum detectable change (MDC) were also calculated. The t-test for single samples was performed to evaluate the possible presence of a significant difference between the scores in the test and retest, and a Bland–Altman plot was constructed for the assessment of absolute agreement between test and retest. This method allows the visualization of the bias, the error, as well as outliers and trends.19
The validity of PSQI components was performed through a factor analysis with a varimax orthogonal rotation, with the sample of 209 adolescents. In this analysis, values>0.30 were considered as showing a strong factor loading.18 To assess the relative agreement between the test–retest of the total questionnaire scores and the scores of the factors formed in the exploratory factor analysis, the intraclass correlation coefficient (ICC) was calculated with a 95% confidence interval (95% CI). This analysis can vary between 0 and 1, with values between 0 and 0.4 indicating poor reliability, 0.4–0.75 moderate, and 0.75–1, excellent reliability.20
A confirmatory factor analysis was also performed with a sample of 100 individuals, based on the models obtained from the exploratory factor analysis. The adequacy of the model was assessed based on the following adjustment criteria: standardized root mean square residual (SRMR) with values equal or less than 0.08, comparative fit index (CFI) with values above 0.95, and root mean square error of approximation (RMSEA) with values between 0.05 and 0.08.21,22
The analyses were performed using the statistical package SPSS (IBM Corp. Released 2011. IBM SPSS Statistics for Windows, version 20.0, USA), GraphPadPrism (GraphPad Prism version 5.05 for Windows, GraphPad Software, USA), and SPSS Amos (Amos, version 23.0, Computer Program: IBM SPSS, USA).
ResultsOf the total sample of 309 adolescents, 131 (42.4%) were females and 178 (57.6%) were males. A subsample of 209 participants had a mean age of 14.38 (±1.94) years, comprising 80 (38.3%) girls and 129 (61.7%) boys, whereas the sample of 100 adolescents had a mean age of 13.66 (±2.35) years, with 51 (51%) girls and 49 (49%) boys.
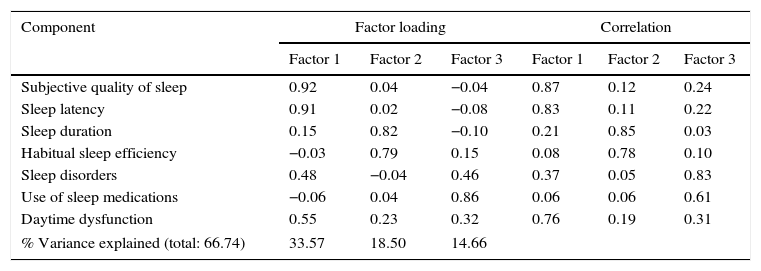
Exploratory factor analysisThree models of components were identified in the exploratory factor analysis of the PSQI carried out with the sample of 209 adolescents. The model comprising three factors accounted for 66.57% of the total variance explained (Table 1). In this model, the components of sleep disorders and daytime dysfunction were the first and third factors.
Three-factor component matrix and correlation matrix of components with the PSQI factors (n=209).
| Component | Factor loading | Correlation | ||||
|---|---|---|---|---|---|---|
| Factor 1 | Factor 2 | Factor 3 | Factor 1 | Factor 2 | Factor 3 | |
| Subjective quality of sleep | 0.92 | 0.04 | −0.04 | 0.87 | 0.12 | 0.24 |
| Sleep latency | 0.91 | 0.02 | −0.08 | 0.83 | 0.11 | 0.22 |
| Sleep duration | 0.15 | 0.82 | −0.10 | 0.21 | 0.85 | 0.03 |
| Habitual sleep efficiency | −0.03 | 0.79 | 0.15 | 0.08 | 0.78 | 0.10 |
| Sleep disorders | 0.48 | −0.04 | 0.46 | 0.37 | 0.05 | 0.83 |
| Use of sleep medications | −0.06 | 0.04 | 0.86 | 0.06 | 0.06 | 0.61 |
| Daytime dysfunction | 0.55 | 0.23 | 0.32 | 0.76 | 0.19 | 0.31 |
| % Variance explained (total: 66.74) | 33.57 | 18.50 | 14.66 | |||
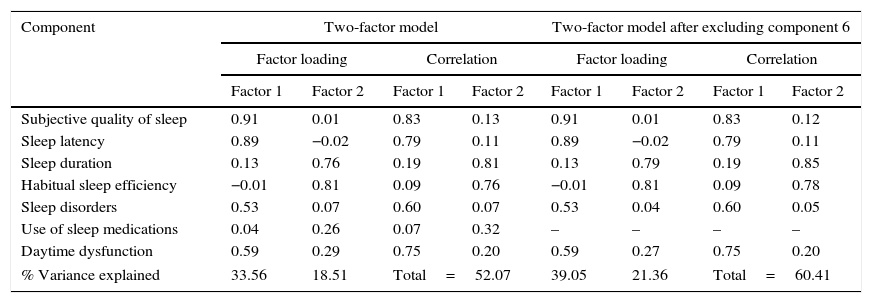
Thus, the exploratory factor analysis of a two-factor model was performed, showing a variance explained of 52.07% (Table 2). However, the component related to the sleep medication use obtained poor factor loading and low correlation in relation to the scores of factors, and thus, it was not allocated in any factor. Therefore, the analysis of a model consisting of two factors was performed, after excluding the component on medication use, showing a variance explained of 60.41% (Table 2).
Component matrix and correlation component matrix of the two-factor model and two-factor model after excluding the component on sleep medication use of PSQI (n=209).
| Component | Two-factor model | Two-factor model after excluding component 6 | ||||||
|---|---|---|---|---|---|---|---|---|
| Factor loading | Correlation | Factor loading | Correlation | |||||
| Factor 1 | Factor 2 | Factor 1 | Factor 2 | Factor 1 | Factor 2 | Factor 1 | Factor 2 | |
| Subjective quality of sleep | 0.91 | 0.01 | 0.83 | 0.13 | 0.91 | 0.01 | 0.83 | 0.12 |
| Sleep latency | 0.89 | −0.02 | 0.79 | 0.11 | 0.89 | −0.02 | 0.79 | 0.11 |
| Sleep duration | 0.13 | 0.76 | 0.19 | 0.81 | 0.13 | 0.79 | 0.19 | 0.85 |
| Habitual sleep efficiency | −0.01 | 0.81 | 0.09 | 0.76 | −0.01 | 0.81 | 0.09 | 0.78 |
| Sleep disorders | 0.53 | 0.07 | 0.60 | 0.07 | 0.53 | 0.04 | 0.60 | 0.05 |
| Use of sleep medications | 0.04 | 0.26 | 0.07 | 0.32 | – | – | – | – |
| Daytime dysfunction | 0.59 | 0.29 | 0.75 | 0.20 | 0.59 | 0.27 | 0.75 | 0.20 |
| % Variance explained | 33.56 | 18.51 | Total=52.07 | 39.05 | 21.36 | Total=60.41 | ||
The adequacy measure value of the Kaiser–Meyer–Olkin sample was 0.59, indicating moderate adequacy of the three assessed models. Bartlett's sphericity test – chi-squared had an approximate χ2=382.992 (p=0.000), demonstrating adequate exploratory factor analysis for all models.
ReliabilityThe PSQI obtained a SEM of 1.12 points, and an MMD value of 3.10 points. The test-retest reliability of the total PSQI score obtained an ICC of 0.65 (95% CI: 0.21–0.85). The PSQI showed high internal consistency, with Cronbach's α of 0.71. After excluding the score of the component related to sleep medication use, there was an increase in the tool's internal consistency value, with Cronbach's α of 0.73.
There was a statistical difference between the PSQI scores in the test and retest (p<0.001), indicating the presence of systematic error, confirmed by the Bland–Altman plot.19Fig. 1 shows the analysis of absolute agreement at the test and retest between the means of the total score, with all components and after excluding the component on sleep medication use.
 Total score with all components; (B) total score excluding the component on the use of sleep medications.")
Based on the composition of factors, test–retest reliability between the scores of the different models was calculated. For the three-factor model, the ICC values were 0.59 (95% CI: 0.09–0.82), 0.71 (95% CI: 0.35–0.87), and 0.81 (95% CI: 0.56–0.91) for the first, second, and third factor, respectively. For the model consisting of two factors, the ICC was 0.67 (95% CI: 0.26–0.86) and 0.64 (95% CI: 0.19–0.84). The model consisting of two factors, after the exclusion of the component on sleep medication use, obtained an ICC of 0.67 (95% CI: 0.26–0.86) and 0.71 (95% CI: 0.35–0.87).
Confirmatory factor analysisBased on the exploratory factor analysis, the confirmatory factor analysis of the two- and three-factor models was performed. All models obtained from adjustments values considered adequate. The first model, consisting of three factors, obtained values of SRMR=0.07, RMSEA=0.08, and CFI=0.95. The second model consisting of two factors obtained values of SRMR=0.07, RMSEA=0.06, and CFI=0.97. The third model, also consisting of two factors, but excluding the component on sleep medication use, obtained values of SRMR=0.06, RMSEA=0.06, and CFI=0.97 (Fig. 2).

Best model resulting from the confirmatory factor analysis of the PSQI, consisting of two factors after excluding the component on sleep medication use. The oval representations denote the latent variables, while the squares represent the measured variables. The values close to those components represent the factor loadings. The remaining values represent the existing correlations.
The PSQI has been widely used in studies; however, it has been questioned whether the index total score is capable of evaluating the multidimensional characteristics of sleep, making it necessary to perform the analysis of the tool's factor structure. In this study, the exploratory factor analysis yielded a first model consisting of three factors with a high percentage of explained variance; however, the components of sleep disorders and daytime dysfunction were the first and third factors. Therefore, it was decided to perform the analysis of a second model with two factors, which showed a decrease in the percentage of explained variance and low factor loading of the component on medication use, indicating this is not a useful representative factor in model construction.17
Considering this result, a third model was built with two factors after excluding this component, with an increase in the percentage of explained variance being observed in relation to the second model, as well as an adequate distribution of all components. Therefore, the third model showed better structure in the exploratory factor analysis, being formed by a first factor consisting of the components: subjective sleep quality, sleep latency, sleep disorders, and daytime dysfunction; and a second factor consisting of sleep duration and habitual sleep efficiency.
Subsequently, the confirmatory factor analysis was performed with the three proposed models. The results of this analysis indicate acceptable adjustments values for all models. However, considering the more consistent construction in the exploratory factor analysis and adequate adjustment values in the confirmatory factor analysis, the model consisting of two factors after the exclusion of the component on sleep medication use appears to be more adequate to assess the quality of sleep in adolescents.
The negative results related to the component on sleep medication use can be explained by the low prevalence of medication use, which was only 3.6%. A study carried out with young adults also found a low prevalence of medication use, of 3.9%, showing the low factor loading of this component.12 The authors then analyzed models after this component had been removed, but there was no great impact on the adjusted values. However, it is noteworthy that the use of sleep medication is low in young and middle-aged adults, with an increase in older adults or individuals with specific diseases.23 On the other hand, in a study of young individuals, the authors reported that the component on sleep medication use contributed negatively to the tool's internal consistency.24 Similarly, in this study, there was an increase in the internal consistency of the PSQI, which was initially 0.71, to 0.73 after excluding the component on medication use. Therefore, it is speculated that the assessment on sleep medication use cannot be a significant measure of sleep quality in younger individuals, especially in adolescents.
Different studies have shown that the PSQI construction with multiple factors appears to be more adequate for the assessment of different sleep characteristics in adult populations.10,25 As for individuals with specific diseases, there is disagreement regarding the best questionnaire structure, considering that in transplanted patients and those with chronic fatigue syndrome, the PSQI factor analysis showed that a model consisting of three factors would be more adequate to evaluate sleep13,15; whereas in patients with breast cancer, the original model of a single score showed to be valid and capable of evaluating sleep disorders.14
In this sense, differences can be observed regarding the proposal of the most adequate tool structure, which varies according to the subject's age and specific diseases. Therefore, the questionnaire structure should not be generalized to evaluate the quality of sleep in different populations, as the factorial analysis of components is required.
Another important aspect to be assessed is tool reproducibility, considering the possibility of using it in different moments, as well as to review the specific treatment effect. The present findings indicate a moderate reliability of PSQI for adolescents, with an ICC of 0.65. However, studies that proposed to evaluate the tool test-retest reliability in adult populations obtained high reliability, with Pearson's correlation coefficient values of 0.83 and 0.87.6,26 This divergence of results can be explained by the difference in measurement of reliability used, as Pearson's correlation coefficient is not considered an appropriate measure, as it evaluates the association between methods and not the agreement between them.19
Therefore, it is necessary to analyze the questionnaire reliability using a combination of measures to evaluate it both relatively and absolutely. In this sense, the analysis of the Bland–Altman plot of the total score was performed with all questionnaire components, as well as the score after excluding the component on sleep medication. The presence of an outlier in both plots and the concentration of the majority of the points above zero is noteworthy. This result, together with the presence of significant differences between the means of questionnaire scores, indicates the presence of systematic error. In this context, it is important to know the tool variation in absolute terms and, subsequently, the SEM and MDC values are calculated.
The SEM and MDC values of the questionnaire were 1.12 and 3.10 points, respectively. It is noteworthy that there are no studies that assessed these measures in adolescent populations. Thus, knowledge of the variability associated to the repeated application and the minimum amount of change that does no result from an error in measurement is essential to determine the minimum value indicative of change in the quality of sleep, after a possible intervention in this population.
Finally, the Brazilian version of PSQI showed high internal consistency and moderate reliability in adolescents. The original version of the tool was valid for evaluation of sleep disorders in adolescents; however, the model consisting of two factors, after excluding the component on the use of sleep medications, showed optimal adjustment values and appears to be the most adequate to assess the different characteristics of sleep in this population.
FundingHigher Education Personnel Improvement Coordination (Capes).
Conflicts of interestThe authors declare no conflicts of interest.
Please cite this article as: Passos MH, Silva HA, Pitangui AC, Oliveira VM, Lima AS, Araújo RC. Reliability and validity of the Brazilian version of the Pittsburgh Sleep Quality Index in adolescents. J Pediatr (Rio J). 2017;93:200–6.


