To compare the autonomic behavior between malnourished children and a control group using analysis of heart rate variability (HRV).
MethodData were analyzed from 70 children who were divided into two groups: malnourished and eutrophic, according to the Z-score nutritional status for height and age. For analysis of HRV indices, heart rate was recorded beat to beat with the child in the supine position for 20min. The analysis of these indices was performed using linear methods, analyzed in the time and frequency domains. Student's t-test for unpaired data and the Mann–Whitney test were used to compare variables between groups, with a significance level of 5%.
ResultsA reduction in systolic and diastolic blood pressure and an increase in heart rate were found in malnourished children compared to eutrophic children. The HRV indices suggested that malnourished children present reductions in both sympathetic and parasympathetic autonomic nervous system activity. The SDNN, rMSSD, NN50, pNN50, SD1, SD2, TINN, LF (ms2), and HF (ms2) indices were lower in malnourished children.
ConclusionMalnourished children present changes in cardiac autonomic modulation, characterized by reductions in both sympathetic and parasympathetic activity, as well as increased heart rate and decreased blood pressure.
Avaliar a modulação autonômica cardíaca de crianças desnutridas por meio da variabilidade da frequência cardíaca (VFC).
MétodoForam analisadas 70 crianças com média de idade de 3.71 anos, que foram distribuídas em dois grupos, de acordo com o estado nutricional: desnutridas e eutróficas, seguindo o escore Z, para estatura e idade. Para análise dos índices da VFC, a frequência cardíaca foi captada batimento a batimento com as crianças em decúbito dorsal por 20 minutos. A análise desses índices foi realizada por meio de métodos lineares, analisados nos domínios do tempo e da frequência. Teste t de Student para dados não pareados e teste de Mann-Whitney foram aplicados para comparar as variáveis entre os grupos, com nível de significância de 5%.
ResultadosRedução da pressão arterial sistólica e diastólica e aumento na frequência cardíaca foram encontrados nas crianças desnutridas quando comparada às eutróficas. Os índices da VFC sugerem que crianças desnutridas apresentam uma redução da modulação simpática e parassimpática do sistema nervoso autônomo. Os índices SDNN, rMSSD, NN50, pNN50, SD1, SD2, TINN, BF e AF em ms2 foram menores nas crianças desnutridas.
ConclusãoCrianças desnutridas apresentam modificações na modulação autonômica cardíaca caracterizada por depressão no componente simpático e no parassimpático, bem como aumento na frequência cardíaca e diminuição da pressão arterial.
Malnutrition is considered a serious public health problem.1 Epidemiological data indicate that it affects about 15.5% of the population worldwide and a third of this is children.2 The consequences of malnutrition in children include, among others: problems in physical development, such as short height, reduced muscle mass, and a decline in bone calcification; effects on physiological conditions, providing an inefficient immune system; iron deficiency anemia and frequent bacterial proliferation; and delayed mental development, with learning disabilities.3 Therefore, child malnutrition promotes permanent damage to health and thus promotes high mortality.3
Furthermore, studies have shown that malnutrition produces changes in the function of the autonomic nervous system in children.4 This condition of imbalance may represent an important negative factor, since the autonomic function controls some of the internal functions of the body and, accordingly, deserves attention.
One way to evaluate the behavior of the autonomic nervous system is heart rate variability (HRV), a simple and non-invasive tool aimed at the detection and study of cardiac autonomic dysfunction, either in physiological or pathological conditions.5
Studies that investigate autonomic modulation in child malnutrition are scarce. Only one study including children, which evaluated the modulation of the autonomic nervous system in malnutrition using HRV, was found in the literature.4 Sirivastava et al.4 compared the HRV of malnourished children with healthy children matched for sex and age. The authors found that the low frequency (LF) index in normalized units and the LF/high frequency (HF) ratio presented an increase, whereas the HF index in normalized units presented a reduction in the group of malnourished children. In conclusion, the authors suggested that cardiac autonomic function characterized by increased sympathetic modulation occurs in malnourished children.
Other studies6,7 show increased sympathetic modulation of the autonomic nervous system in malnutrition. Belchior et al.7 analyzed the effect of protein malnutrition in rats and found an increase in blood pressure, however, alterations in vascular reactivity were not found, whereas Sawaya et al.6 found a strong association between malnutrition and hypertension. These studies suggest possible changes in HRV. This correlation could be considered an important tool for determining prognosis and the need for special attention and care toward the autonomic nervous system and cardiovascular function in malnourished children.
In this context, understanding malnutrition, the causal factors, and the consequences and repercussions becomes important, reiterating its status as a public health problem. Malnutrition appears to promote changes in cardiac autonomic behavior; however, data on the analysis of this behavior are scarce. Considering that growth affects the cardiovascular system8 and has a significant effect on the maturation of the autonomic nervous system and its representations in cardiac modulation,9 this scenario is problematic.
Thus, with the intention of adding elements to the literature related to the above issue, this study aimed to compare the autonomic behavior between eutrophic and malnourished children aged 3–5 years, based on the analysis of HRV indices.
MethodsPopulationTo conduct this study data were analyzed from 70 children of both sexes, aged between 3 and 5 years, divided into two groups: malnourished and eutrophic. Malnourished children were considered those with a Z-score of less than −2 in relation to height for their age, according to the criteria established for age and sex by the World Health Organization,10 and eutrophic those with Z-scores higher or equal to −2 and less than +3.10
The malnourished group was composed of 35 children, 23 female (65.71%), while the eutrophic group was composed of 35 children, 20 female (57.14%). The sample size calculation was performed considering as a variable the square root of the mean squared differences between adjacent normal RR intervals in an interval of time (rMSSD) index. The magnitude of significant difference assumed was 7.0ms, considering a standard deviation of 10.12ms, based on a pilot study, with an alpha risk of 5% and beta of 80%, the sample size resulted in 33 children per group.
The exclusion criteria were as follows: use of medications that could influence autonomic activity of the heart, and the presence of infections and known metabolic and/or cardiorespiratory disorders, which could affect the cardiac autonomic control.
The volunteers and their parents were informed about the procedures and objectives of this study, and after agreeing, a parent/guardian signed the informed consent. All procedures were approved by the Committee for Ethics in Research of the State University of Ceará (Protocol 275.310).
Study designData collection was performed in a room with an ambient temperature between 21 and 23°C and humidity between 40% and 60%, in the morning to avoid circadian variation. To reduce the child's anxiety during collection, only the researcher and the person responsible for the child remained in the room.
Initially, personal information on the children was collected, such as name, age, sex, and data on their health status. Following this, a physical examination was performed that included determination of weight and height to calculate the Z-score of height for age, and measurement of blood pressure and heart rate.
Weight and height were recorded using a mechanical anthropometric scale (Balmak®, SP, Brazil), with a capacity of 150kg. Heart rate was measured using a heart rate monitor (Polar Electro Oy® – model RS800CX, Finland) and blood pressure indirectly using a stethoscope (Littmann®, Lightweight II SE, Littmann, USA) and an aneroid infant sphygmomanometer with an arm diameter range of from 10 to 18cm (Premium®, China) on the left arm of the child, in accordance with criteria established by the VI Brazilian Hypertension Guidelines.11 To avoid errors in the determination of blood pressure values, a single evaluator performed the measurements for this parameter throughout the experiment.
After these procedures, the electrode of capture strap was moistened with water and then was placed on the child's chest, over the region of the precordium, and the heart rate monitor in his/her fist; this equipment had been previously validated for capture of heart rate beat to beat and the subsequent use of data for analysis of HRV.12 After placement of the strap and monitor, the child was positioned in the Fowler supine position at 30° and remained at rest for 20min breathing spontaneously. Following this collection period the child was released.
Analysis of HRVFor HRV analysis, heart rate was recorded beat to beat during the entire protocol with a sampling rate of 1000Hz. For data analysis, 1000 consecutive RR intervals were used after digital filtering in the software Polar Precision Performance SW (Polar®, version 4.01.029, USA), complemented by manual elimination of premature ectopic beats and artifacts. Only series with more than 95% sinus beats were included in the study.5 The absence of ectopic beats or artifacts that could interfere in the analysis of HRV was verified through visual analysis of the time series.
HRV analysis was performed using linear methods, analyzing the time and frequency domains, and by geometric methods. In the time domain the following indices were used: rMSSD, SDNN (standard deviation of all normal RR intervals), pNN50 (percentage of adjacent RR intervals with difference of duration longer than 50ms), and the RR intervals.5
In the frequency domain, the spectral components of LF and HF in milliseconds squared (ms2) and in normalized units, and the relationship between them (LF/HF) were used. The frequency bands used for each component were: LF=0.04–0.15Hz and HF=0.15–0.40Hz.5 The spectral analysis was calculated using a Fast Fourier Transform.5 The normalization of the spectral analysis data was used to minimize the effects of changes in the VLF band and was determined from the division of power rating a given component (LF or HF) by the total power spectrum, minus the very low frequency component and multiplied by 100.5
For HRV analysis through geometrical methods, the following indices were used: triangular (calculated from the construction of a density histogram of normal RR intervals, which showed the length of RR intervals on the horizontal axis (x), and the frequency with which each occurred on the vertical axis (y), TINN (total number of RR intervals used to construct the histogram divided by the modal frequency), and the indices obtained from the Poincaré plot (SD1 [dispersion of points perpendicular to the line of identity which appears to be an index of instantaneous recording of beat-to-beat variability], SD2 [dispersion of the points along the line of identity, representing HRV in long-term register] and SD1/SD2 ratio [ratio between short and long variations of RR intervals]).5 All HRV indices were obtained through Kubios HRV, version 2.0 software (Kubios software, Finland).5
Statistical analysisFor the characterization of the population the descriptive statistical method was used and the results were presented as mean, standard deviation, median, minimum, maximum, and percentage values.
For comparison of groups, initially, data normality was determined (Shapiro–Wilk test), and when the normal distribution was accepted, Student's t-test for unpaired data was applied. In situations where the normal distribution was not accepted, the Mann–Whitney test was applied. Differences in these tests were considered statistically significant when the p-value was less than 0.05.
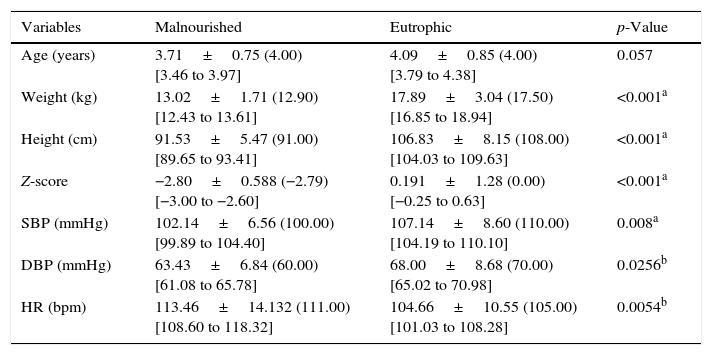
ResultsThe anthropometric characteristics, Z-score, and cardiovascular parameters of the study groups can be seen in Table 1. There was no statistically significant difference between groups with respect to age (p=0.057). However, lower values of the following variables were observed: weight, height, Z-score, and systolic (SBP) and diastolic (DBP) blood pressure for malnourished children, whereas the heart rate values were higher in these children.
Mean values followed by standard deviations, medians, and 95% confidence intervals for the anthropometric variables, Z-score, and cardiovascular parameters of the analyzed groups.
| Variables | Malnourished | Eutrophic | p-Value |
|---|---|---|---|
| Age (years) | 3.71±0.75 (4.00) [3.46 to 3.97] | 4.09±0.85 (4.00) [3.79 to 4.38] | 0.057 |
| Weight (kg) | 13.02±1.71 (12.90) [12.43 to 13.61] | 17.89±3.04 (17.50) [16.85 to 18.94] | <0.001a |
| Height (cm) | 91.53±5.47 (91.00) [89.65 to 93.41] | 106.83±8.15 (108.00) [104.03 to 109.63] | <0.001a |
| Z-score | −2.80±0.588 (−2.79) [−3.00 to −2.60] | 0.191±1.28 (0.00) [−0.25 to 0.63] | <0.001a |
| SBP (mmHg) | 102.14±6.56 (100.00) [99.89 to 104.40] | 107.14±8.60 (110.00) [104.19 to 110.10] | 0.008a |
| DBP (mmHg) | 63.43±6.84 (60.00) [61.08 to 65.78] | 68.00±8.68 (70.00) [65.02 to 70.98] | 0.0256b |
| HR (bpm) | 113.46±14.132 (111.00) [108.60 to 118.32] | 104.66±10.55 (105.00) [101.03 to 108.28] | 0.0054b |
bpm, beats per minute; SBP, systolic blood pressure; DBP, diastolic blood pressure; HR, heart rate.
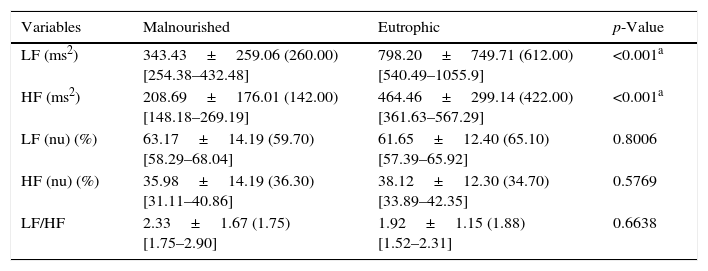
Table 2 presents the values obtained for the LF and HF indices, in normalized units and ms2, and the LF/HF ratio of the malnourished and eutrophic groups. The study revealed significantly lower values for the malnourished group compared with the eutrophic group for the LF and HF indices in ms2, whereas the values of LF and HF in normalized units and the LF/HF ratio showed that there were no statistically significant differences when comparing the two groups.
Mean values followed by standard deviations, medians, and 95% confidence intervals for LF (ms2), HF (ms2), LF (nu), HF (nu), and the LF/HF ratio obtained in malnourished and eutrophic children.
| Variables | Malnourished | Eutrophic | p-Value |
|---|---|---|---|
| LF (ms2) | 343.43±259.06 (260.00) [254.38–432.48] | 798.20±749.71 (612.00) [540.49–1055.9] | <0.001a |
| HF (ms2) | 208.69±176.01 (142.00) [148.18–269.19] | 464.46±299.14 (422.00) [361.63–567.29] | <0.001a |
| LF (nu) (%) | 63.17±14.19 (59.70) [58.29–68.04] | 61.65±12.40 (65.10) [57.39–65.92] | 0.8006 |
| HF (nu) (%) | 35.98±14.19 (36.30) [31.11–40.86] | 38.12±12.30 (34.70) [33.89–42.35] | 0.5769 |
| LF/HF | 2.33±1.67 (1.75) [1.75–2.90] | 1.92±1.15 (1.88) [1.52–2.31] | 0.6638 |
LF, low frequency; HF, high frequency; nu, normalized units; LF/HF, relationship between low and high frequency.
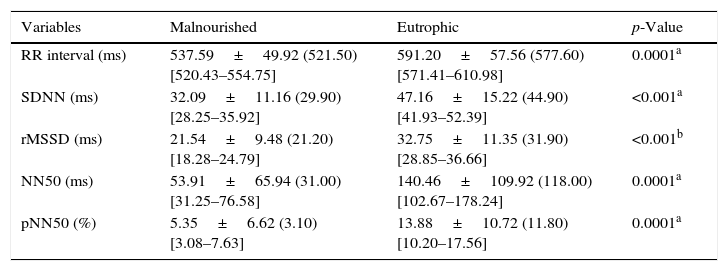
Table 3 shows the values of the HRV indices obtained in the time domain. Statistically significant differences between groups were observed for the RR interval and the SDNN, rMSSD, NN50, and pNN50 indices, with lower values for the malnourished group.
Mean values followed by standard deviations, medians, and 95% confidence intervals for the RR interval, SDNN, rMSSD, NN50, and pNN50 obtained from malnourished and eutrophic children.
| Variables | Malnourished | Eutrophic | p-Value |
|---|---|---|---|
| RR interval (ms) | 537.59±49.92 (521.50) [520.43–554.75] | 591.20±57.56 (577.60) [571.41–610.98] | 0.0001a |
| SDNN (ms) | 32.09±11.16 (29.90) [28.25–35.92] | 47.16±15.22 (44.90) [41.93–52.39] | <0.001a |
| rMSSD (ms) | 21.54±9.48 (21.20) [18.28–24.79] | 32.75±11.35 (31.90) [28.85–36.66] | <0.001b |
| NN50 (ms) | 53.91±65.94 (31.00) [31.25–76.58] | 140.46±109.92 (118.00) [102.67–178.24] | 0.0001a |
| pNN50 (%) | 5.35±6.62 (3.10) [3.08–7.63] | 13.88±10.72 (11.80) [10.20–17.56] | 0.0001a |
SDNN, standard deviation from the mean of all normal RR intervals; rMSSD, square root of the mean squared differences between adjacent normal RR intervals; NN50, number of successive RR intervals which differ by more than 50ms; pNN50, percentage of pairs of consecutive RR intervals whose difference is greater or equal to 50ms.
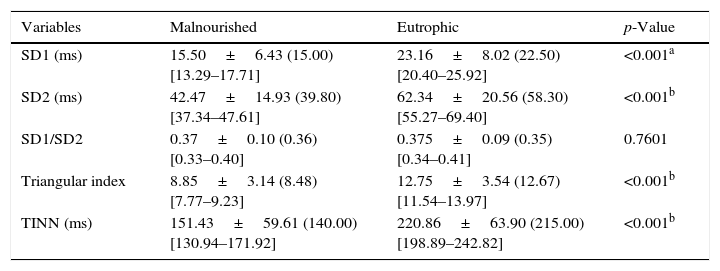
The values of SD1, SD2, SD1/SD2 ratio, triangular index, and TINN can be seen in Table 4. Significant reductions were observed in SD1, SD2, the triangular index, and the TINN in the malnourished group. For the SD1/SD2 ratio, there was no difference between groups.
Mean values followed by standard deviations, medians, and 95% confidence intervals for SD1, SD2, SD1/SD2 ratio, triangular index, and TINN obtained from malnourished and eutrophic children.
| Variables | Malnourished | Eutrophic | p-Value |
|---|---|---|---|
| SD1 (ms) | 15.50±6.43 (15.00) [13.29–17.71] | 23.16±8.02 (22.50) [20.40–25.92] | <0.001a |
| SD2 (ms) | 42.47±14.93 (39.80) [37.34–47.61] | 62.34±20.56 (58.30) [55.27–69.40] | <0.001b |
| SD1/SD2 | 0.37±0.10 (0.36) [0.33–0.40] | 0.375±0.09 (0.35) [0.34–0.41] | 0.7601 |
| Triangular index | 8.85±3.14 (8.48) [7.77–9.23] | 12.75±3.54 (12.67) [11.54–13.97] | <0.001b |
| TINN (ms) | 151.43±59.61 (140.00) [130.94–171.92] | 220.86±63.90 (215.00) [198.89–242.82] | <0.001b |
SD1, standard deviation of the instantaneous variability of beat-to-beat; SD2, standard deviation of long-term continuous RR intervals; TINN, triangular interpolation of RR intervals.
The results obtained by means of the HRV indices suggest that malnourished children have reductions in both sympathetic and parasympathetic modulation of the autonomic nervous system. Furthermore, decreases in SBP and DBP and an increase in heart rate were also observed in malnourished children.
The analysis of the RR interval was significantly lower in the malnourished group, thus indicating increases in heart rate. Corroborating the findings of this study, Sirivastava et al.4 studied 35 children (mean age: 6.06±2.04 years) with mild to moderate levels of malnutrition and found that the values of RR intervals were reduced in these children compared with children considered healthy.
In the present study, both SBP and DBP presented reduced values in the malnourished group. In contrast to the findings of the present study, Sesso et al.13 conducted a cross-sectional study with 172 children over 2 years of age; of these, 91 were classified as malnourished with a Z-score of −1 in relation to height and weight for their age. Of the group of malnourished children, 29% showed an increase in SBP and DBP after adjustment for age, sex, and height when compared with the control children (2%). In addition, the average DBP presented a significant increase in the malnourished children (65.2±0.6mmHg) in relation to the group of healthy children (61.8±0.8mmHg).
There are several mechanisms reported in the literature that explain the relationship between malnutrition in early life and increased blood pressure, such as activation of the renin angiotensin14; changes in structure, function, and vascular length15; increased modulation of the sympathetic autonomic nervous system16; increased insulin sensitivity17; and high glucocorticoid plasma concentrations.18 Thus, malnutrition during childhood may represent a risk factor that should be taken into consideration for the development of hypertension in the future.13
However, it is also worth noting that blood pressure is related to body weight during the growth phase; therefore, malnourished children tend to have lower SBP and DBP since their body mass is smaller,19 a fact that may also be related to the reduced blood pressure values obtained, since the children who belonged to the malnourished group were aged between 3 and 5 years. As the malnourished child grows, blood pressure increases progressively, as demonstrated by other authors.13,16,18
In relation to heart rate, the findings indicate that the group of malnourished children showed higher values compared to the control group (113.46bpm±14.13 [111.0] vs. 104.66±10.55 [105.0], respectively). According Cattermole et al.,20 normal children at 4 years of age must present median values of heart rate of approximately 95.4bpm, with a confidence interval between 74.3 and 124.9bpm. Therefore, for both groups studied the heart rate values were within the normal range for that age, and thus the statistically significant difference observed between the groups apparently does not indicate any clinical implications.
In the present study the rMSSD, SD1, pNN50, NN50, and HF (ms2), which reflect parasympathetic modulation of the autonomic nervous system,5 showed a reduction in the malnourished group compared to the eutrophic group, suggesting that in these children the parasympathetic modulation is reduced. Srivastava et al.4 did not observe changes in the rMSSD and pNN50 indices in children with mild to moderate malnutrition; however, the authors concluded that malnutrition may be related to decreased vagal modulation. Furthermore, a decrease in parasympathetic modulation was also observed in other conditions of nutritional deficit, such as vitamin D deficiency,21 protein restriction,22 and bulimia nervosa.23
It is noteworthy that reduced vagal modulation is associated with an increased risk for morbidity and mortality from all causes and development of various risk factors24; therefore, the results of this study reinforce the importance of early intervention in malnourished children to prevent damage to cardiovascular and metabolic health, and thus promote a better cardiac autonomic modulation response and attenuate possible damage to the body.
The SDNN, SD2, TINN, and triangular index, which represent the overall variability, i.e., both sympathetic and parasympathetic modulation, and the LF index (ms2) that points to the sympathetic modulation,5 as well as the indices previously mentioned, showed a decrease in the malnourished group compared to the eutrophic group. Unlike the observations in the present study, the authors found increased sympathetic modulation in malnourished children, characterized by elevated values in the LF index in normalized units and the LF/HF ratio.4
Several possible mechanisms have been proposed in attempts to explain the observed changes in the sympathetic nervous system. Malnutrition during the critical period of development can lead to autonomic imbalance through morphological changes in several areas of the central nervous system involved in the generation and/or modulation of sympathetic activity, such as the hypothalamus.25 Moreover, one can also observe changes in the release of neurotransmitters in the central nervous system.26
Studies have shown that the sympathetic component of the autonomic nervous system is associated with the mobilization of energy and participates in the control of the glucose metabolism and fat.24,27 Perterson et al.28 demonstrated a relationship between increased body fat and hypoactivity of the sympathetic and parasympathetic components of the autonomic nervous system; in addition, the authors found that lower sympathetic modulation is associated with lower energy expenditure.
The reduction in sympathetic modulation in malnourished children indicates an important clinical condition in order to save energy and consequently, promote a possible positive energy balance. Vanderlei et al.29 described that in obese children there is a decrease in this system, which results in an imbalance between supply and consumption and culminates in body weight gain. Therefore, it is hypothesized that the reduction in sympathetic modulation observed in malnourished children favors the energy balance and may reduce the effects of malnutrition.
The LF and HF indices in normalized units showed no differences in the malnourished group compared to the control. These results were expected, since a decrease in their values in malnourished children was observed when analyzed in ms2. Considering that the LF and HF indices in normalized units are calculated from the area of the power spectrum and a reduction in the spectrum occurs in malnourished children, changes in the values calculated in normalized units were not observed. Moreover, the decrease in both the sympathetic component and the parasympathetic component of the autonomic nervous system justifies the absence of significant differences in the SD1/SD2 and LF/HF ratios of malnourished children compared to the control group.
Conceptually, malnutrition can be defined as the relationship between the reduction in weight and height associated with a deficiency of essential vitamins and minerals.4 Several studies have shown that micronutrient deficiency is correlated with changes in HRV. Singh et al.30 related vitamin D and vitamin E deficiency with modifications in HRV and Mann et al.21 associated vitamin D with changes in autonomic modulation in humans. Thus, it can also be inferred that the reduction in nutrients in malnourished children should be a factor to be taken into account to explain the alterations in cardiac autonomic modulation.
As a limitation of this study, the lack of stratification of the degree of malnutrition in the children can be cited, which could further enrich the discussion of the study. Furthermore, the respiratory rate values were not collected, which could have contributed to a better understanding of the spectral analysis of HRV. However the analysis of autonomic modulation in malnourished children through HRV proved to be an effective method for quick and easy application and, therefore, considering that the tool was able to reflect important aspects of the autonomic nervous system, the importance of its inclusion as a routine measure of control and analysis of cardiac modulation of these children should be emphasized, as well as in effective interventions to eradicate infant malnutrition.
In conclusion, the results suggest that malnourished children present alterations in the autonomic nervous system characterized by a reduction in both sympathetic and parasympathetic modulation. In addition, there was an increase in heart rate and a decrease in blood pressure in this population.
Conflicts of interestThe authors declare no conflicts of interest.
Please cite this article as: Barreto GS, Vanderlei FM, Vanderlei LC, Leite ÁJ. Impact of malnutrition on cardiac autonomic modulation in children. J Pediatr (Rio J). 2016;92:638–44.
Institution to which this work is linked: Universidade Estadual do Ceará, Fortaleza, CE, Brazil.


