


To analyze the predictive capacity of the vertical segmental tetrapolar bioimpedance apparatus in the detection of excess weight in adolescents, using tetrapolar bioelectrical impedance as a reference.
MethodsThis was a cross-sectional study conducted with 411 students aged between 10 and 14 years, of both genders, enrolled in public and private schools, selected by a simple and stratified random sampling process according to the gender, age, and proportion in each institution. The sample was evaluated by the anthropometric method and underwent a body composition analysis using vertical bipolar, horizontal tetrapolar, and vertical segmental tetrapolar assessment. The ROC curve was constructed based on calculations of sensitivity and specificity for each point of the different possible measurements of body fat. The statistical analysis used Student's t-test, Pearson's correlation coefficient, and McNemar's chi-squared test. Subsequently, the variables were interpreted using SPSS software, version 17.0.
ResultsOf the total sample, 53.7% were girls and 46.3%, boys. Of the total, 20% and 12.5% had overweight and obesity, respectively. The body segment measurement charts showed high values of sensitivity and specificity and high areas under the ROC curve, ranging from 0.83 to 0.95 for girls and 0.92 to 0.98 for boys, suggesting a slightly higher performance for the male gender. Body fat percentage was the most efficient criterion to detect overweight, while the trunk segmental fat was the least accurate indicator.
ConclusionThe apparatus demonstrated good performance to predict excess weight.
analisar a capacidade preditiva da bioimpedância tetrapolar segmentada vertical na detecção do excesso de peso em adolescentes, utilizando a bioimpedância tetrapolar horizontal como referência.
Métodosestudo transversal realizado com 411 alunos de 10 a 14 anos, de ambos os sexos, matriculados em escolas públicas e privadas, selecionados por processo amostral aleatório simples e estratificados de acordo com sexo, idade e proporção em cada instituição. Foi realizada avaliação antropométrica e analisada a composição corporal através das bioimpedâncias bipolar vertical, tetrapolar horizontal e tetrapolar segmentada vertical. Foram construídas as curvas ROC com base nos cálculos de sensibilidade/especificidade para cada ponto das diferentes medições possíveis de gordura corporal do equipamento em questão. Posteriormente, foram executados os seguintes testes estatíticos: T de Student, correlação de Pearson e qui-quadrado de McNemar. Para a interpretação das variáveis, utilizou-se o software SPSS 17.0.
Resultadosa amostra foi composta por 53,7% meninas e 46,3% meninos. Do total, 20% e 12,5% exibiram, respectivamente, sobrepeso e obesidade. Os gráficos das medidas dos segmentos corporais refletiram-se em altos valores de sensibilidade e especificidade, além de elevadas áreas sob a curva ROC, que variaram de 0,83 a 0,95 para meninas e de 0,92 a 0,98 para meninos, sugerindo um desempenho levemente superior para o sexo masculino. O percentual de gordura total foi apontado como o critério mais eficiente do equipamento para a detecção do excesso de peso, enquanto a gordura segmentar do tronco apresentou-se como um indicador de precisão inferior.
Conclusãoo aparelho comportou-se satisfatoriamente na predição do excesso de peso.
According to data from the World Health Organization (WHO), the current prevalence of excess weight among developing countries, particularly in urban societies, is already as high as that of developed countries.1 Physical inactivity and the continuing practice of inadequate diet stand out as the possible reasons for the increase in these diseases.2 Additionally, there are strong indications that chronic and metabolic diseases of adulthood begin in childhood, increasing the necessity of clinical monitoring and nutritional surveillance for adequate assessment of health status.3–5
When defining the methods for determining nutritional status, preference should be given to those that better detect alterations that need to be corrected in the study population.6–8 It is also important to consider the financial resources involved, the time and the skill level required to perform them, and the receptivity of the individuals to assessment and the possible risks associated with the methodological processes, such as radiation exposure.9,10
The use of laboratory procedures provides very accurate estimates of fat and fat-free mass components.9 However, because of the high cost of equipment, the methodological sophistication, and the difficulties involved in enrolling the assessed individuals into the measurement protocols, their applications have been limited.10,11 Doubly indirect techniques, among them bioimpedance and anthropometry, are less stringent, but show better practical performance and lower cost, allowing them to be used in both field research and clinical studies.11,12
Although the measurement of body mass index, skin fold thickness, and perimeters – waist circumference, conicity index, and waist/hip and waist/height ratios – are usually among the most widely used methods for determining the body composition of adolescents, both in population and individual nutritional assessment studies, it is noteworthy that the alternative methods of vertical bioimpedance became the most modern, practical, and inexpensive.9–12 In contrast, the real efficiency and reliability of the data obtained through these currently available devices have been poorly explored.13
Thus, this study aims to analyze, in a sample of adolescents, the predictive capacity of a vertical segmental tetrapolar bioimpedance device for detecting excess weight, using the horizontal tetrapolar bioimpedance method as a reference.
MethodsPopulation and study designA cross-sectional epidemiological study was carried out in 2012 with a representative sample of adolescents – aged 10–14 years old – of both genders, enrolled in public elementary municipal, state, and federal schools, as well as private schools in the urban area of the municipality of Juiz de Fora, state of Minas Gerais, Brazil. Students with special needs from the Associação de Pais e Amigos dos Alunos Excepcionais (APAE) were not included in the sample.
Sample calculation and selection processSample size calculation was based on the following criteria: levels of accuracy and significance, respectively, of 2% and 5%; prevalence of 8%14 obesity in the assessed age group, and 20% of losses due to absences of students on data collection days or refusals to participate (lack of consent from the student or parent/guardian).
The student selection process followed this order: first phase (cluster sampling) – public and private institutions were randomly chosen in each region of the municipality; second phase (stratified proportional sampling) – the number of individuals per grade was defined as proportional to the total number of students in each class; third phase (simple random sampling) – the separation of students per school unit and grade followed a random drawing until the required number was achieved.
Anthropometric assessment and body composition measuresA team of trained research assistants (C.F.G., I.M.O., M.S.P., R.F.L., S.M.C., V.S.F.) performed the anthropometric assessment and conducted the body composition data measurements using vertical bipolar, vertical and horizontal segmental tetrapolar, and horizontal tetrapolar bioimpedance analysis.
The nutritional status of the adolescents was determined by body mass index for age. Weight was measured using a Tanita Ironman® (BC-553 model, Tanita®, UK) device capable of measuring bipolar impedance, with a maximum capacity of 136kg; height was measured using an Alturexata® field stadiometer (Alturexata®, MG, Brazil) with a scale in centimeters and accuracy of 1mm. Waist circumference – measured at the midpoint between the iliac crest and the last rib – was obtained by using a simple and inelastic measuring tape, 1.5m long with a 1-mm interval, with the individuals standing with arms away from the trunk and during expiration. All measurements followed the procedures standardized by the WHO.15,16
When assessing segmental body composition, the Tanita Ironman® (BC-553 model, Tanita®, UK) vertical segmental tetrapolar bioimpedance device was used, according to the protocols established in its manual. The following variables were obtained with this assessment: total body fat percentage, segmental fat percentage of the right/left arm, trunk fat percentage, and segmental fat percentage of the right/left leg.
Reference methodTo define excess body fat, horizontal tetrapolar bioimpedance was used as the reference method, having demonstrated high correlation coefficients when compared to the gold standard, dual X-ray absorptiometry (DEXA).11,12,17–19 The technique used as reference in this study is generally preferred for use in population studies, as it is a non-invasive, portable, quickly-applied, and relatively low-cost technique. Additionally, it does not require training, with minimal intra- and inter-rater variations.
The resistance and reactance values were provided by Biodynamics® (model 450, Biodynamics®, WA, USA) and the fat percentage was calculated using the predictive equation of Chumlea et al.20 All subjects were assessed in the supine position on a nonconductive horizontal surface, according to the protocols included in the equipment manual. While the proximal electrodes were placed on the dorsal surface of the wrist joint (aligned to the head of the ulna and the dorsal surface of the ankle), the distal electrodes were placed at the base of the second or third metacarpal phalangeal-joint of the hand and metatarsal-phalangeal joint of the foot.
Excess body fat was considered for girls and boys with fat mass>30% and 25%, respectively.21,22
Ethical aspectsThe project was approved by the Ethics Committee of Universidade Federal de Juiz de Fora (edict 09/2010).
The parents/guardians and principals of schools selected for data collection signed the informed consent after receiving instructions about the research objectives, the protocol, and the procedures.
Statistical analysisThe descriptive analysis was stratified by gender and Student's t-test was used to investigate the differences between the mean values of the collected data. Pearson's correlation was used to assess the associations of the results of the vertical segmental tetrapolar bioimpedance test with the reference method.
To determine the accuracy of the equipment being tested, the sensitivity and specificity of each point of the different possible body fat measurements were calculated. Receiver operator characteristic curves (ROC) were constructed, which were then compared by McNemar's chi-squared test.
The assessed variables were analyzed using SPSS version 17.0 (SPSS Inc. SPSS Statistics for Windows, IL, USA), using a significance level of 5% (p<0.05).
ResultsThe sample consisted of 411 students, of whom 53.7% were girls and 46.3% boys, with a mean age of 12.0±1.3 years. Age distribution was similar between the genders (p=0.318).
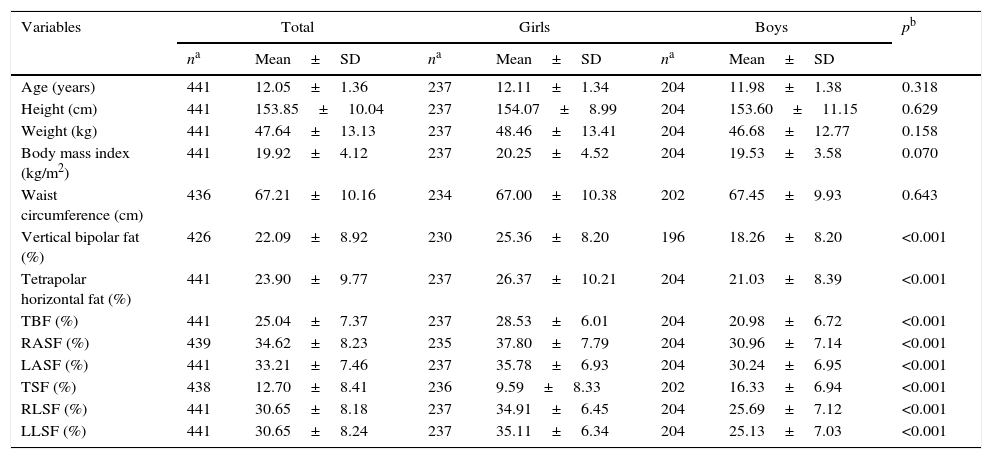
Table 1 shows the anthropometric characteristics of the students submitted to the assessments, considering the mean value of each measured variable and its respective standard deviation. It was verified that 20% and 12.5% of the sample had overweight and obesity, respectively.
Anthropometric characteristics of adolescents. Juiz de Fora, MG, Brazil.
| Variables | Total | Girls | Boys | pb | |||
|---|---|---|---|---|---|---|---|
| na | Mean±SD | na | Mean±SD | na | Mean±SD | ||
| Age (years) | 441 | 12.05±1.36 | 237 | 12.11±1.34 | 204 | 11.98±1.38 | 0.318 |
| Height (cm) | 441 | 153.85±10.04 | 237 | 154.07±8.99 | 204 | 153.60±11.15 | 0.629 |
| Weight (kg) | 441 | 47.64±13.13 | 237 | 48.46±13.41 | 204 | 46.68±12.77 | 0.158 |
| Body mass index (kg/m2) | 441 | 19.92±4.12 | 237 | 20.25±4.52 | 204 | 19.53±3.58 | 0.070 |
| Waist circumference (cm) | 436 | 67.21±10.16 | 234 | 67.00±10.38 | 202 | 67.45±9.93 | 0.643 |
| Vertical bipolar fat (%) | 426 | 22.09±8.92 | 230 | 25.36±8.20 | 196 | 18.26±8.20 | <0.001 |
| Tetrapolar horizontal fat (%) | 441 | 23.90±9.77 | 237 | 26.37±10.21 | 204 | 21.03±8.39 | <0.001 |
| TBF (%) | 441 | 25.04±7.37 | 237 | 28.53±6.01 | 204 | 20.98±6.72 | <0.001 |
| RASF (%) | 439 | 34.62±8.23 | 235 | 37.80±7.79 | 204 | 30.96±7.14 | <0.001 |
| LASF (%) | 441 | 33.21±7.46 | 237 | 35.78±6.93 | 204 | 30.24±6.95 | <0.001 |
| TSF (%) | 438 | 12.70±8.41 | 236 | 9.59±8.33 | 202 | 16.33±6.94 | <0.001 |
| RLSF (%) | 441 | 30.65±8.18 | 237 | 34.91±6.45 | 204 | 25.69±7.12 | <0.001 |
| LLSF (%) | 441 | 30.65±8.24 | 237 | 35.11±6.34 | 204 | 25.13±7.03 | <0.001 |
TBF, total body fat; RASF, right arm segmental fat; LASF, fat segmental left arm; TSF, trunk segmental fat; RLSF, right leg segmental fat; LLSF, left leg segmental fat.
The analysis of body composition data showed significant differences between female and male genders. Girls had higher measures for the following parameters: vertical bipolar body fat (p<0.001), horizontal tetrapolar body fat (p<0.001), vertical tetrapolar body fat (p<0.001), right/left arm segmental fat (p<0.001), and right/left leg segmental fat (p<0.001). Boys showed higher means for the measures of trunk segmental fat (p<0.001).
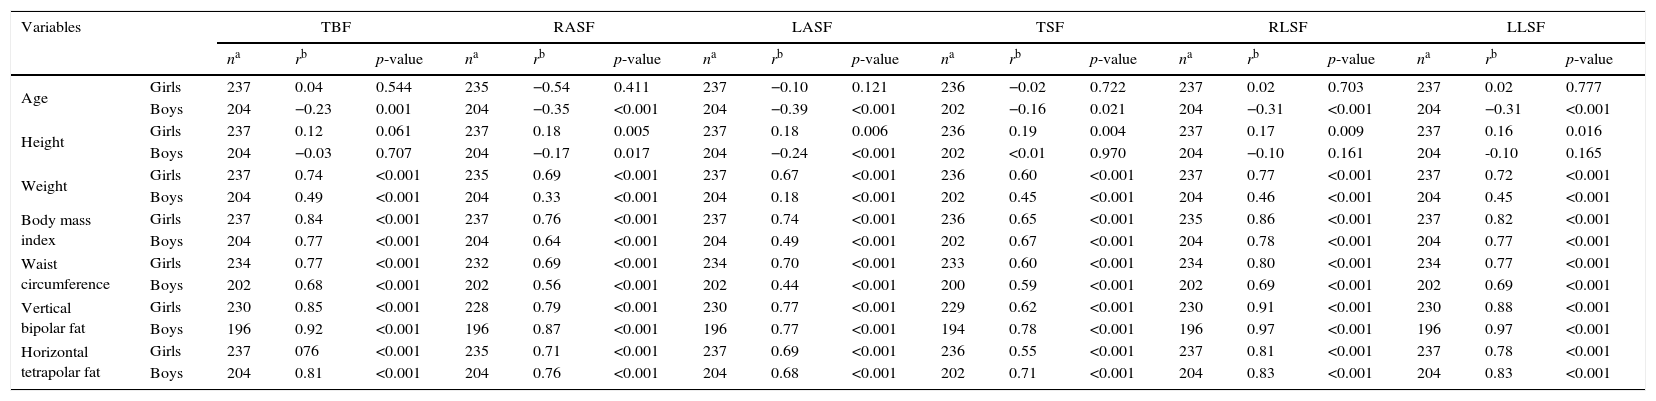
Table 2 shows the correlations of segmental body fat percentage with the other anthropometric variables. Girls showed a significant correlation for the following parameters: height, weight, body mass index, waist circumference, vertical bipolar fat, and horizontal tetrapolar fat. Among boys, significant correlations were found for the following parameters: age, weight, body mass index, waist circumference, vertical bipolar fat, and horizontal tetrapolar fat. Girls showed no significant correlations for any of the body segments with the age variable, whereas boys showed a correlation for some of the body segments with the height variable.
Correlation between segmental body fat percentage and anthropometric variables of adolescents. Juiz de Fora, MG, Brazil.
| Variables | TBF | RASF | LASF | TSF | RLSF | LLSF | |||||||||||||
|---|---|---|---|---|---|---|---|---|---|---|---|---|---|---|---|---|---|---|---|
| na | rb | p-value | na | rb | p-value | na | rb | p-value | na | rb | p-value | na | rb | p-value | na | rb | p-value | ||
| Age | Girls | 237 | 0.04 | 0.544 | 235 | −0.54 | 0.411 | 237 | −0.10 | 0.121 | 236 | −0.02 | 0.722 | 237 | 0.02 | 0.703 | 237 | 0.02 | 0.777 |
| Boys | 204 | −0.23 | 0.001 | 204 | −0.35 | <0.001 | 204 | −0.39 | <0.001 | 202 | −0.16 | 0.021 | 204 | −0.31 | <0.001 | 204 | −0.31 | <0.001 | |
| Height | Girls | 237 | 0.12 | 0.061 | 237 | 0.18 | 0.005 | 237 | 0.18 | 0.006 | 236 | 0.19 | 0.004 | 237 | 0.17 | 0.009 | 237 | 0.16 | 0.016 |
| Boys | 204 | −0.03 | 0.707 | 204 | −0.17 | 0.017 | 204 | −0.24 | <0.001 | 202 | <0.01 | 0.970 | 204 | −0.10 | 0.161 | 204 | -0.10 | 0.165 | |
| Weight | Girls | 237 | 0.74 | <0.001 | 235 | 0.69 | <0.001 | 237 | 0.67 | <0.001 | 236 | 0.60 | <0.001 | 237 | 0.77 | <0.001 | 237 | 0.72 | <0.001 |
| Boys | 204 | 0.49 | <0.001 | 204 | 0.33 | <0.001 | 204 | 0.18 | <0.001 | 202 | 0.45 | <0.001 | 204 | 0.46 | <0.001 | 204 | 0.45 | <0.001 | |
| Body mass index | Girls | 237 | 0.84 | <0.001 | 237 | 0.76 | <0.001 | 237 | 0.74 | <0.001 | 236 | 0.65 | <0.001 | 235 | 0.86 | <0.001 | 237 | 0.82 | <0.001 |
| Boys | 204 | 0.77 | <0.001 | 204 | 0.64 | <0.001 | 204 | 0.49 | <0.001 | 202 | 0.67 | <0.001 | 204 | 0.78 | <0.001 | 204 | 0.77 | <0.001 | |
| Waist circumference | Girls | 234 | 0.77 | <0.001 | 232 | 0.69 | <0.001 | 234 | 0.70 | <0.001 | 233 | 0.60 | <0.001 | 234 | 0.80 | <0.001 | 234 | 0.77 | <0.001 |
| Boys | 202 | 0.68 | <0.001 | 202 | 0.56 | <0.001 | 202 | 0.44 | <0.001 | 200 | 0.59 | <0.001 | 202 | 0.69 | <0.001 | 202 | 0.69 | <0.001 | |
| Vertical bipolar fat | Girls | 230 | 0.85 | <0.001 | 228 | 0.79 | <0.001 | 230 | 0.77 | <0.001 | 229 | 0.62 | <0.001 | 230 | 0.91 | <0.001 | 230 | 0.88 | <0.001 |
| Boys | 196 | 0.92 | <0.001 | 196 | 0.87 | <0.001 | 196 | 0.77 | <0.001 | 194 | 0.78 | <0.001 | 196 | 0.97 | <0.001 | 196 | 0.97 | <0.001 | |
| Horizontal tetrapolar fat | Girls | 237 | 076 | <0.001 | 235 | 0.71 | <0.001 | 237 | 0.69 | <0.001 | 236 | 0.55 | <0.001 | 237 | 0.81 | <0.001 | 237 | 0.78 | <0.001 |
| Boys | 204 | 0.81 | <0.001 | 204 | 0.76 | <0.001 | 204 | 0.68 | <0.001 | 202 | 0.71 | <0.001 | 204 | 0.83 | <0.001 | 204 | 0.83 | <0.001 | |
TBF, total body fat; RASF, right arm segmental fat; LASF, left arm segmental fat; TSF, trunk segmental fat; RLSF, right leg segmental fat; LLSF, left leg segmental fat.
Figs. 1 and 2 show the sensitivity, specificity and ROC curves for the diagnosis of excess weight in the assessed adolescents. The charts of body segment measures were reflected in the high areas under the curve, in addition to high sensitivity and specificity.


Among the girls, the method with the highest sensitivity (92.3% CI: 84.8% to 96.8%) was the measurement of the left leg segmental fat percentage, while the right arm segmental fat measurement showed the best specificity (94.3% CI: 89.0% to 97.5%). The lowest area under the ROC curve (0.83; CI: 0.77 to 0.87) and the lowest sensitivity (68.1% CI: 57.5% to 77.5%) were observed for trunk segmental fat measurement.
Among boys, the method with the highest sensitivity (93.5% CI: 84.3–98.2%) was the measure of segmental fat percentage of the right arm, whereas the assessment of left leg segmental fat percentage showed the best specificity (97.0% CI: 92.5–99.2%). Although it was not characterized with low values when compared to the other assessed parameters, the lowest area under the ROC curve (0.92; CI: 0.88–0.95) and the lowest sensitivity (90.3%; CI: 80.1–96.3%) were also observed for the measurement of segmental body fat.
DiscussionEstablishing a universal anthropometric criterion to assess excess weight in adolescents is more complex than for other age groups, as the variations in body composition during the growth and development process make the analysis methodology more difficult and can impair result reliability.5,6,9,10,13
The nutritional status of adolescents analyzed in this study followed the trend indicated by the Household Budget Survey from 2008 to 2009,14 with a more relevant prevalence of overweight and obesity. The percentage of overweight students (20%) was slightly lower than the national average (23.9%) seen in the age group of 10–15 years. However, the detected obesity cases (12.5%) considerably exceeded the rate reported by the Household Budget Survey for the same age group (6%).
Puberty is the main determinant of physical changes, which are characterized by increase in weight, protein-somatic tissue, and bone mineral mass, both in girls and boys.23,24 However, the increase in body fat is generally higher among women, while lean mass gain is higher in males.13–18 The results of this study confirm this biological observation, as the girls had higher body fat values obtained through the vertical bipolar, horizontal tetrapolar, vertical tetrapolar, and arm and leg segmental techniques. Complementing this conception, some negative correlations were found in boys, which are properly interpreted in opposite directions: the older the age, the lower the percentage of total body fat, segmental fat of the right/left arms, and segmental fat of the right/left legs; the greater the height, the lower the segmental fat percentage of the left arm.
It is worth noting that the body mass index, although demonstrating a good correlation with measures of adiposity in adolescents, does not adequately reflect these variations in body composition that occur in this age group, which are different between the genders.8,25–27 This fact confirms the importance of searching for new methods that are capable of predicting excess fat, even in individuals with normal weight.
Validations of vertical bioimpedance models have been made in comparison with tests that estimate body density, such as hydrodensitometry and DEXA.11,12,17 These methods are seen as the most appropriate and are considered as the gold standard. However, given the economic infeasibility of employing these techniques in population studies, horizontal tetrapolar electrical bioimpedance, which has been tested and validated in adolescents, it is now considered an accessible reference.11–13
The use of the leg–leg method (vertical bipolar bioimpedance) has become common in clinical and epidemiological investigations.11,12 This system, in studies with adult individuals, has shown a performance similar to traditional leg-arm devices (tetrapolar vertical bioimpedance), but has been criticized when used in adolescents.24 However, its disadvantages are limited to individual estimates, and it is well-accepted for body composition assessment in large groups.13,17
There are no reports in the literature that have validated, specifically, the use of models with segmental tetrapolar analysis. Moreover, none of the publications that reported the use of these devices analyzed the correlation of segmental body fat with other variables, whether they were anthropometric, clinical, or biochemical, which limits data comparison. For these reasons, the present results could be compared only with studies that authenticated different bioimpedance equipment.
The significant correlations observed between the percentage of fat in each body segment and the measurements obtained through the vertical bipolar and horizontal tetrapolar bioimpedance reinforce the usefulness of the BC-558 device.
The areas under the ROC curves were also significant and ranged between body segments, from 0.83 to 0.95 for girls and from 0.92 to 0.98 for boys, suggesting a slightly better performance for the male gender. Higher results of areas under the curve were also found by different authors when testing the efficiency of other equipment with adolescents.13,28–30
In general, considering the analysis of sensitivity and specificity in girls and boys, the percentage of total fat was identified as the most effective criterion for the detection of excess weight in adolescents, while trunk segmental fat was an indicator of lower accuracy.
It is noteworthy that new approaches to the analysis of body composition open broad prospects in the assessment, monitoring, and determination of interventions at the physical and nutritional level.6,10,18 However, whenever methods not considered to be the gold standard are used, the possible occurrence of errors must be considered. Moreover, regardless of the reliability of the results obtained, the expansion of anthropometric profile monitoring does not invalidate the importance of prevention strategies.
This research allowed us to conclude that the vertical segmented tetrapolar bioimpedance device behaved satisfactorily in predicting excess weight, as its comparison with horizontal tetrapolar bioimpedance resulted in a relatively small difference in accuracy.
It is expected, above all, that this new equipment will accurately identify changes in body composition of adolescents at an early stage and that it may therefore constitute a more effective and less costly primary health care strategy.
FundingConselho Nacional de Desenvolvimento Científico e Tecnológico.
Conflicts of interestThe authors declare no conflicts of interest.
Conselho Nacional de Desenvolvimento Científico e Tecnológico (CNPq), Fundação de Amparo à Pesquisa do Estado de Minas Gerais (FAPEMIG) and Universidade Federal de Juiz de Fora (UFJF).
Please cite this article as: Neves FS, Leandro DA, Silva FA, Netto MP, Oliveira RM, Cândido AP. Evaluation of the predictive capacity of vertical segmental tetrapolar bioimpedance for excess weight detection in adolescents. J Pediatr (Rio J). 2015;91:551–9.


